01 October 2020: Database Analysis
, , and Are Related to Glucocorticoid-Induced Osteoporosis Occurrence According to Integrated Bioinformatics Analysis
Liuxun Li1ABCDEF, Meiling Yang2BCDEF, Anmin Jin1ABCDEFG*DOI: 10.12659/MSM.925474
Med Sci Monit 2020; 26:e925474


Abstract
BACKGROUND: Glucocorticoid-induced osteoporosis (GIOP) represents the most frequently seen type of secondary osteoporosis, a systemic skeleton disorder. Numerous factors are associated with GIOP occurrence, but there are no specific diagnostic and therapeutic biomarkers for GIOP so far.
MATERIAL AND METHODS: In this work, gene modules related to GIOP were screened through weighted gene coexpression network analysis. Moreover, protein-protein interaction (PPI) networks and gene set enrichment analysis (GSEA) were carried out for hub genes. In addition, microarray GSE30159 dataset was used as a training set to analyze gene expression within bone biopsy samples from patients with endogenous Cushing’s syndrome with GIOP and from normal controls. GSE129228 was used as the test set for investigating the hub gene involvement within GIOP.
RESULTS: According to our results, the turquoise module showed clinical significance, and 10 genes (COL3A1, POSTN, COL6A3, COL14A1, SERPINH1, ASPN, OGN, THY1, NID2, and TNMD) were discovered to be the “real” hub genes within coexpression as well as PPI networks. GSEA showed that the interaction of extracellular matrix receptors together with the focal adhesion pathway had significant enrichment within samples with high COL3A1 and COL6A3 expression. After the results from both test and training sets were overlapped, SERPINH1 was also significantly altered between GIOP and normal control samples.
CONCLUSIONS: COL3A1, COL6A3, and SERPINH1 were identified to be the candidate biomarkers for GIOP.
Keywords: Biological Markers, Glucocorticoids, Osteoporosis, Collagen Type III, Collagen Type VI, Computational Biology, Databases, Nucleic Acid, HSP47 Heat-Shock Proteins
Background
Glucocorticoids are potent anti-inflammatory agents frequently used to treat syndromes related to inflammation. Nonetheless, these widely used agents also lead to serious adverse side effects, including glucocorticoid-induced osteoporosis (GIOP), which shows an increasing incidence over the past few decades, along with a younger trend [1,2]. Compared with treatment for degenerative osteoporosis, GIOP treatment is mainly centered on the molecular biological mechanism and drug efficacy, which are closely associated with the promotion of bone remodeling and skeletal metabolism [3,4]. However, bisphosphonates, calcium supplementation, and additional typical anti-osteoporosis treatments do not yield satisfactory results among patients dependent on steroid agents. Further, there have been no large-scale clinical studies of sufficient duration to prove which drug treatment plan is most effective for GIOP. It is difficult to develop uniform guidelines to manage GIOP because diagnosis and treatment methods differ across diverse countries. At present, bisphosphonate treatment has been utilized as the standard for GIOP care; however, these agents have an undetermined therapeutic effect among patients receiving glucocorticoid treatment for longer than 2 years [5]. Consequently, understanding the precise molecular mechanism of GIOP pathogenesis is necessary for identifying more potent treatments to control osteoporosis occurrence and development. Although many factors, such as osteoclastogenesis [6], apoptosis [7], osteoblast autophagy [8], Wnt/β-catenin signaling pathway [9], and altered intestinal microbiota composition [10], have been found to be associated with GIOP, specific diagnostic and therapeutic biomarkers for GIOP have not yet been identified. As a result, further investigations are warranted to develop more diagnostic and prognostic biomarkers for GIOP.
Bioinformatics analysis is extensively used in screening and analyzing genes linked with the progression of diverse disorders, helping to overcome the limits of experimentation. Numerous gene profiles have been acquired based on public databases, such as Gene Expression Omnibus (GEO) and The Cancer Genome Atlas (TCGA), expanding our knowledge of diseases. Due to different microarray platforms of datasets, sample sizes, and heterogeneities of species and tissues, limitations and inconsistent results may still exist, but integrated bioinformatics approaches may overcome these limitations. Weighted gene coexpression network analysis (WGCNA) has been developed as a novel approach for analyzing gene expression profiles among a variety of samples [11]. WGCNA can analyze gene sets with highly synergistic alterations as well as potential biomarker genes, and thus can be useful in identifying treatment targets according to the associations between gene sets as well as between phenotypes and gene sets. In recent years, WGCNA has been extensively utilized in genomic research, such as Parkinson disease [12], pancreatic cancer [13], glioblastoma [14,15], and non-small cell lung cancer [16].
In recent years, some collagen gene mutations are detected from probands with genetic disorders. Some of them show phenotypes that are difficult to distinguish from common diseases. For example, collagen type III alpha 1 chain (
Material and Methods
SEARCH STRATEGY AND ELIGIBILITY CRITERIA:
The mRNA expression data of patients with GIOP were download from the GEO database (
ESTABLISHMENT OF COEXPRESSION NETWORK AND ANALYSIS OF MODULE FUNCTIONS:
First, expression profiles of differentially expressed genes (DEGs) were examined for screening the appropriate genes and samples. Second, a coexpression network of DEGs was established using ‘WGCNA’ package in R language [23,24]. Afterwards, each pair-wise gene was functioned using Pearson’s correlation matrix. Third, the power function amn=|cmn|β(cmn=Pearson’s correlation between gene m and gene n; amn=adjacency between gene m and gene n) was applied to create a weighted adjacency matrix, while β was the soft threshold factor adopted to stress the strong associations across genes and to penalize the weak relationships. Fourth, topological overlap matrix (TOM) adjacency was converted to measure the gene network connectivity, which was deemed to be the total value of the adjacency to the remaining genes in generating the network. Mean linkage hierarchical clustering was created by the dissimilarity measure based on TOM, and the minimal size (gene group) was set at 50 for the gene dendrogram. Thereafter, genes that had similar expression patterns were clustered within the same gene module. Lastly, the module eigengene dissimilarity was determined. Then, the gene modules were used to perform functional enrichment analyses to identify the related modules affecting GIOP in endogenous CS patients.
IDENTIFICATION OF GIOP STATUS HUB MODULE:
For identifying modules showing significant associations with illness state traits (GIOP vs. non-GIOP), module eigengenes (which represent the first principal component in a module) [22] were associated with the external traits to identify correlations with the highest significance. Meanwhile, module membership (MM) indicated the relationship between gene expression patterns and module eigengenes. At the same time, gene significance (GS) measure was indicative of absolute value relationships of genes with the external traits. In this study, genes that showed the greatest GS and MM values in the modules of interest were identified as the natural candidates in later analysis [23–26].
HUB GENES VALIDATION:
A hub gene is substantially related to other genes within the module, which is suggested in previous studies to display functional significance. This study screened hub genes within the coexpression network from the GIOP phenotype-related module. Subsequently, each hub gene within the module was imported to the Search Tool for the Retrieval of Interacting Genes/Proteins (STRING) (https://string-db.org/) [27], and confidence >0.4 was chosen for creating the PPI network. Later, Cytoscape software (www.cytoscape.org/) [28] was used to visualize the PPI network. Nodes that had a great degree of connectivity were more important to maintaining the network stability. The Cytoscape plug-in CytoHubba was used for calculating every protein node degree. Any gene within the PPI network with a connectivity of ≥5 (node/edge) was screened to be a hub gene. Later, the common hub genes within the coexpression and PPI networks were deemed as “real” hub genes, and they were screened in later analysis. The Venn diagram was constructed using Venny 2.1.0 (https://bioinfogp.cnb.csic.es/tools/venny/index.html) for visualizing the common hub genes in the PPI and coexpression networks. Then, both the training and test sets were used for validation. For training set GSE30159 dataset and test set GSE129228 dataset, the real hub genes were compared between GIOP and normal controls. The paired-sample t-test was used for statistical analysis, and a difference of P<0.05 indicated statistical significance. Figures were plotted using GraphPad Prism (version, 8.0; GraphPad Software, Inc., La Jolla, Ca, USA).
GENE ONTOLOGY ANNOTATION AND KYOTO ENCYCLOPEDIA OF GENES AND GENOMES PATHWAY ENRICHMENT ANALYSES:
Gene Ontology (GO) functional annotation has been developed as an efficient way to carry out functional enrichment in a large scale. In addition, Kyoto Encyclopedia of Genes and Genomes (KEGG) is an extensively applied database that preserves extensive data on drugs, chemical substances, diseases, biological pathways, and genomes. The current work employed the Metascape software (http://metascape.org) [29] in GO as well as KEGG analysis on the DEGs. P<0.05 indicated statistical significance.
GENE SET ENRICHMENT ANALYSIS:
To further determine functions of the candidate hub genes, we conducted GSEA (https://software.broadinstitute.org/gsea/index.jsp) [30] to investigate the enrichment of previously determined biological processes within the DEGs-derived gene rank. Terms enriched in each gene were recognized with the thresholds for false discovery rate (FDR) q-value <0.25 along with nominal P-value <0.05.
Results
INCLUDED STUDY CHARACTERISTICS:
After a careful review, 2 microarray datasets (GSE30159 and GSE129228) were selected from the GEO database [31–33]. GSE30159 was based on platform GPL570 [HG-U133_Plus_2] Affymetrix Human Genome U133 Plus 2.0 Array, and the GSE129228 dataset was based on platform GPL21103 Illumina HiSeq 4000 (Mus musculus). The present study utilized the GSE30159 dataset as the training set for constructing the PPI and coexpression networks for identifying “real” hub genes as well as related pathways. This dataset was obtained from bone biopsies from 18 patients with endogenous CS prior to surgery and at 3 months after surgery. In the study related to the GSE129228 dataset, high-dose dexamethasone was used to establish a mouse steroid-induced osteoporosis model. This dataset contained samples from 6 groups, including 2 normal samples, 2 experimental groups receiving 10 μM dexamethasone alone samples, and 2 GIOP model samples. The GSE129228 dataset was used as the test set for result validation in the current study.
DEGS IDENTIFICATION:
We utilized R language ‘limma’ package to identify DEGs within the GSE30159 microarrays. Using |logFC| ≥1 and P<0.05 as thresholds, 628 DEGs were detected, which included 303 upregulated genes and 325 downregulated genes. Benjamini-Hochberg correction was utilized for adjusted P-values. A volcano plot for DEGs from this microarray is shown in Figure 2.
CONSTRUCTION OF THE WEIGHTED COEXPRESSION NETWORK AND IDENTIFICATION OF HUB MODULES:
Gene coexpression networks were constructed using R language ‘WGCNA’ package. Then, altogether 23 321 genes were obtained. At first, the leading 5000 genes in terms of standard deviation (SD) values were chosen to perform the sample clustering based on phenotype by the use of the average linkage (Figure 3A). It was observed that 18 samples could be basically classified as 2 clusters. In addition, the Pearson’s correlation was also carried out. Power β=9 was chosen for guaranteeing a scale-free network (Figure 3B, 3C). Eight modules in total were mined, and the red, brown, and turquoise modules were the most tightly related to GIOP in endogenous CS patients (Figure 4A, 4B). Thereafter, the interactions among these 8 modules were also examined, followed by the plotting of a network heatmap (Figure 5A). According to these findings, every module served as an independent validation for one another, demonstrating the high level of independence across various modules, as well as the relative gene expression independence for every module. For purposes of exploring coexpression similarity among these 8 modules, eigengene connectivity was assessed, and then consensus correlation was subjected to clustering analysis (Figure 5B). A heatmap drawn on the basis of adjacencies also displayed similar findings (Figure 5C). In addition, intramodular analysis including MM (module significance) and GS (gene significance) was performed in those 8 modules. The turquoise module was then excavated to further explore the highly related genes. Figure 5D displays the scatter plots for GS regarding GIOP traits, together with illness state compared with MM within the turquoise module. In the case of GIOP, GS and MM (Figure 5D) were significantly positively correlated, which suggested that the turquoise module elements with the greatest importance (central) might show high correlation with such external traits.
IDENTIFICATION OF GIOP STATUS HUB GENES WITHIN HUB MODULES:
Subsequently, the DEGs-associated PPI network was used to identify 31 hub genes at the thresholds of connectivity ≥2 and confidence >0.4. The stricter factors were used in additional analyses, including module connectivity determined through absolute Pearson’s correlation coefficient (cor.geneModuleMembership >0.8), together with relationships of clinical characteristics determined based on absolute Pearson’s correlation coefficient (cor.geneTraitSignifcance >0.2). There were 262 highly connected genes identified in the turquoise module, of which, COL3A1, POSTN, COL6A3, COL14A1, SERPINH1, ASPN, OGN, THY1, NID2, and TNMD were detected in both the coexpression and PPI networks (Figure 6A). According to our results, each hub gene within endogenous CS patients with GIOP was upregulated. Therefore, the above 10 genes were identified to be real hub genes indicating GIOP status and were screened in later analyses (Figure 6B).
VALIDATION OF HUB GENES:
To investigate hub genes in endogenous CS with GIOP, the expression levels of COL3A1, POSTN, COL6A3, COL14A1, SERPINH1, ASPN, OGN, THY1, NID2, and TNMD were detected using the training set GSE30159 dataset and the test set GSE129228 dataset, respectively. In the training set, we found all hub genes except POSTN had statistically significant differences in endogenous CS (Figure 7A–7J). In the test set, SERPINH1 and POSTN were significantly upregulated in the GIOP model groups in comparison with the non-GIOP groups, which included CG (normal) and DEX (dexamethasone alone) as control groups (Figure 8A–8H). However, the expression levels of COL14A1 and TNMD were not found in the test set. After overlapping the results from the training set and test set, we found SERPINH1 was altered in the comparison between the GIOP and normal control samples.
GO ANNOTATION AND KEGG PATHWAY ENRICHMENT ANALYSES:
For better understanding of the gene functions within the turquoise module, Metascape software was used to perform GO enrichment analyses. Based on our results, “extracellular matrix” was the gene set with the highest significance (Figure 9A). The analysis also showed that GIOP was associated with blood vessel development, metallopeptidase activity, integrin binding, connective tissue development, regulation of neuron differentiation, response to growth factor, tissue regeneration, regulation of cell morphogenesis, negative regulation of cell migration, regulation of animal organ morphogenesis, syncytium formation by plasma membrane fusion, positive regulation of Ras protein signal transduction, intrinsic component of external side of plasma membrane, ossification, metallocarboxypeptidase activity, negative regulation of cell differentiation, cellular response to vitamin, cell-matrix adhesion, basement membrane, and regulation of the Wnt signaling pathway, planar cell polarity (Figure 9B). Meanwhile, based on KEGG analysis, DEGs were mostly enriched in the pathways in apoptosis, protein digestion and absorption, Rap1 signaling pathway, protein processing in endoplasmic reticulum, and adrenergic signaling in cardiomyocytes (Figure 9C).
GENE SET ENRICHMENT ANALYSIS:
For better elucidating the functions of possible hub genes, we carried out GSEA. The training set was divided into 2 groups according to the label GIOP vs. NON-GIOP. In the GSEA software, normalized enrichment score (NES) is used as a measure of the degree of enrichment, and P-value and FDR are used as measures of statistical significance. The degree of enrichment is scored. If it is positive, the pathway tends to be enriched in genes that are upregulated, and if it is negative, the pathway tends to be enriched in genes that are downregulated. Based on our observations, both gene sets showed correlations with GIOP, and “ECM receptor interaction” (Figure 10A) and “focal adhesion” were enriched (Figure 10B). Moreover, up-regulation of both COL1A3 and COL6A3 was significantly associated with ECM receptor interaction (Table 1) and focal adhesion (Table 2).
Discussion
In the present study in which an integrated bioinformatical study on GIOP was performed, an overlap method was employed to combine WGCNA, PPI network, and GSEA to identify pathway-related genes. As suggested by our results, the turquoise module was recognized to be of clinical significance by WGCNA. In later analyses, 10 genes (
Over the last several years, several GIOP-related genes or gene pathways alterations have been discovered, and these have shed more light on endogenous CS with regard to its pathogenesis. Nonetheless, a large number of articles are single cohort studies, which report diverse findings. Lekva et al. [31] used global gene expression profiles based on bone biopsies of CS cases and identified a gene that coded the GC-induced leucine zipper (GILZ) as an extensively modulated gene within CS. In addition, the mRNA level of COL1A2 and circulating osteocalcin were also found to be related to GIOP. In subsequent experiments, Lekva et al. [32] used the same gene expression profiling and found another gene that encoded TXNIP to be an extensively modulated gene associated with GIOP treatment. In one recent study, Lu et al. [33] applied an RNA sequencing (RNA-seq) technique in combination with bioinformatic analysis and discovered that endothelial progenitor cell extracellular vesicles avoided GIOP in mice through inhibition of the ferroptotic pathway within osteoblasts. To better understand the pathogenesis of GIOP, potential biomarkers were identified using an integrated bioinformatics analysis combined with gene expression profile analysis in the present study.
Currently, bioinformatic analysis allows for identifying vital molecular networks based on gene expression data. In addition, integration of multiple-gene microarrays can help to identify the gene biomarkers with higher accuracy. Moreover, those integrated bioinformatic approaches contribute to overcoming hurdles in identifying GIOP-related hub genes. Consequently, the present work used the gene expression profile datasets of 2 cohorts in diverse groups in combination with bioinformatic approaches to analyze raw data and identify new disease pathogenesis as well as novel diagnostic and prognostic biomarkers. In accordance with Lekva et al. [31],
To further investigate the effects of hub genes on modulating GIOP, we conducted a gene functional enrichment analysis. First of all, GO functional annotation and KEGG analyses were carried out. According to GO analysis, the hub genes that we identified showed significant enrichment in the ECM, which includes a complicated mixture of functional and structural macromolecules that play vital roles during organ and tissue morphogenesis, as well as in tissue and cell structural and functional maintenance. Such associations allow direct or indirect control of cellular events, such as proliferation, differentiation, migration, adhesion, and apoptosis. Additionally, integrins play roles as mechanoreceptors, which provide a physical link for transmitting force between the cytoskeleton and the ECM. According to the results of the KEGG pathway enrichment analysis, the apoptosis-related pathway was the most significantly enriched. Consequently, the effects of
Downregulation of
Similar to results obtained in our analysis, a previous study reported SERPINH1 leads to telomerase deficiency by engaging in ECM, which blocked the differentiation of bone marrow stem cells to osteoblasts, finally affecting their proliferation, commitment, maturation, and matrix mineralization [50]. Furthermore, a previous study reported that the specificity of SERPINH1 expression in skeletal tissues was related to the
In total, the integrated bioinformatic research was conducted on GIOP in the current work, and an overlap method was employed to combine WGCNA, PPI network, and GSEA pathway-related genes. Subsequently, the datasets were restricted to the matched GIOP with non-GIOP samples, and then the hub genes in every dataset were analyzed using the paired-sample t-test. Since rigorous screening approaches were utilized, our findings may have a high specificity for the detection of key molecules related to GIOP. Nonetheless, certain limitations should still be noted. First, this work was conducted based on microarray data collected via the GSE30159 dataset, which had a small sample size. Therefore, if the database has samples updates, more studies are warranted in the future. Second, different hub genes and enriched functions were found in our work, but the relationships need to be examined further. Because most of our recognized genes had not been previously associated with GIOP, further studies are needed to validate such gene expression within GIOP as well as healthy control tissue samples. Also, cells isolated from GIOP tissue samples should be cultured
Conclusions
In conclusion, this work applied an integrated method, including WGCNA, PPI network, and GSEA, in identifying and validating hub genes related to GIOP. Our findings explained, from a bioinformatics perspective, the potential key genes (
Figures
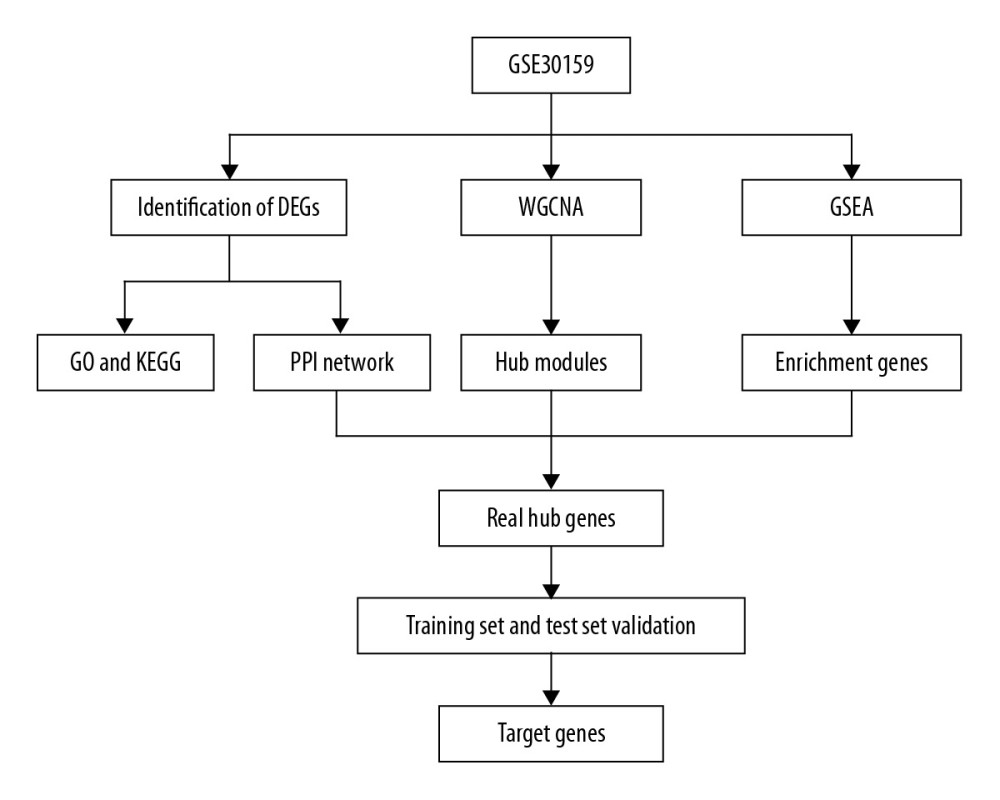 Figure 1. Study flow diagram. DEGs – differentially expressed genes; WGCNA – weighted gene coexpression network analysis; PPI – protein–protein interaction; GSEA – gene set enrichment analysis; GO – gene ontology; KEGG – Kyoto Encyclopedia of Genes and Genomes.
 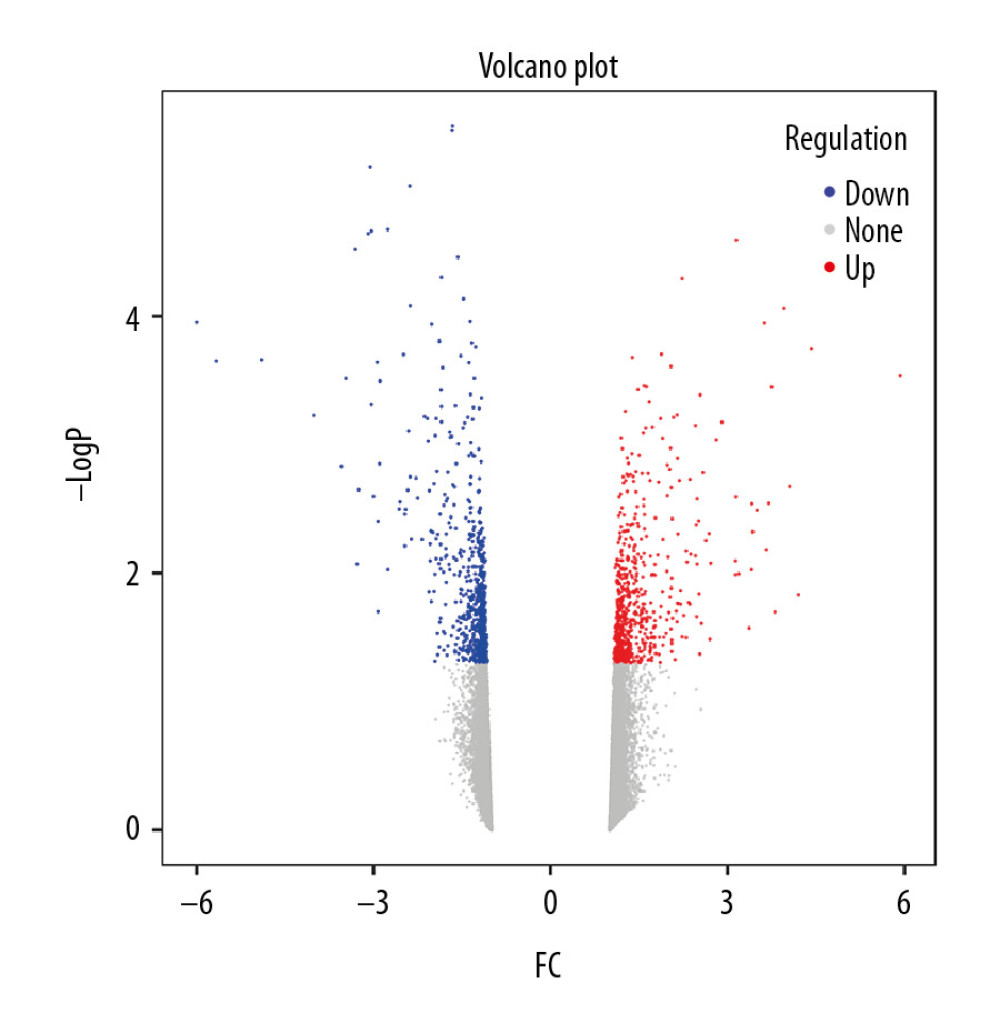 Figure 2. Volcano plot of DEGs. The red nodes represent upregulated genes selected upon the |log2FC| ≥1.0 and P<0.05 thresholds, while the blue nodes stand for downregulated genes selected upon the |log2FC| ≥1.0 and P<0.05 thresholds, and the gray nodes indicate the nonsignificant genes. DEGs – differentially expressed genes; FC – fold change.
 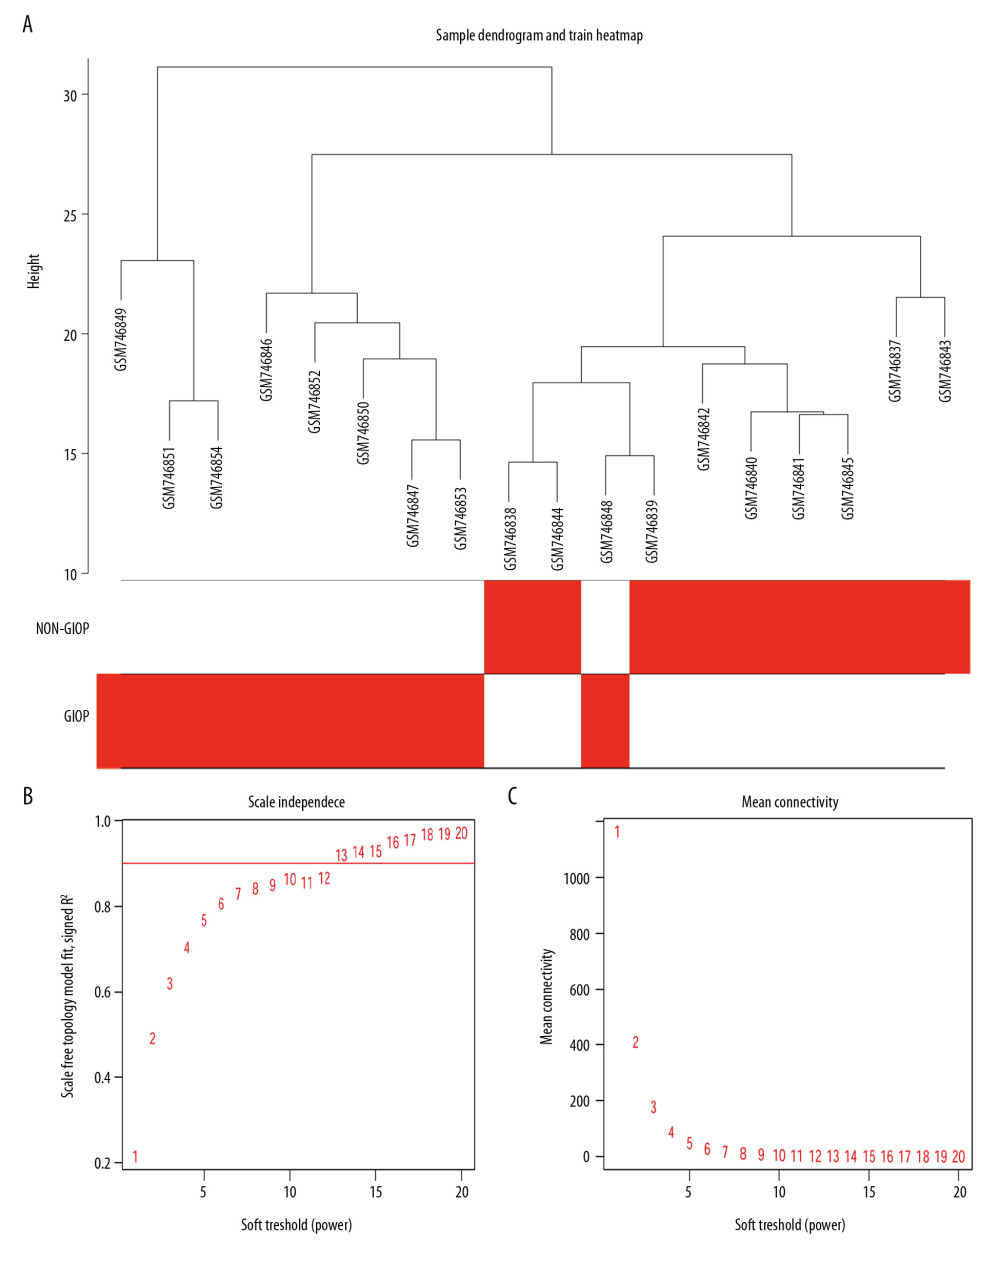 Figure 3. Sample clustering and soft-threshold power determination. (A) Hierarchical clustering dendrogram and the microarray sample trait. GIOP and non-GIOP samples can be classified. (B) Scale-free fit index analyses to determine different soft threshold powers (β). (C) Mean connectivity analyses to determine different soft threshold powers. GIOP – glucocorticoid-induced osteoporosis; WGCNA – weighted gene coexpression network analysis.
 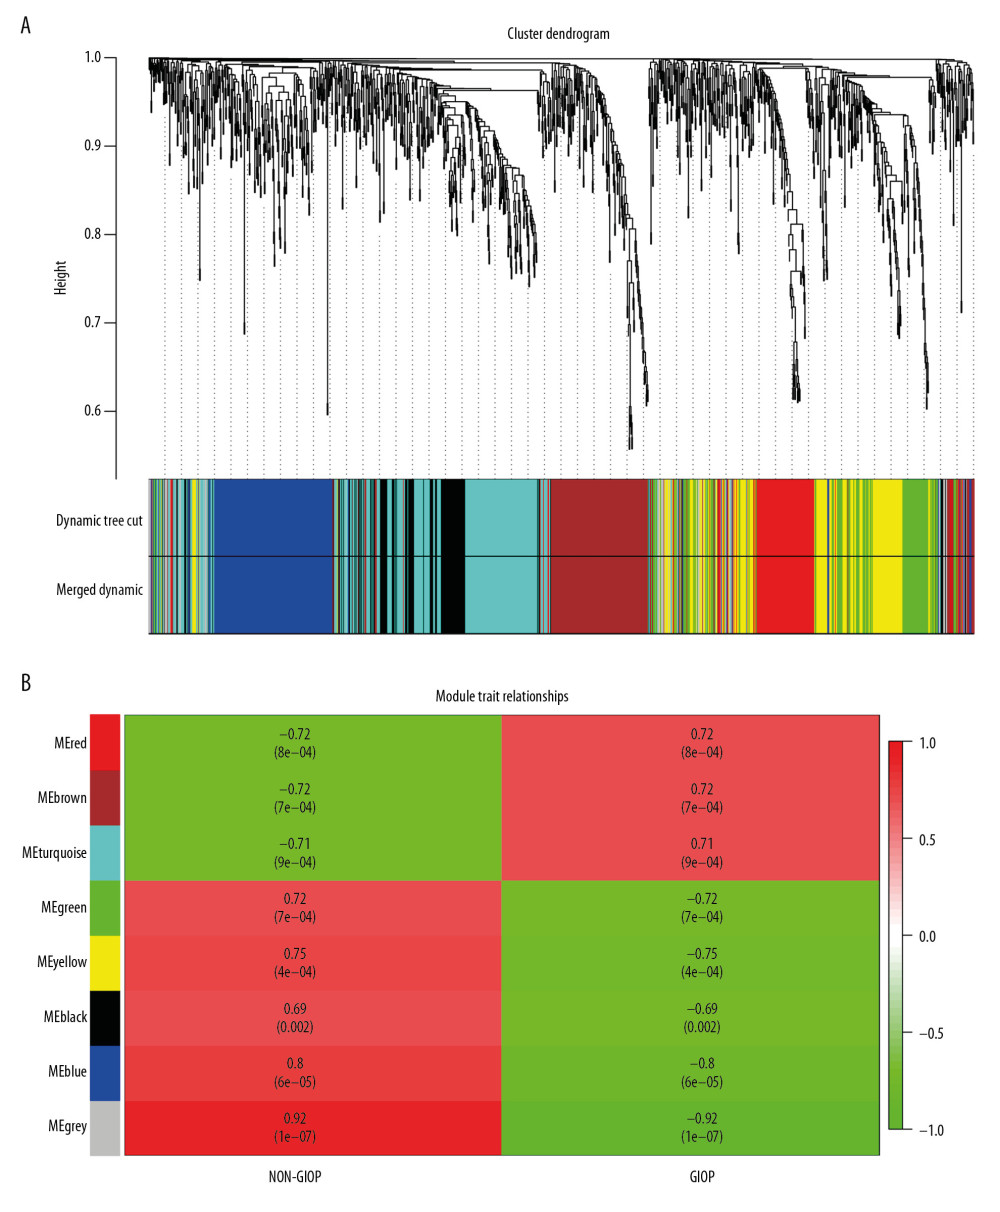 Figure 4. Hub module selection. (A) Dendrogram of all DEGs clustered according to a dissimilarity measure (1-TOM). (B) Heatmap of the relationships of module with the disease traits. In the module, the greater mean gene relevance stands for the greater relationship of this module with the traits of interest. The horizontal and vertical axes stand for clinical factors and modules, respectively. The color gradient from red to green represents the shift from positive to negative correlation. The numbers in grids represent correlation coefficients. Values in parenthesis are the P-values for the association test. The red, brown, and turquoise gene modules are positively related to GIOP status, values in the figure indicate the correlation coefficient between modules and clinical traits. TOM – topological overlap matrix; DEGs – differentially expressed genes; Me – module; GIOP – glucocorticoid-induced osteoporosis.
 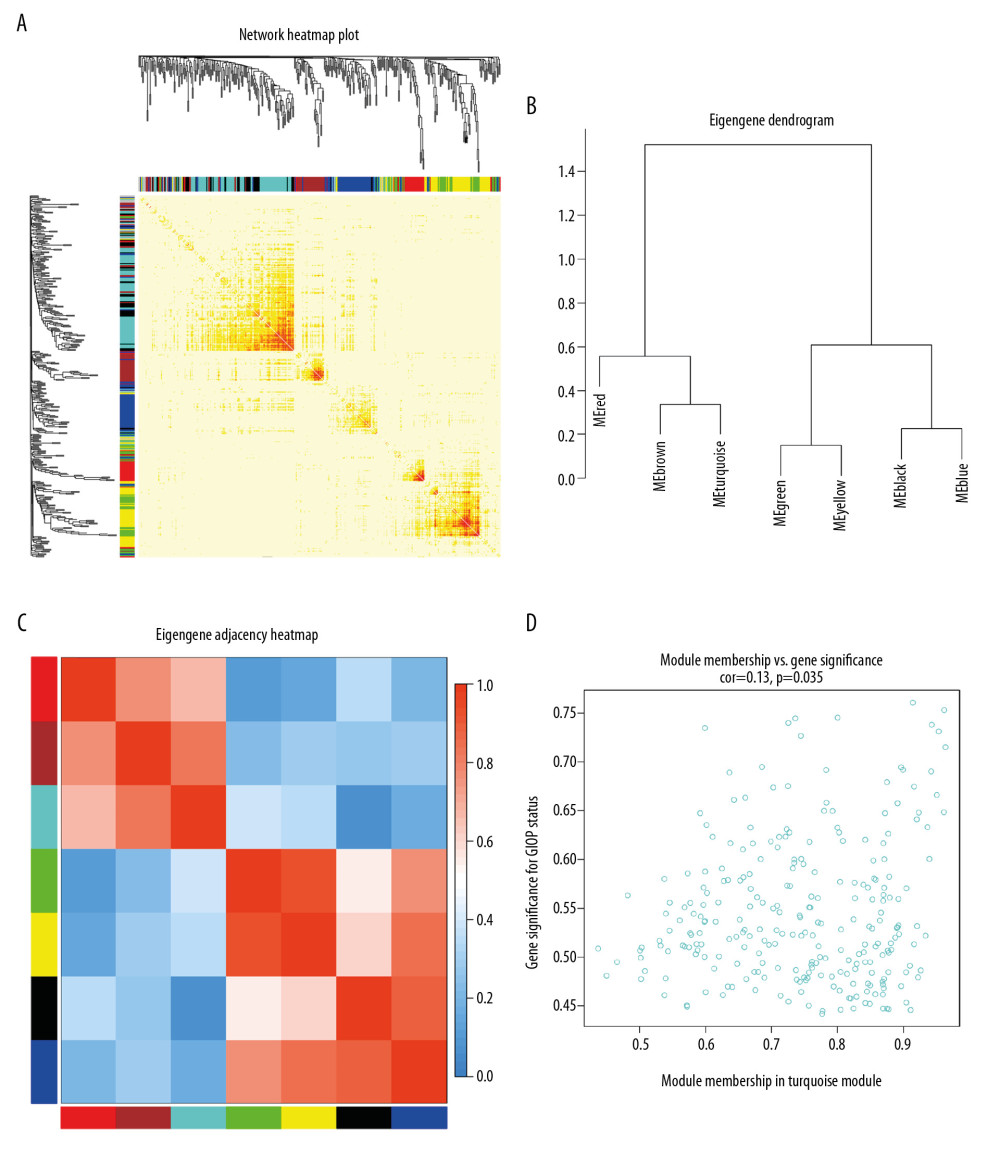 Figure 5. Identification of GIOP status hub genes within the hub module. (A) Correlations among the coexpression genes. On both vertical and horizontal axes, the diverse colors indicate diverse modules. In diverse modules, the yellow brightness at the center represents the connectivity degree. Differences in the relationships across diverse modules are not significant, illustrating that the above modules are highly independent from each other. (B) Dendrogram showing the eigengenes in the consensus module acquired based on WGCNA regarding consensus correlations. (C) Heat map showing the module adjacency. The blue color indicates low adjacency (inverse relationship), while the red color stands for close adjacency (positive relationship). (D) Scatter plot showing the module eigengenes in the turquoise module. GIOP – glucocorticoid-induced osteoporosis; WGCNA – weighted gene coexpression network analysis.
 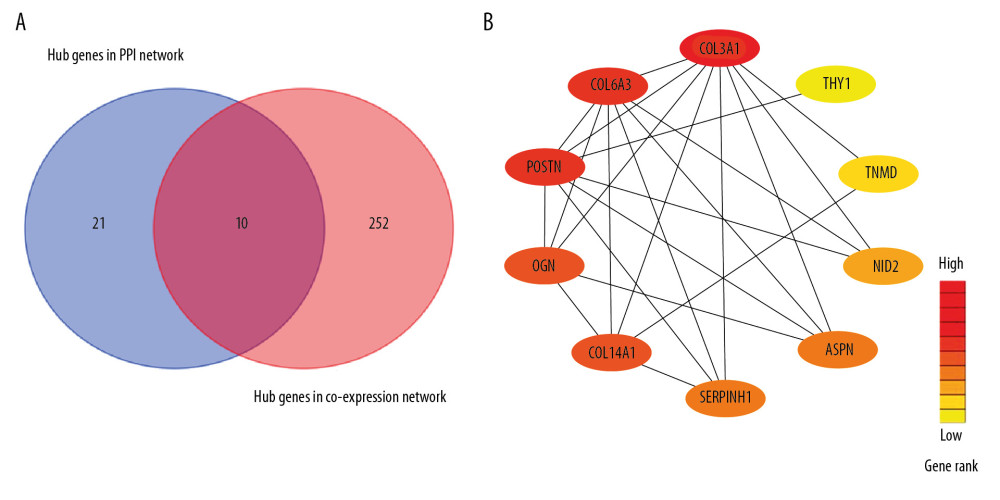 Figure 6. Detection of hub genes. (A) A Venn diagram presenting hub genes under coexpression and those involved in the PPI network. (B) Ten hub genes (COL3A1, POSTN, COL6A3, COL14A1, SERPINH1, ASPN, OGN, THY1, NID2, and TNMD) overlapped between the PPI and the coexpression networks. In the heat map, intensity and color of hub genes are shown at right, which represent the gene rank 1 to 10. PPI, protein-protein interaction; COL3A1 – collagen type III alpha 1 chain; POSTN – periostin; COL6A3 – collagen type VI alpha 3 chain; COL14A1 – collagen type XIV alpha 1 chain; SERPINH1 – serpin family H member 1; ASPN – asporin; OGN – osteoglycin; THY1 – Thy-1 cell surface antigen; NID2 – nidogen 2; TNMD – tenomodulin.
 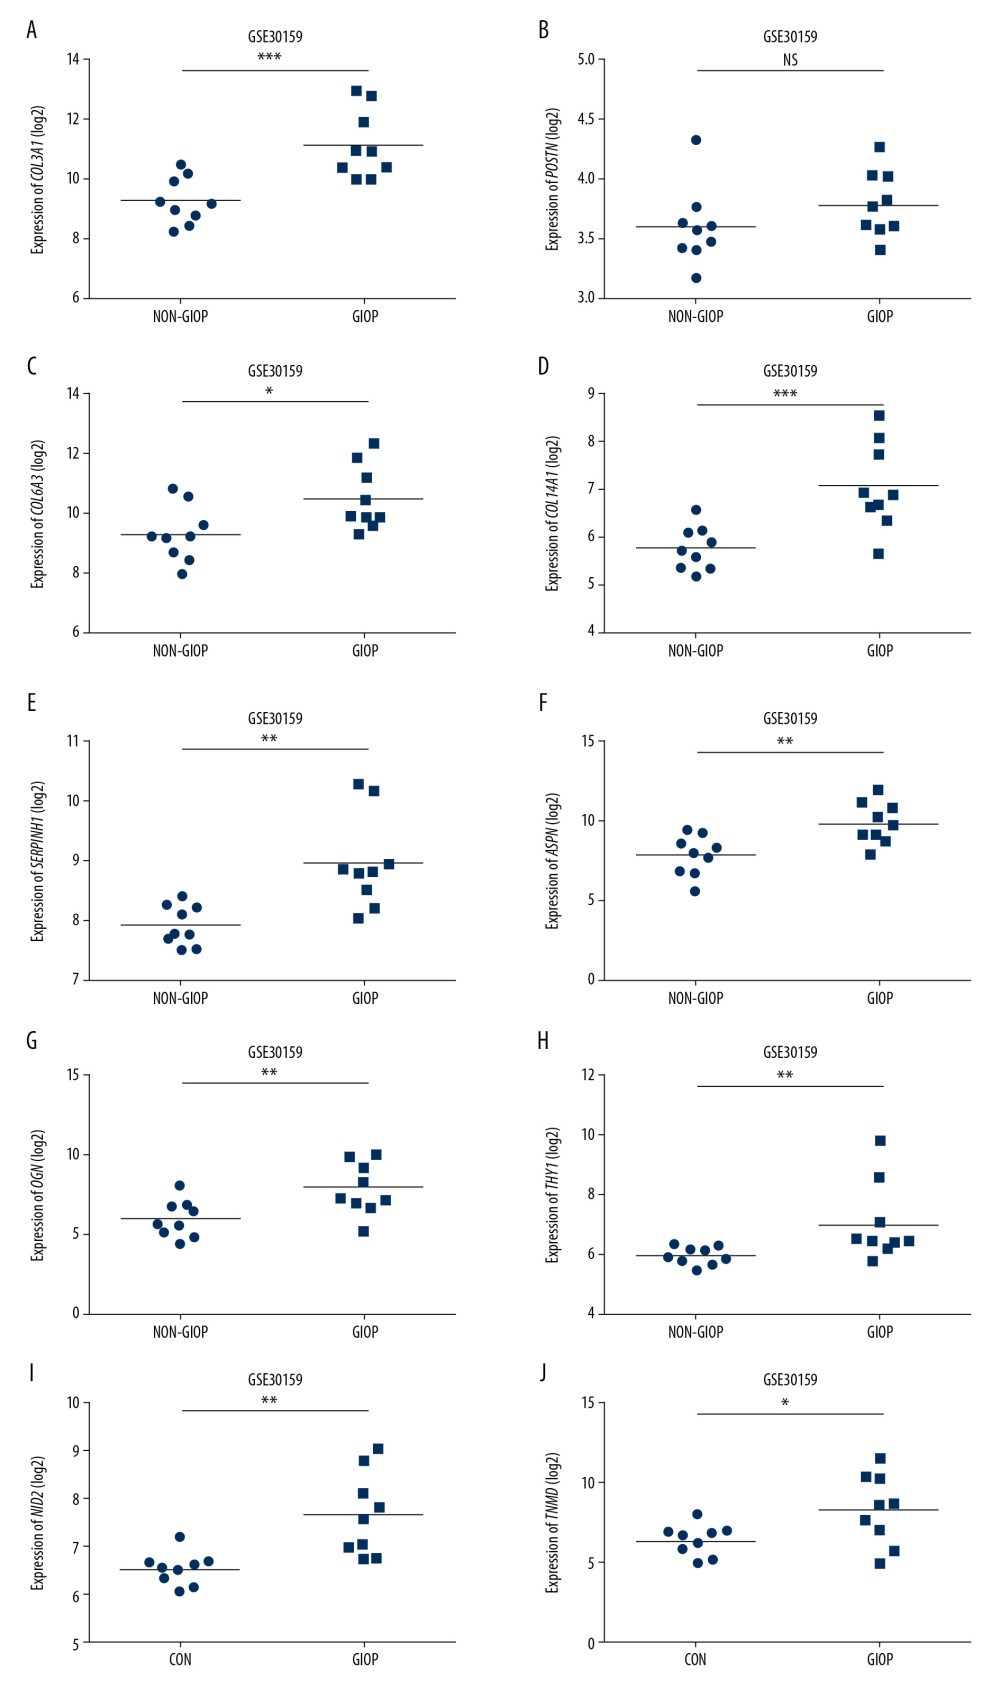 Figure 7. Hub gene validation based on training set (GSE30159). The mRNA level of 10 hub genes was validated in GIOP samples compared with normal samples. All hub genes except POSTN revealed statistically significant differences in GIOP. (A) COL3A1, (B) POSTN, (C) COL6A3, (D) COL14A1, (E) SERPINH1, (F) ASPN, (G) OGN, (H) THY1, (I) NID2, (J) TNMD. * P<0.05, ** P<0.01, *** P<0.001, NS – not significant. GIOP – glucocorticoid-induced osteoporosis; NON-GIOP – control group; COL3A1 – collagen type III alpha 1 chain; POSTN – periostin; COL6A3 – collagen type VI alpha 3 chain; COL14A1 – collagen type XIV alpha 1 chain; SERPINH1 – serpin family H member 1; ASPN – asporin; OGN – osteoglycin; THY1 – Thy-1 cell surface antigen; NID2 – nidogen 2; TNMD – tenomodulin.
 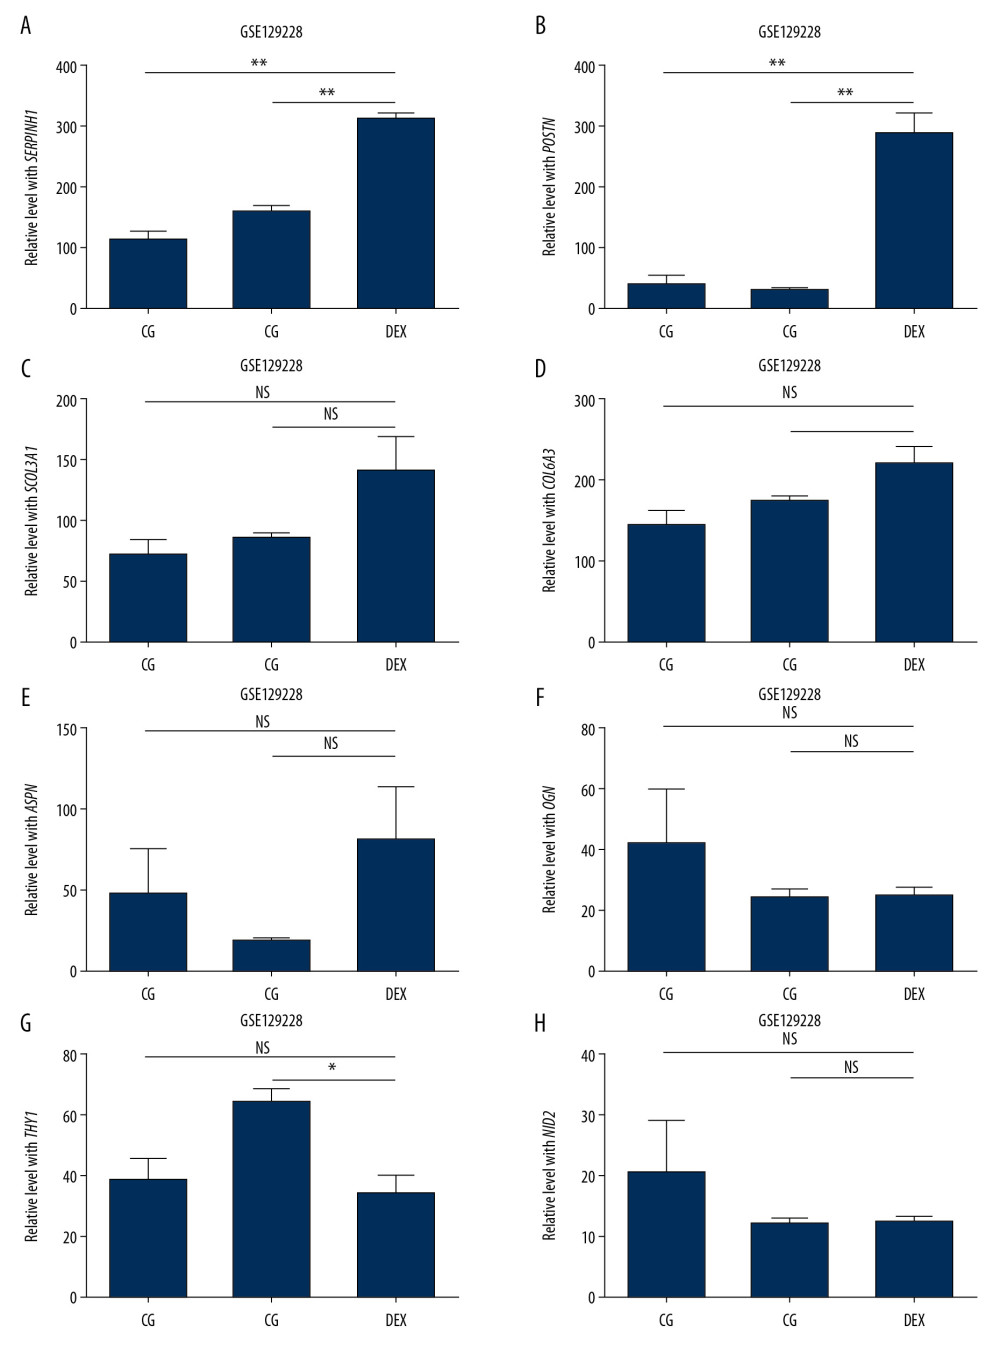 Figure 8. Hub gene validation based on test set (GSE129228). The mRNA level of 10 hub genes was validated in GIOP model samples compared with normal samples. SERPINH1 and POSTN were significantly upregulated in GIOP model groups in comparison to non-GIOP groups. (A) SERPINH1, (B) COL3A1, (C) POSTN, (D) COL6A3, (E) ASPN, (F) OGN, (G) THY1, (H) NID2. * P<0.05, ** P<0.01; NS – not significant; CG – control group; DEX – dexamethasone; GIOP – glucocorticoid-induced osteoporosis; SERPINH1 – serpin family H member 1; POSTN – periostin; COL3A1 – collagen type III alpha 1 chain; COL6A3 – collagen type VI alpha 3 chain; ASPN – asporin; OGN – osteoglycin; THY1 – Thy-1 cell surface antigen; NID2 – nidogen 2.
 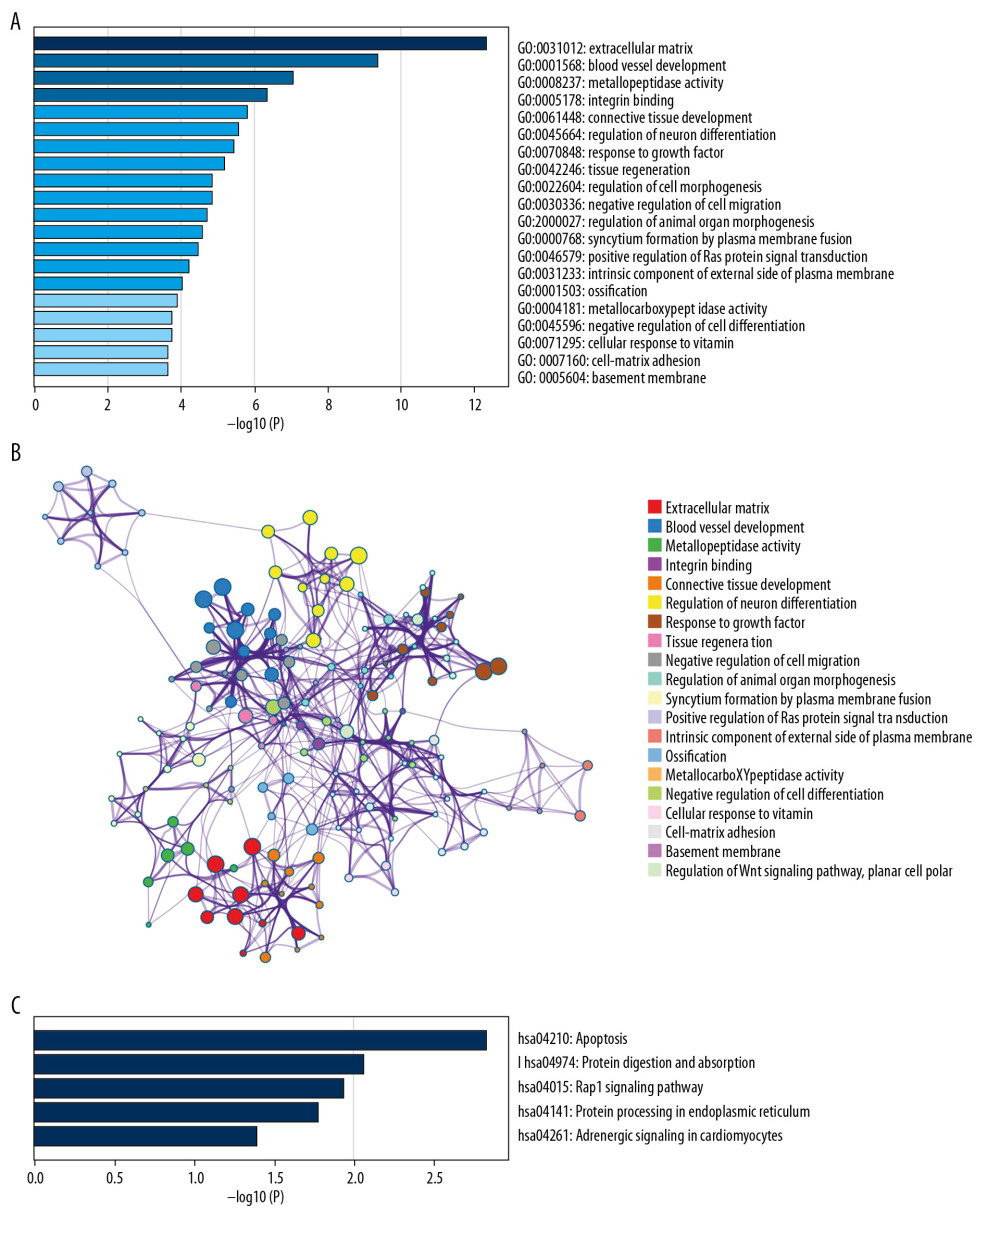 Figure 9. Functional enrichment and pathway analysis of DEGs by Metascape analysis. (A) Top 20 clusters functional enrichment of DEGs. (B) Interconnections between these top 20 clusters functional enrichment terms illustrated with network analysis. Nodes of the same color are representative of same cluster. (C) KEGG pathways of DEGs. KEGG, Kyoto Encyclopedia of Genes and Genomes; DEGs, differentially expressed genes.
 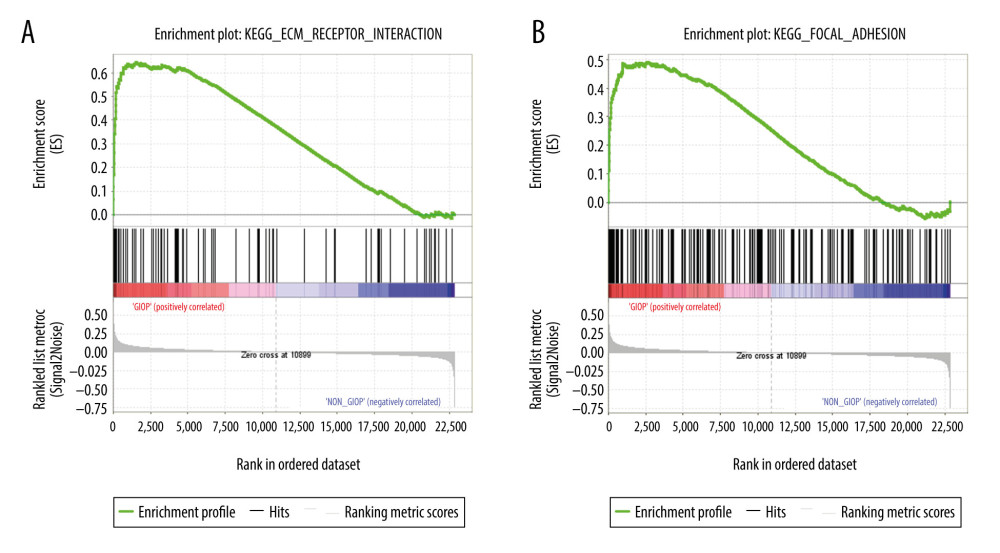 Figure 10. GSEA of GIOP status in the GEO dataset. Two functional gene sets enriched in GIOP status with high expression of hub genes are shown. In the expression heatmap figures, the red color stands for upregulated genes, while the blue color indicates the downregulated genes. (A) ECM receptor interaction (B) Focal adhesion. ECM – extracellular matrix; GSEA – Gene Set Enrichment Analysis; GIOP – glucocorticoid-induced osteoporosis; GEO – Gene Expression Omnibus.
 References
1. Buckley L, Guyatt G, Fink HA, 2017 American College of Rheumatology guideline for the prevention and treatment of glucocorticoid-induced osteoporosis: Arthritis Rheumatol, 2017; 69(8); 1521-37
2. Kubo T, Ueshima K, Saito M, Clinical and basic research on steroid-induced osteonecrosis of the femoral head in Japan: J Orthop Sci, 2016; 21(4); 407-13
3. Schacht E, Dukas L, Richy F, Combined therapies in osteoporosis: Bisphosphonates and vitamin D-hormone analogs: J Musculoskelet Neuronal Interact, 2007; 7(2); 174-84
4. Kerachian MA, Séguin C, Harvey EJ, Glucocorticoids in osteonecrosis of the femoral head: A new understanding of the mechanisms of action: J Steroid Biochem Mol Biol, 2009; 114(3–5); 121-28
5. Teitelbaum SL, Bone: The conundrum of glucocorticoid-induced osteoporosis: Nat Rev Endocrinol, 2012; 8(8); 451-52
6. Conaway HH, Henning P, Lie A, Glucocorticoids employ the monomeric glucocorticoid receptor to potentiate vitamin D3 and parathyroid hormone-induced osteoclastogenesis: FASEB J, 2019; 33(12); 14394-409
7. Rauch A, Seitz S, Baschant U, Glucocorticoids suppress bone formation by attenuating osteoblast differentiation via the monomeric glucocorticoid receptor: Cell Metab, 2010; 11(6); 517-31
8. Lian WS, Ko JY, Chen YS, Chaperonin 60 sustains osteoblast autophagy and counteracts glucocorticoid aggravation of osteoporosis by chaperoning RPTOR: Cell Death Dis, 2018; 9(10); 938
9. Ma J, Shi C, Liu Z, Hydrogen sulfide is a novel regulator implicated in glucocorticoids-inhibited bone formation: Aging (Albany NY), 2019; 11(18); 7537-52
10. Schepper JD, Collins F, Rios-Arce ND, Involvement of the gut microbiota and barrier function in glucocorticoid-induced osteoporosis: J Bone Miner Res, 2020; 35(4); 801-20
11. Langfelder P, Horvath S, WGCNA: An R package for weighted correlation network analysis: BMC Bioinformatics, 2008; 9; 559
12. Chuang YH, Paul KC, Bronstein JM, Parkinson’s disease is associated with DNA methylation levels in human blood and saliva: Genome Med, 2017; 9(1); 76
13. Yan J, Wu L, Jia C, Development of a four-gene prognostic model for pancreatic cancer based on transcriptome dysregulation: Aging (Albany NY), 2020; 12(4); 3747-70
14. Luo Z, Wang W, Li F, Pan-cancer analysis identifies telomerase-associated signatures and cancer subtypes: Mol Cancer, 2019; 18(1); 106
15. Zhong S, Bai Y, Wu B, Selected by gene co-expression network and molecular docking analyses, ENMD-2076 is highly effective in glioblastoma-bearing rats: Aging (Albany NY), 2019; 11(21); 9738-66
16. Huang J, Li Y, Lu Z, Analysis of functional hub genes identifies CDC45 as an oncogene in non-small cell lung cancer – a short report: Cell Oncol (Dordr), 2019; 42(4); 571-78
17. Liu Y, Ming L, Luo H, Integration of a calcined bovine bone and BMSC-sheet 3D scaffold and the promotion of bone regeneration in large defects: Biomaterials, 2013; 34(38); 9998-10006
18. Cui Z, Crane J, Xie H, Halofuginone attenuates osteoarthritis by inhibition of TGF-β activity and H-type vessel formation in subchondral bone: Ann Rheum Dis, 2016; 75(9); 1714-21
19. Mesh CL, Baxter BT, Pearce WH, Collagen and elastin gene expression in aortic aneurysms: Surgery, 1992; 112(2); 256-62
20. Wang J, Pan W, The biological role of the collagen alpha-3 (VI) chain and its cleaved C5 domain fragment endotrophin in cancer: Onco Targets Ther, 2020; 13; 5779-93
21. Schwarze U, Cundy T, Pyott SM, Mutations in FKBP10, which result in Bruck syndrome and recessive forms of osteogenesis imperfecta, inhibit the hydroxylation of telopeptide lysines in bone collagen: Hum Mol Genet, 2013; 22(1); 1-17
22. Langfelder P, Horvath S, Eigengene networks for studying the relationships between co-expression modules: BMC Syst Biol, 2007; 1; 54
23. Horvath S, Zhang B, Carlson M, Analysis of oncogenic signaling networks in glioblastoma identifies ASPM as a molecular target: Proc Natl Acad Sci USA, 2006; 103(46); 17402-7
24. Ghazalpour A, Doss S, Zhang B, Integrating genetic and network analysis to characterize genes related to mouse weight: PLoS Genet, 2006; 2(8); e130
25. Fuller TF, Ghazalpour A, Aten JE, Weighted gene coexpression network analysis strategies applied to mouse weight: Mamm Genome, 2007; 18(6–7); 463-72
26. Oldham MC, Horvath S, Geschwind DH, Conservation and evolution of gene coexpression networks in human and chimpanzee brains: Proc Natl Acad Sci USA, 2006; 103(47); 17973-78
27. Szklarczyk D, Franceschini A, Wyder S, STRING v10: protein-protein interaction networks, integrated over the tree of life: Nucleic Acids Res, 2015; 43(Database issue); D447-52
28. Shannon P, Markiel A, Ozier O, Cytoscape: A software environment for integrated models of biomolecular interaction networks: Genome Res, 2003; 13(11); 2498-504
29. Zhou Y, Zhou B, Pache L, Metascape provides a biologist-oriented resource for the analysis of systems-level datasets: Nat Commun, 2019; 10(1); 1523
30. Subramanian A, Kuehn H, Gould J, GSEA-P: A desktop application for Gene Set Enrichment Analysis: Bioinformatics, 2007; 23(23); 3251-53
31. Lekva T, Bollerslev J, Kristo C, The glucocorticoid-induced leucine zipper gene (GILZ) expression decreases after successful treatment of patients with endogenous Cushing’s syndrome and may play a role in glucocorticoid-induced osteoporosis: J Clin Endocrinol Metab, 2010; 95(1); 246-55
32. Lekva T, Ueland T, Bøyum H, TXNIP is highly regulated in bone biopsies from patients with endogenous Cushing’s syndrome and related to bone turnover: Eur J Endocrinol, 2012; 166(6); 1039-48
33. Lu J, Yang J, Zheng Y, Extracellular vesicles from endothelial progenitor cells prevent steroid-induced osteoporosis by suppressing the ferroptotic pathway in mouse osteoblasts based on bioinformatics evidence: Sci Rep, 2019; 9(1); 16130
34. Liu J, Zhou S, Li S, Eleven genes associated with progression and prognosis of endometrial cancer (EC) identified by comprehensive bioinformatics analysis: Cancer Cell Int, 2019; 19; 136
35. Ma X, Liu C, Xu X, Biomarker expression analysis in different age groups revealed age was a risk factor for breast cancer: J Cell Physiol, 2020; 235(5); 4268-78
36. Kuivaniemi H, Tromp G, Prockop DJ, Mutations in collagen genes: Causes of rare and some common diseases in humans: FASEB J, 1991; 5(7); 2052-60
37. Mullin BH, Zhu K, Xu J, Expression quantitative trait locus study of bone mineral density GWAS variants in human osteoclasts: J Bone Miner Res, 2018; 33(6); 1044-51
38. Nanni L, Brahnam S, Lumini A, Combining multiple approaches for gene microarray classification: Bioinformatics, 2012; 28(8); 1151-57
39. Lekva T, Bollerslev J, Kristo CL, The glucocorticoid-induced leucine zipper gene (GILZ) expression decreases after successful treatment of patients with endogenous Cushing’s syndrome and may play a role in glucocorticoid-induced osteoporosis: Endocr Rev, 2009; 30(7); 932
40. Van Offel JF, Schuerwegh AJ, Bridts CH, Effect of bisphosphonates on viability, proliferation, and dexamethasone-induced apoptosis of articular chondrocytes: Ann Rheum Dis, 2002; 61(10); 925-28
41. Weinstein RS, Chen JR, Powers CC, Promotion of osteoclast survival and antagonism of bisphosphonate-induced osteoclast apoptosis by glucocorticoids: J Clin Invest, 2002; 109(8); 1041-48
42. Plotkin LI, Weinstein RS, Parfitt AM, Prevention of osteocyte and osteoblast apoptosis by bisphosphonates and calcitonin: J Clin Invest, 1999; 104(10); 1363-74
43. Weinstein RS, Jilka RL, Parfitt AM, Manolagas SC, Inhibition of osteoblastogenesis and promotion of apoptosis of osteoblasts and osteocytes by glucocorticoids. Potential mechanisms of their deleterious effects on bone: J Clin Invest, 1998; 102(2); 274-82
44. Lodewyckx L, Cailotto F, Thysen S, Tight regulation of wingless-type signaling in the articular cartilage-subchondral bone biomechanical unit: transcriptomics in Frzb-knockout mice: Arthritis Res Ther, 2012; 14(1); R16
45. Yuan C, Cai J, Time-series expression profile analysis of fracture healing in young and old mice: Mol Med Rep, 2017; 16(4); 4529-36
46. Stéger V, Molnár A, Borsy A: Mol Genet Genomics, 2010; 284(4); 273-87
47. Barik A, Banerjee S, Dhara S, Chakravorty N, A reductionist approach to extract robust molecular markers from microarray data series – isolating markers to track osseointegration: J Biomed Inform, 2017; 68; 104-11
48. Lavrijsen IC, Leegwater PA, Martin AJ, Genome wide analysis indicates genes for basement membrane and cartilage matrix proteins as candidates for hip dysplasia in Labrador Retrievers: PLoS One, 2014; 9(1); e87735
49. Chou CH, Lee CH, Lu LS, Direct assessment of articular cartilage and underlying subchondral bone reveals a progressive gene expression change in human osteoarthritic knees: Osteoarthr Cartil, 2013; 21(3); 450-461
50. Saeed H, Iqtedar M: J Biomed Sci, 2015; 22; 11
51. Twine NA, Chen L, Pang CN: Bone, 2014; 67; 23-32
52. Christiansen HE, Schwarze U, Pyott SM, Homozygosity for a missense mutation in SERPINH1, which encodes the collagen chaperone protein HSP47, results in severe recessive osteogenesis imperfecta: Am J Hum Genet, 2010; 86(3); 389-98
53. Kelley BP, Malfait F, Bonafe L, Mutations in FKBP10 cause recessive osteogenesis imperfecta and Bruck syndrome: J Bone Miner Res, 2011; 26(3); 666-72
54. Duran I, Nevarez L, Sarukhanov A, HSP47 and FKBP65 cooperate in the synthesis of type I procollagen: Hum Mol Genet, 2015; 24(7); 1918-28
55. Venturi G, Monti E, Dalle Carbonare L, A novel splicing mutation in FKBP10 causing osteogenesis imperfecta with a possible mineralization defect: Bone, 2012; 50(1); 343-49
56. Shen Y, Jing D, Hao J, The effect of β-aminopropionitrile on skeletal micromorphology and osteogenesis: Calcif Tissue Int, 2018; 103(4); 411-21
Figures
Figure 1. Study flow diagram. DEGs – differentially expressed genes; WGCNA – weighted gene coexpression network analysis; PPI – protein–protein interaction; GSEA – gene set enrichment analysis; GO – gene ontology; KEGG – Kyoto Encyclopedia of Genes and Genomes.Figure 2. Volcano plot of DEGs. The red nodes represent upregulated genes selected upon the |log2FC| ≥1.0 and P<0.05 thresholds, while the blue nodes stand for downregulated genes selected upon the |log2FC| ≥1.0 and P<0.05 thresholds, and the gray nodes indicate the nonsignificant genes. DEGs – differentially expressed genes; FC – fold change.Figure 3. Sample clustering and soft-threshold power determination. (A) Hierarchical clustering dendrogram and the microarray sample trait. GIOP and non-GIOP samples can be classified. (B) Scale-free fit index analyses to determine different soft threshold powers (β). (C) Mean connectivity analyses to determine different soft threshold powers. GIOP – glucocorticoid-induced osteoporosis; WGCNA – weighted gene coexpression network analysis.Figure 4. Hub module selection. (A) Dendrogram of all DEGs clustered according to a dissimilarity measure (1-TOM). (B) Heatmap of the relationships of module with the disease traits. In the module, the greater mean gene relevance stands for the greater relationship of this module with the traits of interest. The horizontal and vertical axes stand for clinical factors and modules, respectively. The color gradient from red to green represents the shift from positive to negative correlation. The numbers in grids represent correlation coefficients. Values in parenthesis are the P-values for the association test. The red, brown, and turquoise gene modules are positively related to GIOP status, values in the figure indicate the correlation coefficient between modules and clinical traits. TOM – topological overlap matrix; DEGs – differentially expressed genes; Me – module; GIOP – glucocorticoid-induced osteoporosis.Figure 5. Identification of GIOP status hub genes within the hub module. (A) Correlations among the coexpression genes. On both vertical and horizontal axes, the diverse colors indicate diverse modules. In diverse modules, the yellow brightness at the center represents the connectivity degree. Differences in the relationships across diverse modules are not significant, illustrating that the above modules are highly independent from each other. (B) Dendrogram showing the eigengenes in the consensus module acquired based on WGCNA regarding consensus correlations. (C) Heat map showing the module adjacency. The blue color indicates low adjacency (inverse relationship), while the red color stands for close adjacency (positive relationship). (D) Scatter plot showing the module eigengenes in the turquoise module. GIOP – glucocorticoid-induced osteoporosis; WGCNA – weighted gene coexpression network analysis.Figure 6. Detection of hub genes. (A) A Venn diagram presenting hub genes under coexpression and those involved in the PPI network. (B) Ten hub genes (COL3A1, POSTN, COL6A3, COL14A1, SERPINH1, ASPN, OGN, THY1, NID2, and TNMD) overlapped between the PPI and the coexpression networks. In the heat map, intensity and color of hub genes are shown at right, which represent the gene rank 1 to 10. PPI, protein-protein interaction; COL3A1 – collagen type III alpha 1 chain; POSTN – periostin; COL6A3 – collagen type VI alpha 3 chain; COL14A1 – collagen type XIV alpha 1 chain; SERPINH1 – serpin family H member 1; ASPN – asporin; OGN – osteoglycin; THY1 – Thy-1 cell surface antigen; NID2 – nidogen 2; TNMD – tenomodulin.Figure 7. Hub gene validation based on training set (GSE30159). The mRNA level of 10 hub genes was validated in GIOP samples compared with normal samples. All hub genes except POSTN revealed statistically significant differences in GIOP. (A) COL3A1, (B) POSTN, (C) COL6A3, (D) COL14A1, (E) SERPINH1, (F) ASPN, (G) OGN, (H) THY1, (I) NID2, (J) TNMD. * P<0.05, ** P<0.01, *** P<0.001, NS – not significant. GIOP – glucocorticoid-induced osteoporosis; NON-GIOP – control group; COL3A1 – collagen type III alpha 1 chain; POSTN – periostin; COL6A3 – collagen type VI alpha 3 chain; COL14A1 – collagen type XIV alpha 1 chain; SERPINH1 – serpin family H member 1; ASPN – asporin; OGN – osteoglycin; THY1 – Thy-1 cell surface antigen; NID2 – nidogen 2; TNMD – tenomodulin.Figure 8. Hub gene validation based on test set (GSE129228). The mRNA level of 10 hub genes was validated in GIOP model samples compared with normal samples. SERPINH1 and POSTN were significantly upregulated in GIOP model groups in comparison to non-GIOP groups. (A) SERPINH1, (B) COL3A1, (C) POSTN, (D) COL6A3, (E) ASPN, (F) OGN, (G) THY1, (H) NID2. * P<0.05, ** P<0.01; NS – not significant; CG – control group; DEX – dexamethasone; GIOP – glucocorticoid-induced osteoporosis; SERPINH1 – serpin family H member 1; POSTN – periostin; COL3A1 – collagen type III alpha 1 chain; COL6A3 – collagen type VI alpha 3 chain; ASPN – asporin; OGN – osteoglycin; THY1 – Thy-1 cell surface antigen; NID2 – nidogen 2.Figure 9. Functional enrichment and pathway analysis of DEGs by Metascape analysis. (A) Top 20 clusters functional enrichment of DEGs. (B) Interconnections between these top 20 clusters functional enrichment terms illustrated with network analysis. Nodes of the same color are representative of same cluster. (C) KEGG pathways of DEGs. KEGG, Kyoto Encyclopedia of Genes and Genomes; DEGs, differentially expressed genes.Figure 10. GSEA of GIOP status in the GEO dataset. Two functional gene sets enriched in GIOP status with high expression of hub genes are shown. In the expression heatmap figures, the red color stands for upregulated genes, while the blue color indicates the downregulated genes. (A) ECM receptor interaction (B) Focal adhesion. ECM – extracellular matrix; GSEA – Gene Set Enrichment Analysis; GIOP – glucocorticoid-induced osteoporosis; GEO – Gene Expression Omnibus. Tables
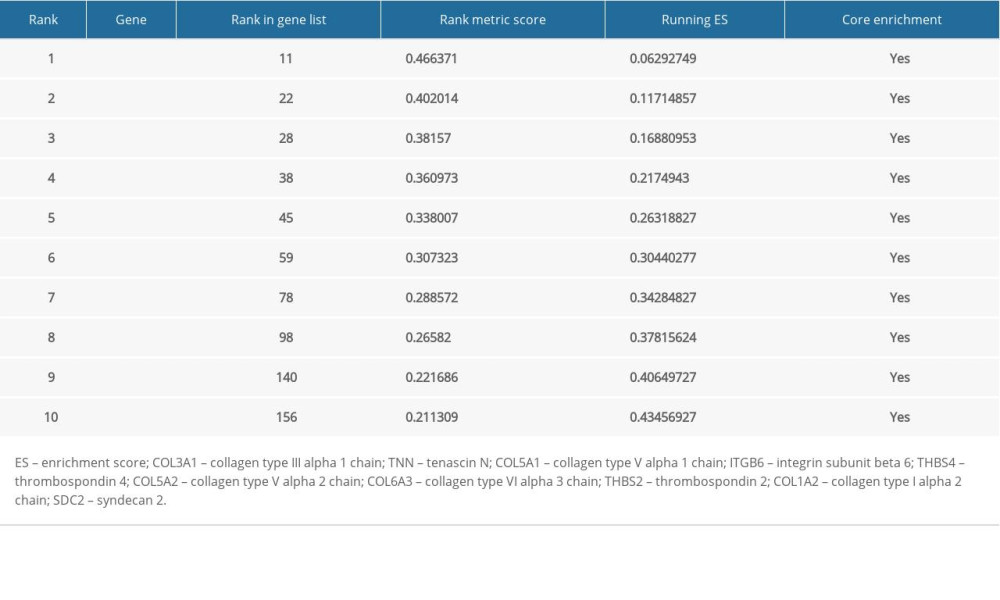 Table 1. Top 10 genes related to extracellular matrix (ECM) receptor interaction in gene set enrichment analysis (GSEA) details.
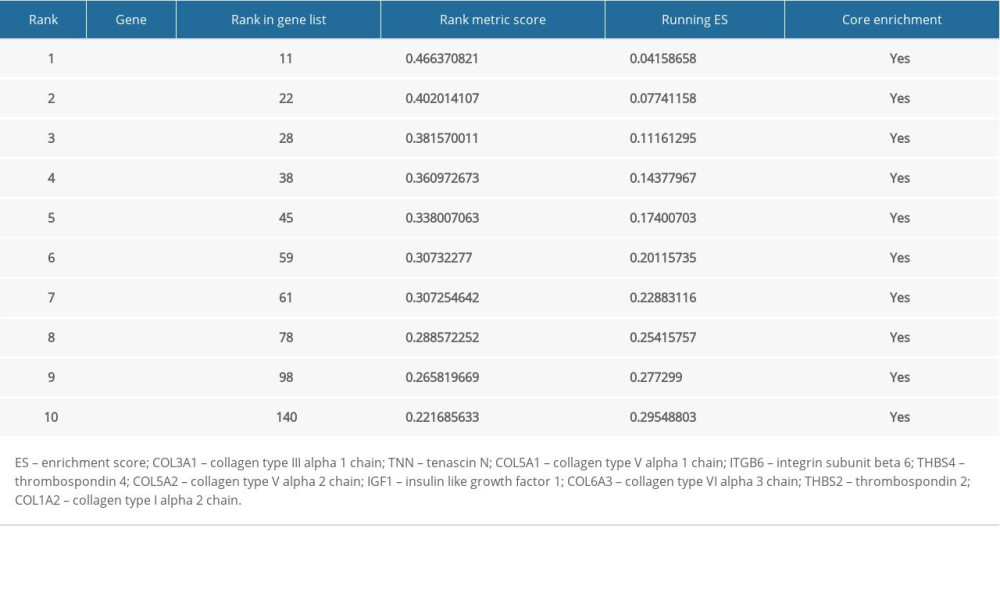 Table 2. Top 10 core genes related to focal adhesion in gene set enrichment analysis (GSEA) details.Table 1. Top 10 genes related to extracellular matrix (ECM) receptor interaction in gene set enrichment analysis (GSEA) details.Table 2. Top 10 core genes related to focal adhesion in gene set enrichment analysis (GSEA) details.
 In Press
Clinical Research
Effects of Single-Bout Endurance Exercise Intensity on Peripheral Neurotrophic Factors in Patients With Isc...Med Sci Monit In Press; DOI: 10.12659/MSM.952089
Review article
Anisodus tanguticus in Cancer Research: A Review of Traditional Use, Phytochemistry, Extraction Methods, an...Med Sci Monit In Press; DOI: 10.12659/MSM.952999
Clinical Research
Nasal Mucociliary Clearance and Its Relationship With Disease Severity in Patients With Multiple SclerosisMed Sci Monit In Press; DOI: 10.12659/MSM.952850
Clinical Research
Modified Thoracoabdominal Nerves Block Through the Perichondrial Approach vs Subcostal Transversus Abdomini...Med Sci Monit In Press; DOI: 10.12659/MSM.953976
Most Viewed Current Articles
17 Jan 2024 : Review article 14,176,570
Vaccination Guidelines for Pregnant Women: Addressing COVID-19 and the Omicron VariantDOI :10.12659/MSM.942799
Med Sci Monit 2024; 30:e942799
13 Nov 2021 : Clinical Research 3,762,188
Acceptance of COVID-19 Vaccination and Its Associated Factors Among Cancer Patients Attending the Oncology ...DOI :10.12659/MSM.932788
Med Sci Monit 2021; 27:e932788
14 Dec 2022 : Clinical Research 2,466,310
Prevalence and Variability of Allergen-Specific Immunoglobulin E in Patients with Elevated Tryptase LevelsDOI :10.12659/MSM.937990
Med Sci Monit 2022; 28:e937990
16 May 2023 : Clinical Research 708,927
Electrophysiological Testing for an Auditory Processing Disorder and Reading Performance in 54 School Stude...DOI :10.12659/MSM.940387
Med Sci Monit 2023; 29:e940387