01 October 2020 : Database Analysis
COL3A1, COL6A3, and SERPINH1 Are Related to Glucocorticoid-Induced Osteoporosis Occurrence According to Integrated Bioinformatics Analysis
Liuxun Li1ABCDEF, Meiling Yang2BCDEF, Anmin Jin1ABCDEFG*DOI: 10.12659/MSM.925474
Med Sci Monit 2020; 26:e925474


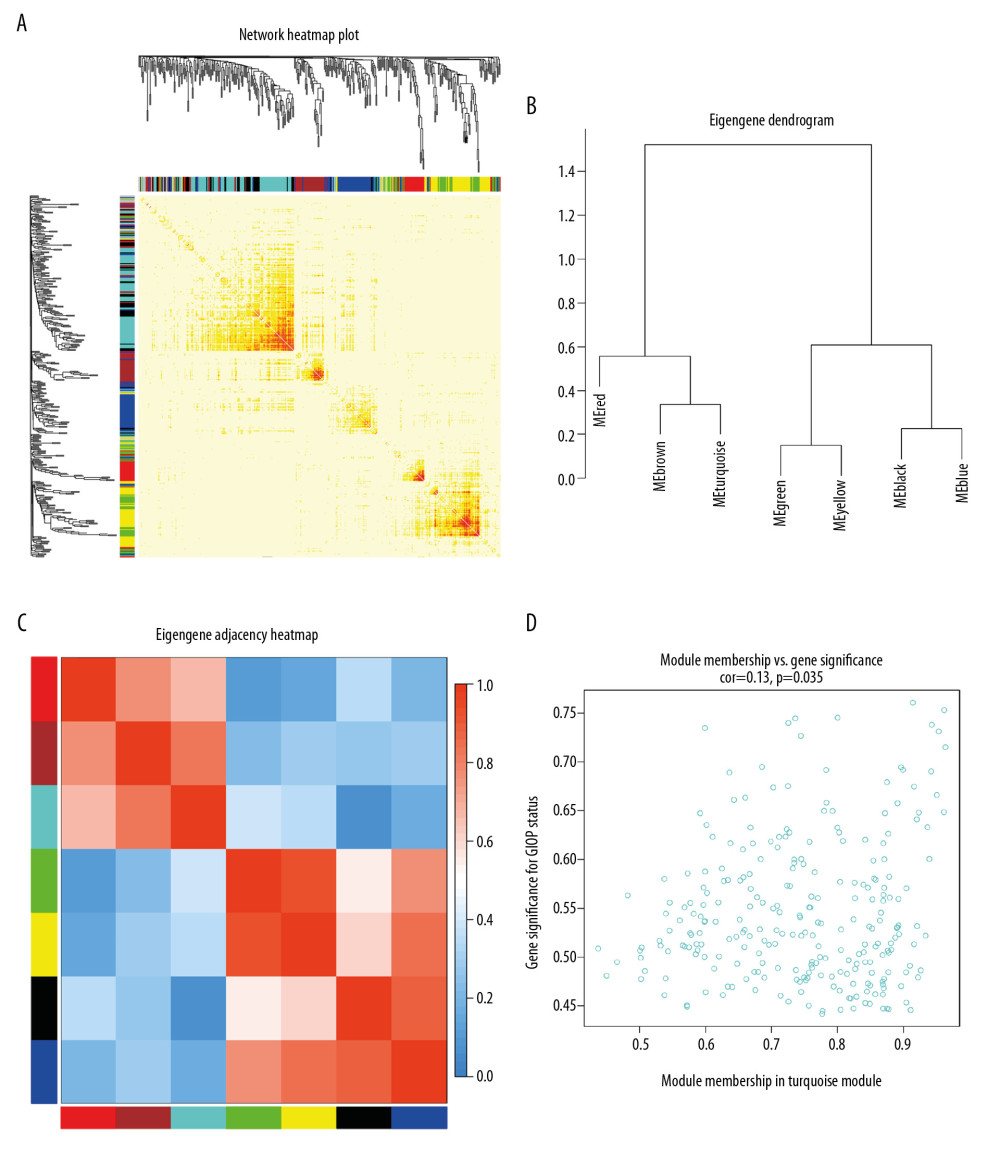
Figure 5 Identification of GIOP status hub genes within the hub module. (A) Correlations among the coexpression genes. On both vertical and horizontal axes, the diverse colors indicate diverse modules. In diverse modules, the yellow brightness at the center represents the connectivity degree. Differences in the relationships across diverse modules are not significant, illustrating that the above modules are highly independent from each other. (B) Dendrogram showing the eigengenes in the consensus module acquired based on WGCNA regarding consensus correlations. (C) Heat map showing the module adjacency. The blue color indicates low adjacency (inverse relationship), while the red color stands for close adjacency (positive relationship). (D) Scatter plot showing the module eigengenes in the turquoise module. GIOP – glucocorticoid-induced osteoporosis; WGCNA – weighted gene coexpression network analysis.