08 December 2020 : Database Analysis
Molecular Mechanisms Underlying Intestinal Ischemia/Reperfusion Injury: Bioinformatics Analysis and In Vivo Validation
Fengshou Chen1ABCDEF, Dan Wang1BCDE, Xiaoqian Li1ACD*, He Wang1ACDDOI: 10.12659/MSM.927476
Med Sci Monit 2020; 26:e927476


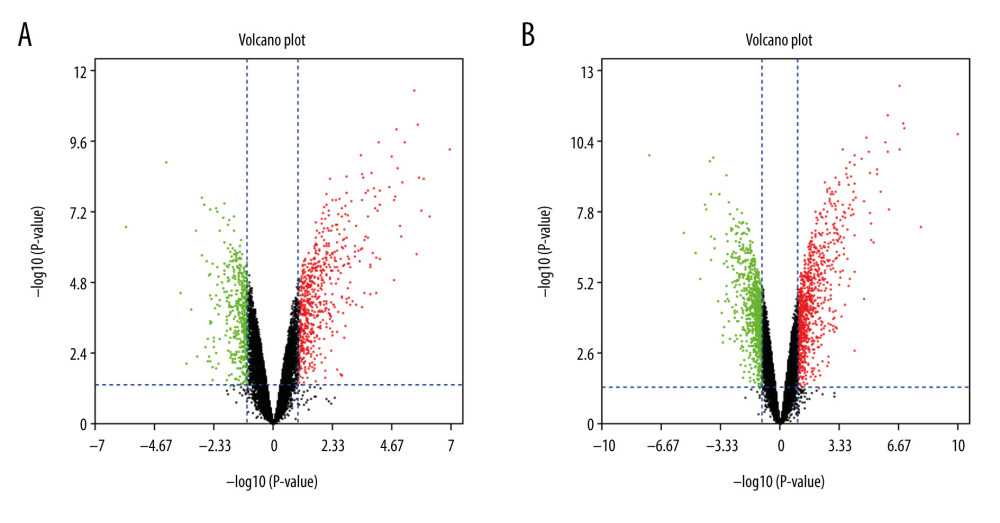
Figure 2 The volcano plot of differentially expressed genes (DEGs). (A) The volcano plot of 1171 DEGs at 3 h post intestinal I/R. (B) The volcano plot of 1885 DEGs at 6 h post intestinal I/R injury. The red dots represent upregulated DEGs and the green dots indicate downregulated DEGs.