08 December 2020: Database Analysis
Molecular Mechanisms Underlying Intestinal Ischemia/Reperfusion Injury: Bioinformatics Analysis and Validation
Fengshou Chen1ABCDEF, Dan Wang1BCDE, Xiaoqian Li1ACD*, He Wang1ACDDOI: 10.12659/MSM.927476
Med Sci Monit 2020; 26:e927476
Abstract
BACKGROUND: Intestinal ischemia/reperfusion (I/R) injury is a serious clinical complication. This study aimed to explore the hub genes and pathways of intestinal I/R injury.
MATERIAL AND METHODS: GSE96733 from the GEO website was extracted to analyze the differentially expressed genes (DEGs) of intestinal I/R injured and sham-operated mice at 3 h and 6 h after surgery. The DAVID and STRING databases were used to construct functional enrichment analyses of DEGs and the protein–protein interaction (PPI) network. In Cytoscape software, cytoHubba was used to identify hub genes, and MCODE was used for module analysis. Testing by qRT-PCR detected the expression of hub genes in intestinal I/R injury. Western blot analysis detected the key proteins involved with the important pathways of intestinal I/R injury.
RESULTS: IL-6, IL-10, CXCL1, CXCL2, and IL-1β were identified as critical upregulated genes, while IRF7, IFIT3, IFIT1, Herc6, and Oasl2 were identified as hub genes among the downregulated genes. The qRT-PCR testing showed the expression of critical upregulated genes was significantly increased in intestinal I/R injury (P<0.05), while the expression of hub downregulated genes was notably reduced (P<0.05). The proteins of CXCL1 and CXCR2 were upregulated following intestinal I/R injury (P<0.05) and the CXCL1/CXCR2 axis was involved with intestinal I/R injury.
CONCLUSIONS: The results of the present study identified IL-6, IL-10, CXCL1, CXCL2, IL-1β, IRF7, IFIT3, IFIT1, Herc6, and Oasl2 as hub genes in intestinal I/R injury and identified the involvement of the CXCL1/CXCR2 axis in intestinal I/R injury.
Keywords: Intestinal Diseases, Chemokine CXCL1, Cluster Analysis, Computational Biology, Gene Expression Profiling, Gene Expression Regulation, gene ontology, Gene Regulatory Networks, Intestines, Molecular Sequence Annotation, Protein Interaction Maps, RNA, Messenger, Receptors, Interleukin-8B, Reproducibility of Results
Background
Intestinal ischemia/reperfusion (I/R) injury is a serious complication associated with increased mortality and morbidity in clinical settings including abdominal and thoracic vascular surgery, small intestine transplantation, trauma hemorrhagic shock, cardiopulmonary bypass, and strangulated ileus [1]. In I/R injury, basic tissue impairment is induced during ischemic irritation. Subsequent reperfusion creates added impairment via assorted mechanisms, which may be greater in degree than the impairment from the initial insult [2]. I/R injury of the intestine involves early systemic and local inflammatory responses, interruption of the absorptive function of the intestinal mucosa, bacterial translocation, and multiple organ failure [3]. Several lines of evidence support that the pathophysiology of intestinal I/R injury is sophisticated and includes various signaling pathways [4,5].
Because of the various factors involved in intestinal I/R injury [6,7], its mechanism has not been completely elucidated. Recently, microarray technologies and bioinformatic analyses have developed as dynamic tools for identifying the potential molecular mechanisms of various diseases [8,9]. To date, a systematic and thorough bioinformatics analysis of intestinal I/R injury is still lacking.
In the present study, we used microarray data under the gene expression omnibus (GEO) accession No. GSE96733 deposited by Karhausen et al. [10] to disclose molecular mechanisms that may be associated with intestinal I/R injury.
Material and Methods
MICROARRAY DATA:
The raw data of GSE96733 [species: Mus musculus; Platforms: GPL23038 (Clariom_S_Mouse) Affymetrix Clariom S Assay, Mouse (Includes Pico Assay)] was collected from the GEO website (http://www.ncbi.nlm.nih.gov/geo/). Four sham-operated samples and 8 intestinal I/R samples at 3 h (n=4) and 6 h (n=4) post I/R injury were included in GSE96733. The intestinal I/R injury was performed as previously described [11].
DATA PREPROCESSING:
Using the robust multiarray average algorithm in oligo [12], background correction and data normalization was performed on the raw data. Following the removal of the internal standard probe, a box plot was drawn for the expression values of every chip before and after normalization.
DIFFERENTIALLY EXPRESSED GENE ANALYSIS:
Using the linear models for microarray analysis (limma, http://www.bioconductor.org/packages/release/bioc/html/limma.html) package in R [13,14], the differentially expressed genes (DEGs) between the sham-operated samples and intestinal I/R injury samples were analyzed. DEGs were those genes with a |log2FC| ≥1 and P<0.05. To analyze the diversification of DEG expression at the 2 timepoints (3 h and 6 h), the heatmaps of the DEGs were drawn using the heatmap function.
ENRICHMENT ANALYSIS FOR THE DEGS:
The Gene Ontology (GO) functional and Kyoto Encyclopedia of Genes and Genomes (KEGG) pathway analyses were performed on the database for annotation, visualization and integrated discovery (DAVID).
PROTEIN–PROTEIN INTERACTION NETWORK GENERATION AND MODULE ANALYSIS:
A protein–protein interaction (PPI) network of intestinal I/R injury was conducted by the search tool for the retrieval of interacting proteins (STRING) database (http://stringdb.org/) [15]. An interaction score with median confidence of 0.7 was the standard cutoff criteria. Subsequently, the network was visualized using the Cytoscape software platform (http://www.cytoscape.org/) based on functional analysis information. In Cytoscape, cytoHubba was used to identify hub genes, and MCODE was used for module analysis. A module was defined as an MCODE score >4 and number of nodes >5.
EXPERIMENTAL ANIMALS AND INTESTINAL I/R INJURY MODEL CONSTRUCTION:
C57BL/6 mice were obtained and then maintained for 1 week prior to the surgical procedures in this study. The animal experiments were approved by the Ethics Committee of China Medical University. Aneurysm clips on the peripheral branches of the superior mesenteric artery and across the intestine itself to block the flow through collaterals were used to create the animal model as previously reported [10]. Pentobarbital sodium (40 mg/kg bodyweight) was used to anesthetize the mice before midline laparotomy was performed. Cross-clamping through the superior mesenteric artery was maintained for 45 min to create the I/R injury mouse model. The same procedure without any block was performed on sham-operated mice.
QUANTITATIVE REVERSE TRANSCRIPTION-POLYMERASE CHAIN REACTION:
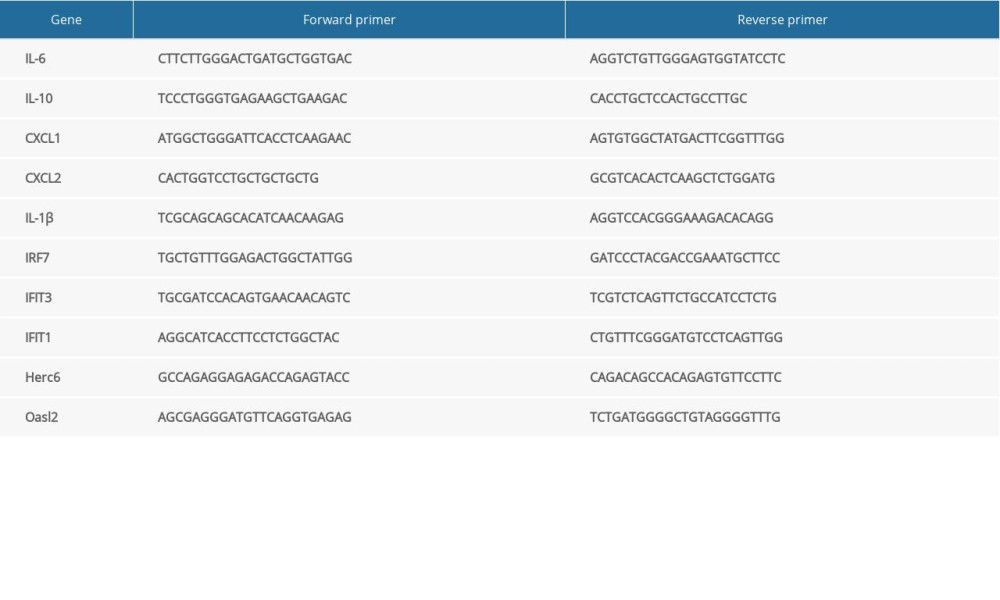
Trizol reagent (Takara, Otsu, Japan) was used to extract total RNA from frozen intestinal tissue and a Prime-Script RT reagent kit with gDNA Eraser (Takara) was used to reverse-transcribe RNA into cDNA [16]. The mRNA expression levels of hub genes were detected using the SYBR Premix Ex TaqII kit (Takara), with GAPDH as an internal control on the Applied Biosystems 7500 Real Time PCR system (Takara). Table 1 shows the primer sequences used. We applied the 2−ΔΔCt method to calculate data.
WESTERN BLOT ANALYSIS:
The protein expression levels of CXCL1 and CXCR2 in intestinal tissue were detected by western blot analysis as previously described [10,16]. Total proteins were extracted using protein lysis buffer. Rabbit polyclonal anti-CXCL1 (Abcam), rabbit polyclonal anti-CXCR2 (Abcam), and horseradish peroxidase-conjugated secondary antibodies (Beyotime, China) were used.
STATISTICAL ANALYSIS:
SPSS software version 15.0 (IBM, USA) was used for statistical analysis. Results were expressed as mean±standard deviation. The
Results
DATA PREPROCESSING AND DEG SCREENING:
Box plots display the sham-operated and intestinal I/R injury data at the 2 timepoints (3 h and 6 h) following data normalization in Figure 1. Volcano plots for the 2 timepoints are displayed in Figure 2. The results indicated that the expression values of the samples were similar within the groups following normalization. Following data preprocessing, the DEGs between the sham-operated and intestinal I/R injury groups at the 2 timepoints (3 h and 6 h) were analyzed.
A total of 1171 DEGs (643 upregulated and 528 downregulated) were attained with a |log2FC| ≥1 and P<0.05 in group A (sham at 3 h) (Supplementary Table 1). The volcano plot is presented in Figure 2A. A cluster heatmap is displayed in Figure 3A, showing that Egr1 and slc34a2 separated the samples into 2 groups. The DEG expression levels of the intestinal I/R injury samples at 3 h were significantly different from those of the sham-operated samples at 3 h.
A total of 1886 DEGs (953 upregulated and 933 downregulated) were attained with a |log2FC| ≥1 and P<0.05 in group B (sham at 6 h) (Supplementary Table 2). The volcano plot is presented in Figure 2B. It was extracted from the results of clustering analysis that ll1r2 and Hoxb6 divided the intestinal I/R injury (6 h) samples from the sham-operated samples (Figure 3B).
GO ENRICHMENT AND KEGG PATHWAY ANALYSES:
The top 10 enriched GO terms (biological process) of upregulated and downregulated DEGs at both timepoints (3 h and 6 h) are shown in Figure 4 (Supplementary Tables 3–6). Upregulated DEGs were mostly enriched in ‘inflammatory response’ at both 3 h and 6 h after intestinal I/R injury. In addition, upregulated DEGs at 3 h and 6 h after I/R injury were also enriched in ‘response to lipopolysaccharide’, ‘chemotaxis’, ‘immune response’, ‘positive regulation of cell migration’, and ‘neutrophil chemotaxis’. Moreover, upregulated DEGs at 6 h were enriched in ‘immune system process’ and ‘cytokine-mediated signaling pathway’. By comparison, downregulated DEGs were primarily enriched in ‘regulation of transcription, DNA-templated’ at 3 h and ‘cholesterol biosynthetic process’ at 6 h. We also noted that downregulated DEGs at 3 h were enriched in ‘lipoprotein metabolic process’ and downregulated DEGs at 6 h were enriched in ‘cholesterol metabolic process’, ‘steroid biosynthetic process’, ‘lipid transport’, ‘sterol biosynthetic process’, ‘steroid biosynthetic process’, ‘lipid metabolic process’, and ‘steroid metabolic process’. Upregulated DEGs were involved in inflammatory, immune, neutrophil chemotaxis, and chemotaxis function, while downregulated DEGs were predominantly associated with lipid homeostasis.
The top 10 enrichment scores of significantly enriched KEGG pathways of upregulated and downregulated DEGs at 3 h and 6 h are presented in Figure 5 (Supplementary Tables 7–10). At 3 h and 6 h after intestinal I/R injury, upregulated DEGs enriched in KEGG pathways were involved mostly in inflammation- and immune-associated pathways. ‘Cytokine-cytokine receptor interaction’, ‘JAK-STAT signaling pathway’, and ‘TNF signaling pathway’, were enriched at 3 h and 6 h. In addition, upregulated DEGs at 3 h were enriched in the ‘MAPK signaling pathway’, and upregulated DEGs at 6 h were enriched in pathways including the ‘NF-kappa B signaling pathway’ and ‘toll-like receptor signaling pathway’. Remarkably, downregulated DEGs at 3 h were mostly enriched in the ‘B-cell receptor signaling pathway’. Downregulated DEGs at 6 h were enriched in pathways including ‘metabolic pathways’, ‘peroxisome’, ‘steroid biosynthesis’, ‘PI3K-Akt signaling pathway’, and ‘phosphatidylinositol signaling system’.
PPI NETWORK CONSTRUCTION AND CYTOHUBBA ANALYSIS:
Venn diagram analysis of DEGs at 3 h and 6 h after intestinal I/R injury is presented in Figure 6. A total of 454 overlapping upregulated and 276 common downregulated DEGs at the 2 timepoints were acquired (Supplementary Tables 11, 12). Conclusively, 448 protein nodes and 991 protein edges were constructed in the upregulated DEG network and 269 protein nodes and 85 protein edges were constructed in the downregulated DEG network (Figures 7, 8). Using the degree method in cytoHubba, the 5 genes with the highest degrees were summarized as hub genes for upregulated and downregulated DEGs. Upregulated DEGs were annotated as interleukin-6 (IL-6), IL-10, chemokine (C-X-C motif) ligand 1 (CXCL1), CXCL2, and IL-1β. Downregulated DEGs were annotated as interferon regulatory factor 7 (IRF7), IFN-induced proteins with tetratricopeptide repeats 3 (IFIT3), IFIT1, HECT domain and RCC1-like domain containing protein 6 (Herc6), and oligoadenylate synthetase-like 2 (Oasl2).
qRT-PCR was applied to detect the expression of the hub genes in the intestinal I/R injury mice and the sham-operated mice. The expression of IL-6, IL-10, CXCL1, CXCL2, and IL-1β were significantly increased in the I/R injury group (P<0.05), while the expression of IRF7, IFIT3, IFIT1, Herc6, and Oasl2 was markedly reduced in this group (P<0.05). The results confirmed the bioinformatics analysis (Figure 9A, 9B).
MODULE ANALYSIS:
In total, 4 modules obtained from the upregulated DEG PPI network and 1 module obtained from the upregulated DEG PPI network were statistically significant. The visualized genes of the modules in the upregulated and downregulated DEG PPI networks are shown in Figure 10A–10E.
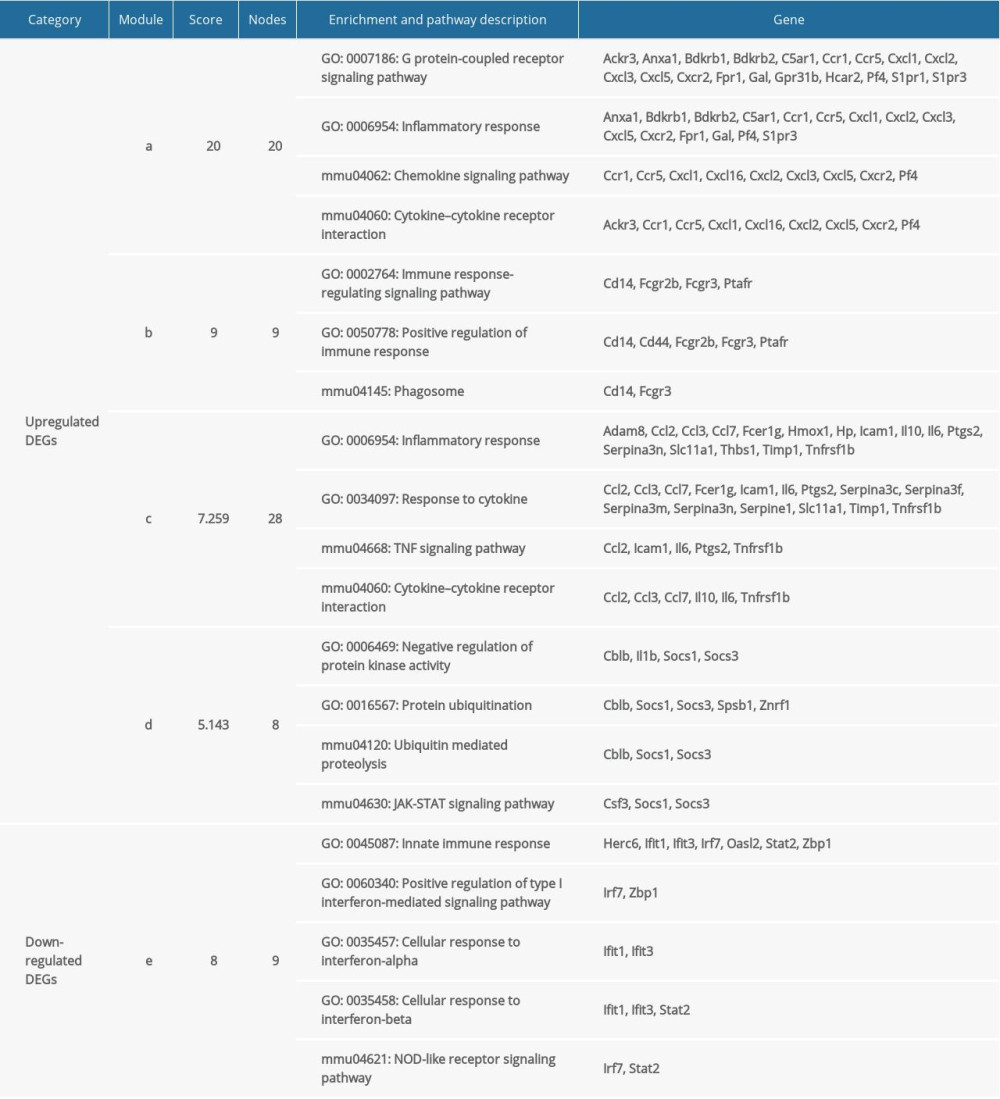
The GO and KEGG pathways were analyzed (Table 2). Enrichment analyses for the 4 modules obtained from the upregulated DEG PPI network mainly included ‘cytokine-cytokine receptor interaction’, ‘TNF signaling pathway’, and ‘JAK-STAT signaling pathway’, which agreed with the KEGG pathway analyses of the upregulated DEGs. GO enrichment analyses revealed that module nodes were mainly enriched in ‘inflammatory response’. Enrichment analyses for 1 module obtained from the downregulated DEG PPI network included innate immune response, interferon related functions, and NOD-like receptor signaling pathway.
CXCL1 AND CXCR2 PROTEIN EXPRESSIONS IN INTESTINAL I/R INJURY:
We found the ‘cytokine-cytokine receptor interaction’ pathway was the top enriched pathway of upregulated DEGs at 3 h and 6 h. Bioinformatics analysis results showed that the ‘cytokine-cytokine receptor interaction’ pathway had an important role during the pathophysiological process of intestinal I/R injury and represented a potential therapeutic target. Also, we found that 2 genes, CXCL1 and CXCR2, which were involved in the ‘cytokine-cytokine receptor interaction’ pathway (Figure 11), were upregulated DEGs at 3 h and 6 h. The protein expression of CXCL1 and CXCR2 was upregulated at 3 h and 6 h following intestinal I/R injury (Figure 12). The results were in accordance with the bioinformatics analysis and suggested that the CXCL1/CXCR2 axis might play important roles in intestinal I/R injury.
Discussion
In the present study, 4 sham-operated samples and 8 intestinal I/R injury samples at 3 h (n=4) and 6 h (n=4) after I/R injury were obtained from GSE96733. DEGs were determined first, and then KEGG pathway and GO enrichment analyses of the DEGs were conducted. Additionally, PPI network and module analyses were performed to analyze hub genes and key pathways underlying intestinal I/R injury. The results of the present study may be beneficial for understanding the mechanisms of intestinal I/R injury.
In our study, GO enrichment analysis showed that upregulated DEGs were mainly involved in inflammatory immune function. KEGG pathway enrichment of upregulated DEGs were also primarily involved in inflammation- and immune-associated pathways, which included the ‘cytokine-cytokine receptor interaction’, ‘JAK-STAT signaling pathway’, and ‘TNF signaling pathway’. GO enrichment analysis regarding downregulated DEGs was predominantly associated with lipid homeostasis after intestinal I/R injury. Also, the KEGG pathway enrichment of upregulated DEGs at 6 h after intestinal I/R injury were enriched in the ‘steroid biosynthesis’ process.
Studies have revealed that inflammation and immune reaction play important roles in the mechanism of intestinal I/R injury [17,18]. For example, the inhibition of the TNF-α-related pathway might be the protective mechanism of curcumin for intestinal I/R injury [19]. The JAK-STAT signaling pathway could regulate the immune arms of intestinal mucosal immunity and epithelial repair and regeneration [20]. Several studies have explored the involvement of lipids in intestinal I/R injury [18,21–23]. Oxidized low-density lipoproteins (LDLs) accumulate in the lung, liver, and terminal ileum tissues after intestinal I/R injury, while high-density lipoproteins (HDLs) reduce the inflammation caused by intestinal I/R injury [24,25]. Free fatty acids increased after intestinal ischemia or ischemia followed by 5 min of reperfusion compared to control, which implicated the involvement of free fatty acids in intestinal I/R injury [26]. Together, these findings show that DEGs have regulatory effects in these biological processes and pathways in intestinal I/R injury, and are confirmed by functional enrichment analysis.
In the present study, PPI networks of overlapping upregulated and common downregulated DEGs at 2 timepoints after intestinal I/R injury were constructed in Cytoscape, and hub genes were identified for intestinal I/R injury using cytoHubba in Cytoscape software. For overlapping upregulated DEGs, 5 hub genes were identified: IL-6, IL-10, CXCL1, CXCL2, and IL-1β. For common downregulated DEGs, 5 hub genes were identified: IRF7, IFIT3, IFIT1, Herc6, and Oasl2. Several selected hub genes might be important regulated genes associated with intestinal I/R injury and could be involved with inflammation-, immune- and lipid homeostasis-associated pathways [27–31]. In the present study, we found that the mRNA expression levels of IL-6, IL-10, CXCL1, CXCL2, and IL-1β were significantly increased in intestinal I/R injury, while the mRNA expression levels of IRF7, IFIT3, IFIT1, Herc6, and Oasl2 were significantly decreased. The qRT-PCR results confirmed the bioinformatics analysis. Further studies are needed to explore the involvement of selected hub upregulated genes in the development of intestinal I/R injury.
Recently, CXCL1 has been widely studied in organ ischemia and injury. Patients with stroke had markedly higher CXCL1 levels in their cerebrospinal fluid than did healthy patients [32]. TLR2 agonist Pam3CSK4 reduced CXCL1-dependent leukocyte recruitment in myocardial I/R injury [33]. Also, miR-429 demonstrated protective effects against brain microvascular endothelial cell OGD/R-induced injury via regulating the nuclear factor kinase B pathway and CXCL1 [34]. It was found that an increase in serum concentrations of CXCL1 is involved in intestinal I/R injury [35]. A large increase of CXCL1 in small intestine tissues after I/R was also observed [36]. The results of these studies are consistent with our qRT-PCR results.
CXCL1 and its receptor CXCR2 have been proven to play important roles in various diseases including cancer, acute kidney injury, neuropathic pain, and perinatal brain injury [37–40]. Inhibition of the CXCL1/CXCR2 axis ameliorates cisplatin-induced acute kidney injury by mediating the inflammatory response [38]. The CXCL1/CXCR2 axis is correlated with neutrophil infiltration in hepatocellular carcinoma [37]. CXCL1 can also regulate NLRP3 inflammasome activation via CXCR2 [41]. In the present study, the KEGG and module analyses showed that the ‘cytokine-cytokine receptor interaction’ pathway had an important role in intestinal I/R injury. In addition, 2 genes, CXCL1 and its receptor CXCR2, were involved in the ‘cytokine-cytokine receptor interaction’ pathway and both upregulated DEGs at 3 h and 6 h. Western blotting results also revealed that CXCL1 and CXCR2 proteins were upregulated following intestinal I/R injury. Bioinformatics analysis and western blotting results illustrated that CXCL1/CXCR2 signaling was involved with intestinal I/R injury.
Conclusions
The present study revealed that inflammation-, immune-, and lipid-related pathways and functions served important roles in the progression of intestinal I/R injury. Furthermore, IL-6, IL-10, CXCL1, CXCL2, IL-1β, IRF7, IFIT3, IFIT1, Herc6, and Oasl2 were critical genes that mediated intestinal I/R injury. Also, the CXCL1/CXCR2 axis was involved with intestinal I/R injury. This study identified molecular mechanisms and hub genes that may be associated with intestine I/R injury.
Figures
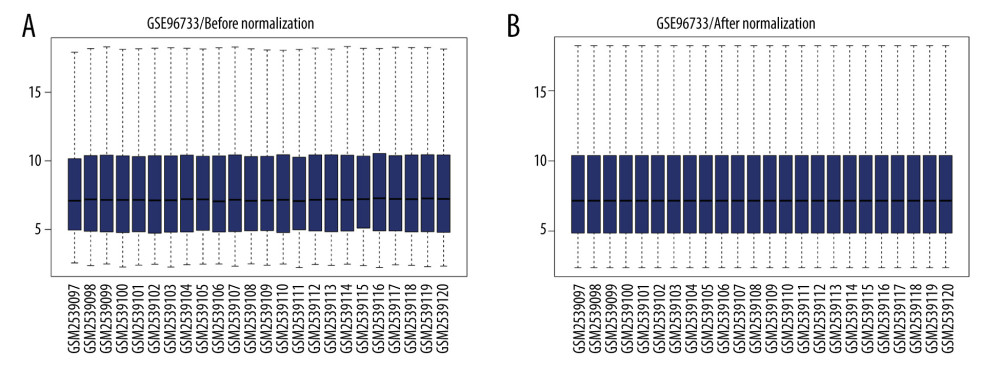 Figure 1. Data normalization. Box plots of gene expression in the post intestinal ischemia/reperfusion injury and sham groups at 3 h or 6 h (A) before and (B) after normalization.
 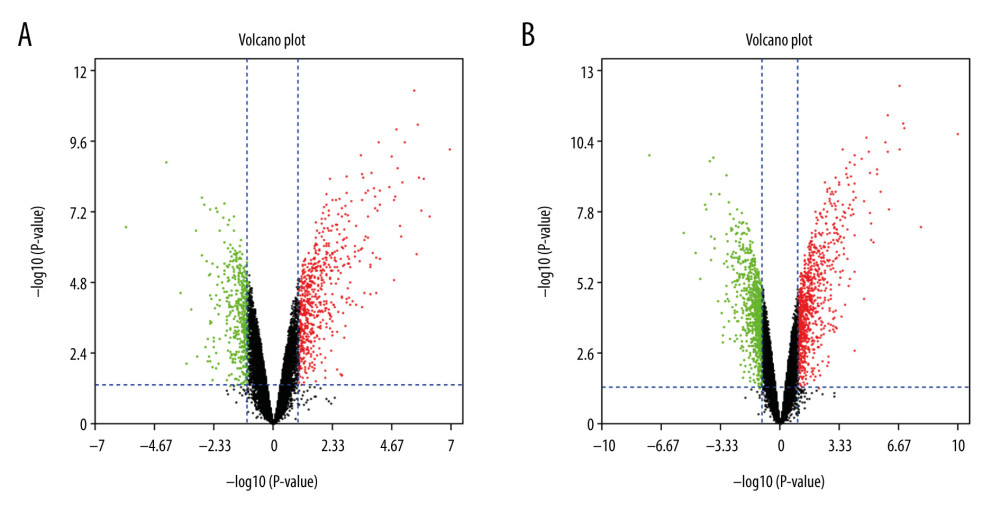 Figure 2. The volcano plot of differentially expressed genes (DEGs). (A) The volcano plot of 1171 DEGs at 3 h post intestinal I/R. (B) The volcano plot of 1885 DEGs at 6 h post intestinal I/R injury. The red dots represent upregulated DEGs and the green dots indicate downregulated DEGs.
 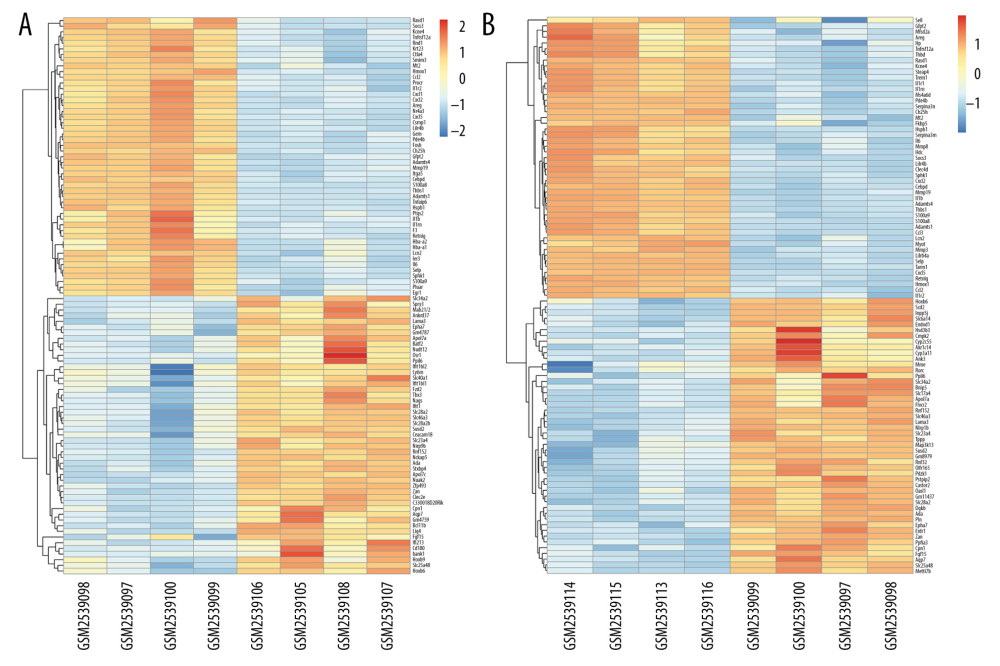 Figure 3. Hierarchical clustering analysis included DEGs between the sham control and intestinal ischemia/reperfusion (I/R) injury groups. Relative levels of gene expression are represented using a color scale: blue represents downregulated gene levels and red represents upregulated gene levels. (A) 3 h post intestinal I/R injury vs. sham. GSM2539097/2539098/2539099/2539100 refers to the intestine samples from the sham control group, and GSM2539106/2539105/2539108/2539107 refers to the intestine samples from the intestinal I/R group. (B) 6 h post intestinal I/R vs. sham. GSM2539097/2539098/2539099/2539100 refers to the intestine samples from the sham control group, and GSM2539116/2539113/2539115/2539114 refers to the intestine samples from the intestinal I/R group.
 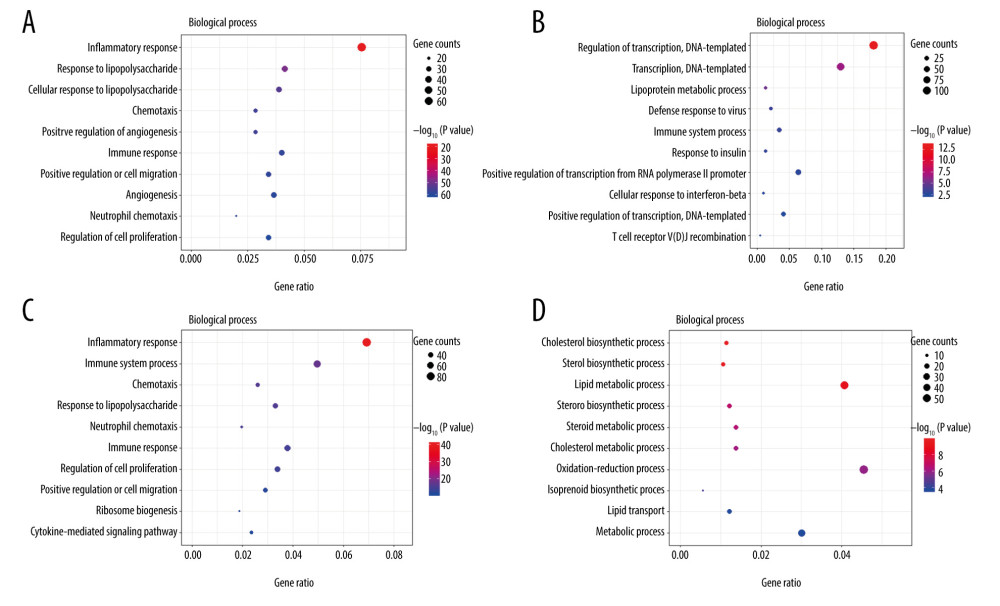 Figure 4. The Gene Ontology (GO) annotations for biological process of the 10 most significant GO enrichment terms. The vertical axis represents enriched GO categories and the horizontal axis represents the ratio of enriched genes in the selected category to all genes analyzed in the GO enrichment analyses. (A) Dot plot shows the upregulated differentially expressed genes (DEGs) at 3 h post intestinal ischemia/reperfusion (I/R) injury; (B) Dot plot shows the downregulated DEGs at 3h post intestinal I/R; (C) Dot plot shows the upregulated DEGs at 6 h post intestinal I/R; (D) Dot plot shows the downregulated DEGs at 6 h post intestinal I/R.
 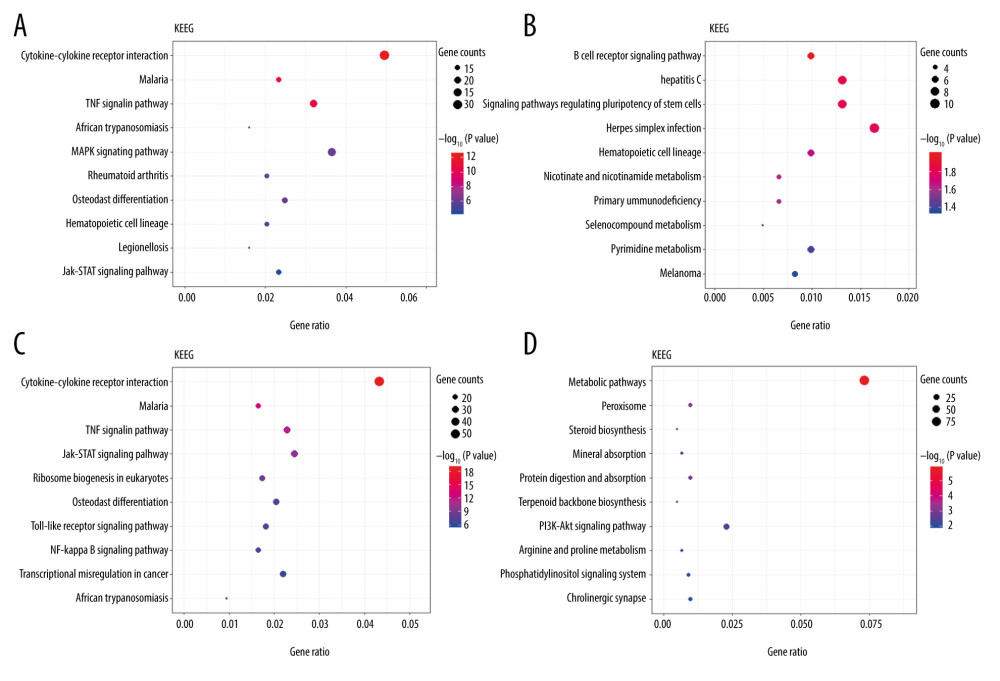 Figure 5. The Kyoto Encyclopedia of Genes and Genomes (KEGG) pathway analysis of the 10 most significant KEGG enrichment terms. The vertical axis represents enriched KEGG categories, whereas the horizontal axis represents the ratio of enriched genes in the selected category to all genes analyzed in the KEGG enrichment analyses. (A) Dot plot shows the upregulated differentially expressed genes (DEGs) at 3 h post intestinal ischemia/reperfusion (I/R) injury; (B) Dot plot shows the downregulated DEGs at 3 h post intestinal I/R; (C) Dot plot shows the upregulated DEGs at 6 h post intestinal I/R; (D) Dot plot shows the downregulated DEGs at 6 h post intestinal I/R.
  Figure 6. Venn diagrams of differentially expressed genes (DEGs) at 3 h and 6 h post intestinal ischemia/reperfusion (I/R) injury, including (A) upregulated DEGs following intestinal I/R. (B) Downregulated DEGs following intestinal I/R injury.
 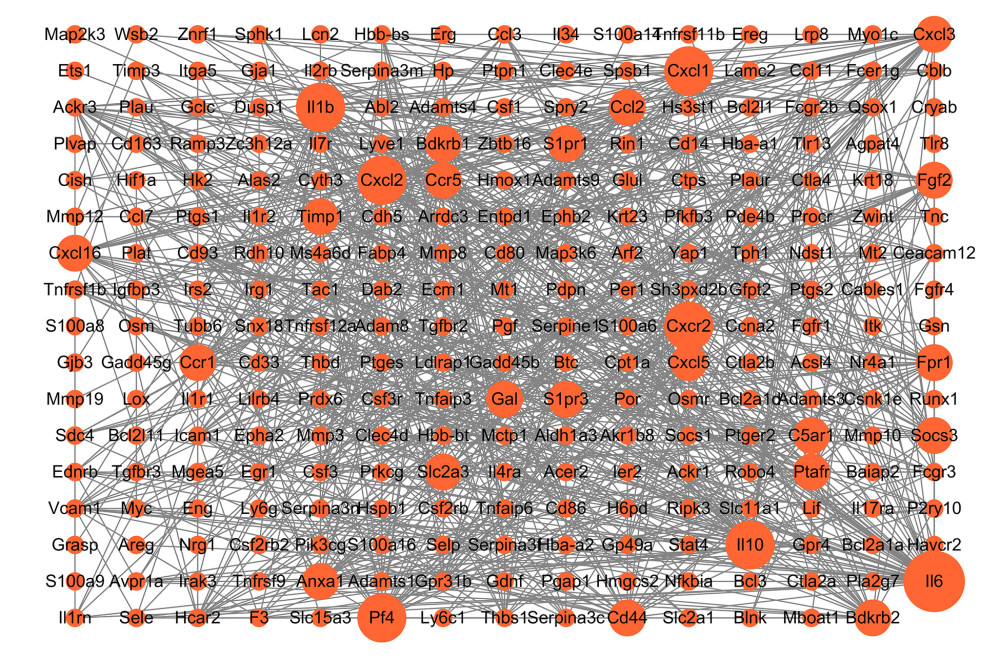 Figure 7. Protein–protein interaction network of upregulated differentially expressed genes. Higher degree nodes had larger size.
 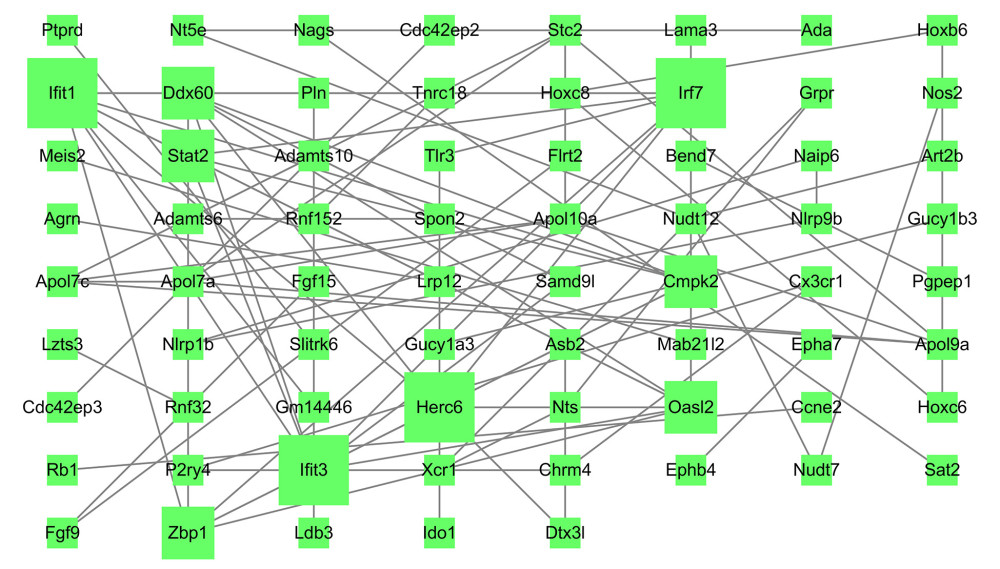 Figure 8. Protein–protein interaction network of downregulated differentially expressed genes. Higher degree nodes had larger size.
 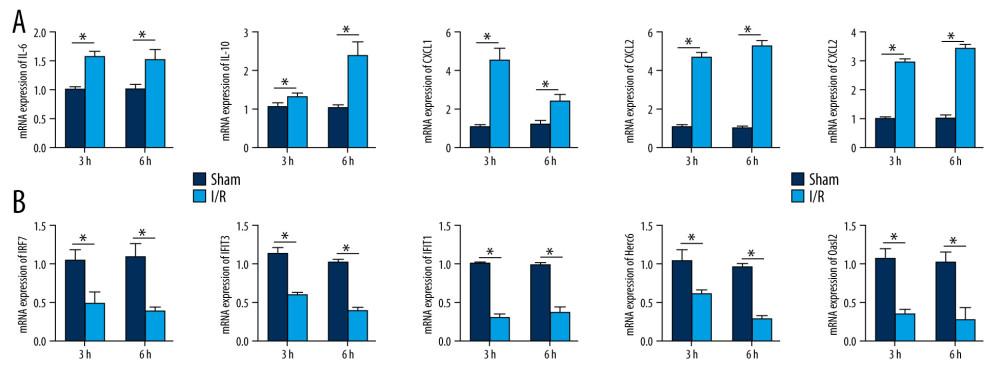 Figure 9. Validation of the mRNA expression levels of hub genes in the mice model of intestinal ischemia/reperfusion (I/R) injury and sham-operated samples. (A) The hub genes identified for common upregulated differentially expressed genes (DEGs) at 3 h and 6 h post intestinal I/R injury. (B) The hub genes identified for common downregulated DEGs at 3 h and 6 h post intestinal I/R injury. * P<0.05.
 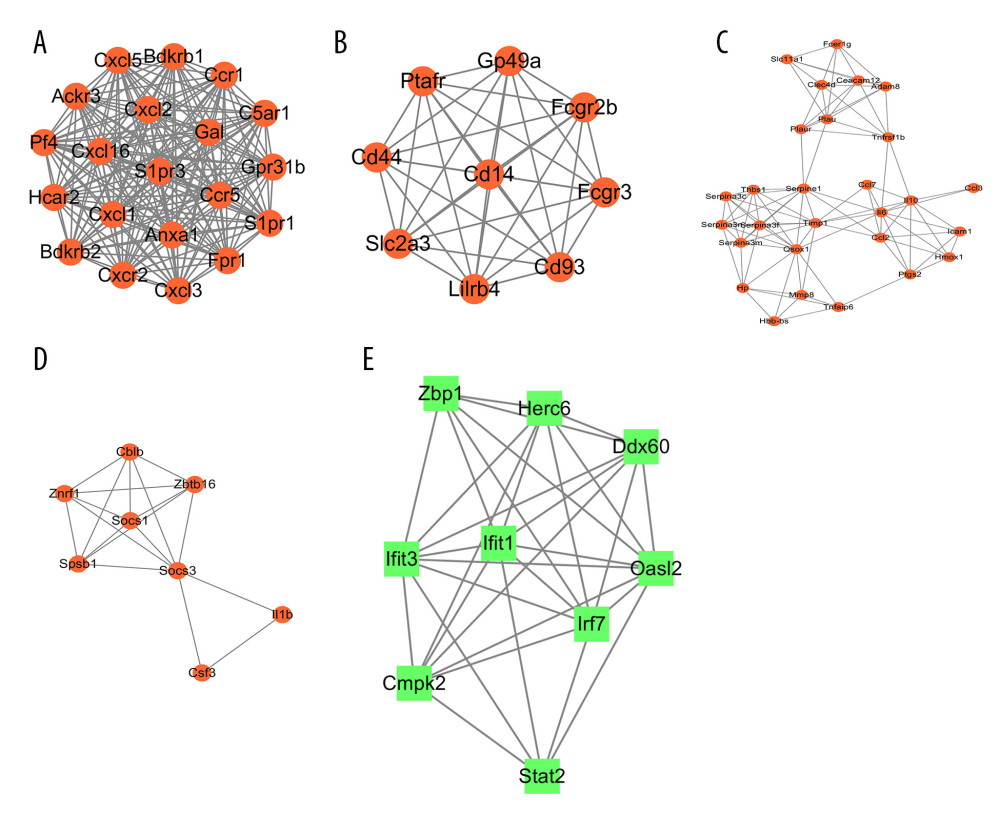 Figure 10. The modules a (A), b (B), c (C), d (D), and e (E) obtained from the protein–protein interaction (PPI) network. (A–D) The visualized genes of modules in the upregulated differentially expressed genes (DEGs) PPI network. (E) The visualized genes of modules in the downregulated DEGs PPI network.
 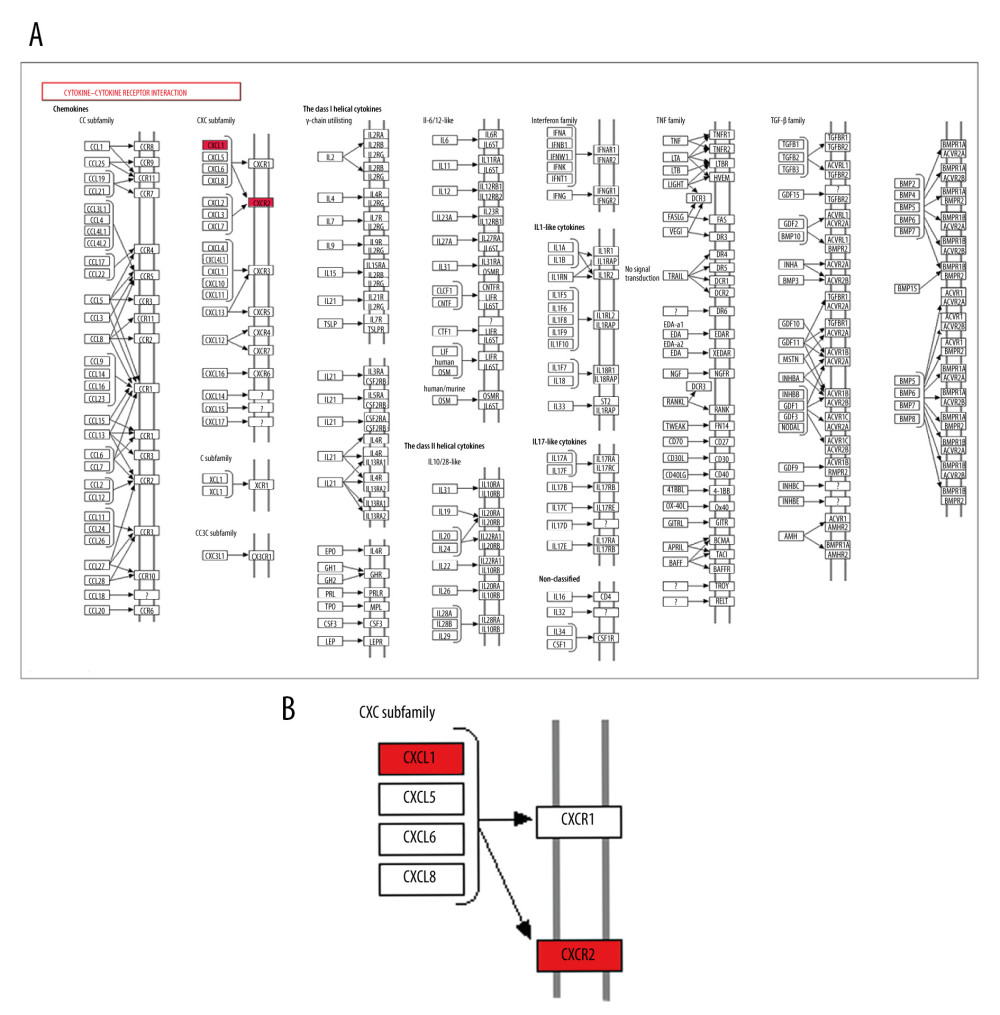 Figure 11. CXCR2 and CXCL1 in the Cytokine-cytokine receptor interaction pathway. (A) Map of the Cytokine-cytokine receptor interaction pathway. (B) CXCR2 and CXCL1 are indicated by a red rectangle in the Cytokine-cytokine receptor interaction pathway.
 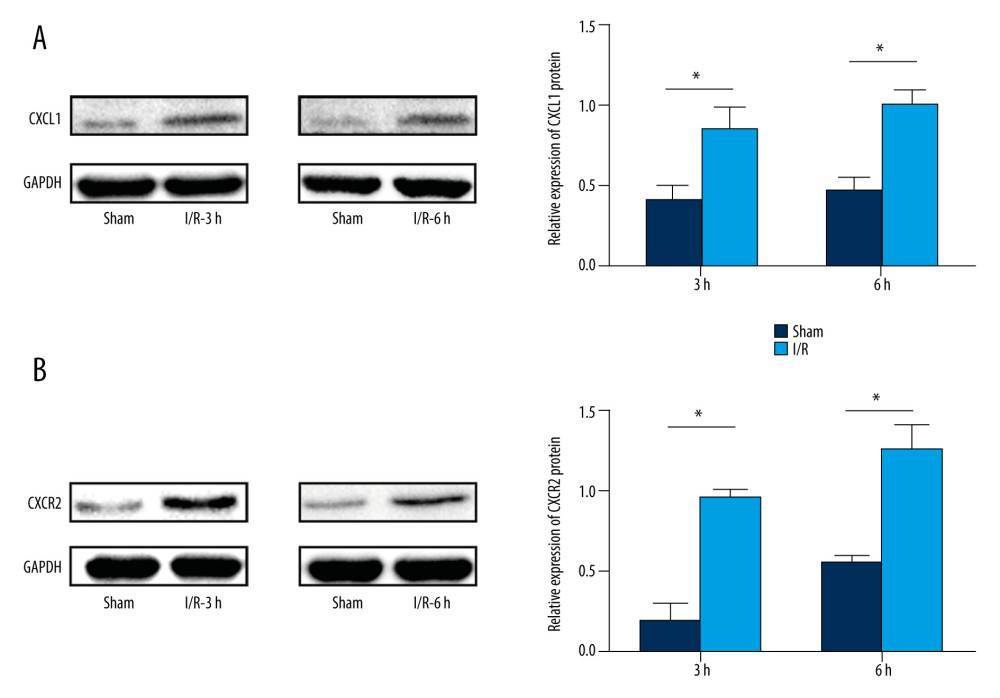 Figure 12. Protein expression levels of CXCR2 and CXCL1 in the mice model of intestinal ischemia/reperfusion (I/R) injury. (A) Western blot analysis showed that I/R increased CXCR2 protein expression at 3 h and 6 h post intestinal I/R injury. (B) Western blot analysis showed high protein expression of CXCL1 induced by I/R at 3 h and 6 h post intestinal I/R injury. * P<0.05 compared to sham-operated group.
 References
1. Corcos O, Nuzzo A, Gastro-intestinal vascular emergencies: Best Pract Res Clinl Gastroenterol, 2013; 27(5); 709-25
2. Kalogeris T, Baines CP, Krenz M, Korthuis RJ, Cell biology of ischemia/reperfusion injury: Int Rev Cell Mol Biol, 2012; 298; 229-317
3. Meszaros AT, Buki T, Fazekas B, Inhalation of methane preserves the epithelial barrier during ischemia and reperfusion in the rat small intestine: Surgery, 2017; 161(6); 1696-709
4. Oldenburg WA, Lau LL, Rodenberg TJ, Acute mesenteric ischemia – A clinical review: Arch Intern Med, 2004; 164(10); 1054-62
5. Berlanga J, Prats P, Remirez D, Prophylactic use of epidermal growth factor reduces ischemia/reperfusion intestinal damage: Am J Pathol, 2002; 161(2); 373-79
6. Chen Y, Lui VCH, Rooijen NV, Tam PKH, Depletion of intestinal resident macrophages prevents ischaemia reperfusion injury in gut: Gut, 2004; 53(12); 1772-80
7. Zhang XY, Guan S, Zhang HF, Activation of PD-1 Protects intestinal immune defense through IL-10/miR-155 pathway after intestinal ischemia reperfusion: Dig Dis Sci, 2018; 63(12); 3307-16
8. Wang T, Zheng X, Li RD, Integrated bioinformatic analysis reveals YWHAB as a novel diagnostic biomarker for idiopathic pulmonary arterial hypertension: J Cell Physiol, 2019; 234(5); 6449-62
9. Guo A, Wang W, Shi H, Identification of hub genes and pathways in a rat model of renal ischemia-reperfusion injury using bioinformatics analysis of the gene expression omnibus (GEO) dataset and integration of gene expression profiles: Med Sci Monit, 2019; 25; 8403-11
10. Karhausen J, Bernstock JD, Johnson KR, Ubc9 overexpression and SUMO1 deficiency blunt inflammation after intestinal ischemia/reperfusion: Lab Invest, 2018; 98(6); 799-813
11. Gao L, Xu W, Fan S, MANF attenuates neuronal apoptosis and promotes behavioral recovery via Akt/MDM-2/p53 pathway after traumatic spinal cord injury in rats: Biofactors, 2018 [Online ahead of print]
12. Carvalho BS, Irizarry RA, A framework for oligonucleotide microarray preprocessing: Bioinformatics, 2010; 26(19); 2363-67
13. Ritchie ME, Phipson B, Wu D, limma powers differential expression analyses for RNA-sequencing and microarray studies: Nucleic Acids Res, 2015; 43(7); 13
14. Lin Z, Lin Y, Identification of potential crucial genes associated with steroid-induced necrosis of femoral head based on gene expression profile: Gene, 2017; 627; 322-26
15. Sang L, Wang XM, Xu DY, Zhao WJ, Bioinformatics analysis of aberrantly methylated-differentially expressed genes and pathways in hepatocellular carcinoma: World J Gastroenterol, 2018; 24(24); 2605-16
16. Watson MJ, Ke B, Shen XD, Intestinal ischemia/reperfusion injury triggers activation of innate toll-like receptor 4 and adaptive chemokine programs: Transplant Proc, 2008; 40(10); 3339-41
17. Dai Y, Mao Z, Han X, MicroRNA-29b-3p reduces intestinal ischaemia/reperfusion injury via targeting of TNF receptor-associated factor 3: Br J Pharmacol, 2019; 176(17); 3264-78
18. Zheng L, Han X, Hu Y, Dioscin ameliorates intestinal ischemia/reperfusion injury via adjusting miR-351-5p/MAPK13-mediated inflammation and apoptosis: Pharmacol Res, 2019; 139; 431-39
19. Tian S, Guo R, Wei S, Curcumin protects against the intestinal ischemia-reperfusion injury: Involvement of the tight junction protein ZO-1 and TNF-alpha related mechanism: Korean J Physiol Pharmacol, 2016; 20(2); 147-52
20. Heneghan AF, Pierre JF, Kudsk KA, JAK-STAT and intestinal mucosal immunology: JAKSTAT, 2013; 2(4); e25530
21. Hu Y, Mao Z, Xu L, Protective effect of dioscin against intestinal ischemia/reperfusion injury via adjusting miR-351-5p-mediated oxidative stress: Pharmacol Res, 2018; 137; 56-63
22. Lv L, Zheng L, Dong D, Dioscin, a natural steroid saponin, induces apoptosis and DNA damage through reactive oxygen species: A potential new drug for treatment of glioblastoma multiforme: Food Chem Toxicol, 2013; 59; 657-69
23. Ricardo-da-Silva FY, Fantozzi ET, Rodrigues-Garbin S, Estradiol modulates local gut injury induced by intestinal ischemia-reperfusion in male rats: Shock, 2017; 48(4); 477-83
24. Cuzzocrea S, Dugo L, Patel NS, High-density lipoproteins reduce the intestinal damage associated with ischemia/reperfusion and colitis: Shock, 2004; 21(4); 342-51
25. Tekin IO, Sipahi EY, Comert M, Low-density lipoproteins oxidized after intestinal ischemia/reperfusion in rats: J Surg Res, 2009; 157(1); e47-54
26. Madesh M, Ramachandran A, Pulimood A, Attenuation of intestinal ischemia/reperfusion injury with sodium nitroprusside: Studies on mitochondrial function and lipid changes: Biochim Biophys Acta, 2000; 1500(2); 204-16
27. Zhang L, Zhang F, He DK, MicroRNA-21 is upregulated during intestinal barrier dysfunction induced by ischemia reperfusion: Kaohsiung J Med Sci, 2018; 34(10); 556-63
28. Jin C, Fu WL, Zhang DD, The protective role of IL-1Ra on intestinal ischemia reperfusion injury by anti-oxidative stress via Nrf2/HO-1 pathway in rat: Biomed J, 2019; 42(1); 36-45
29. Sun Y, Lian M, Lin Y, Role of p-MKK7 in myricetin-induced protection against intestinal ischemia/reperfusion injury: Pharmacol Res, 2018; 129; 432-42
30. Ceulemans LJ, Verbeke L, Decuypere JP, Farnesoid X receptor activation attenuates intestinal ischemia reperfusion injury in rats: PLoS One, 2017; 12(1); e0169331
31. Janssen AW, Betzel B, Stoopen G, The impact of PPARalpha activation on whole genome gene expression in human precision cut liver slices: BMC Genomics, 2015; 16; 760
32. Losy J, Zaremba J, Skrobański P, CXCL1 (GRO-alpha) chemokine in acute ischaemic stroke patients: Folia Neuropathol, 2005; 43(2); 97-102
33. Mersmann J, Berkels R, Zacharowski P, Preconditioning by toll-like receptor 2 agonist Pam3CSK4 reduces CXCL1-dependent leukocyte recruitment in murine myocardial ischemia/reperfusion injury: Crit Care Med, 2010; 38(3); 903-9
34. Leng J, Liu W, Li L, MicroRNA-429/Cxcl1 axis protective against oxygen glucose deprivation/reoxygenation-induced injury in brain microvascular endothelial cells: Dose Response, 2020; 18(2) 1559325820913785
35. Maheshwari A, Christensen RD, Calhoun DA, Circulating CXC-chemokine concentrations in a murine intestinal ischemia-reperfusion model: Fetal Pediatr Pathol, 2004; 23(2–3); 145-57
36. Yu Y, Klemann C, Feng X, Increased inflammatory reaction to intestinal ischemia-reperfusion in neonatal versus adult mice: Eur J Pediatr Surg, 2015; 25(1); 46-50
37. Li L, Xu L, Yan J, CXCR2-CXCL1 axis is correlated with neutrophil infiltration and predicts a poor prognosis in hepatocellular carcinoma: J Exp Clin Cancer Res, 2015; 34; 129
38. Liu P, Li X, Lv W, Xu Z, Inhibition of CXCL1-CXCR2 axis ameliorates cisplatin-induced acute kidney injury by mediating inflammatory response: Biomed Pharmacother, 2020; 122; 109693
39. Yellowhair TR, Noor S, Maxwell JR, Preclinical chorioamnionitis dysregulates CXCL1/CXCR2 signaling throughout the placental-fetal-brain axis: Exp Neurol, 2018; 301(Pt B); 110-19
40. Manjavachi MN, Passos GF, Trevisan G, Spinal blockage of CXCL1 and its receptor CXCR2 inhibits paclitaxel-induced peripheral neuropathy in mice: Neuropharmacology, 2019; 151; 136-43
41. Boro M, Balaji KN, CXCL1 and CXCL2 regulate NLRP3 inflammasome activation via G-protein-coupled receptor CXCR2: J Immunol, 2017; 199(5); 1660-71
Figures
 Figure 1. Data normalization. Box plots of gene expression in the post intestinal ischemia/reperfusion injury and sham groups at 3 h or 6 h (A) before and (B) after normalization.
 Figure 2. The volcano plot of differentially expressed genes (DEGs). (A) The volcano plot of 1171 DEGs at 3 h post intestinal I/R. (B) The volcano plot of 1885 DEGs at 6 h post intestinal I/R injury. The red dots represent upregulated DEGs and the green dots indicate downregulated DEGs.
 Figure 3. Hierarchical clustering analysis included DEGs between the sham control and intestinal ischemia/reperfusion (I/R) injury groups. Relative levels of gene expression are represented using a color scale: blue represents downregulated gene levels and red represents upregulated gene levels. (A) 3 h post intestinal I/R injury vs. sham. GSM2539097/2539098/2539099/2539100 refers to the intestine samples from the sham control group, and GSM2539106/2539105/2539108/2539107 refers to the intestine samples from the intestinal I/R group. (B) 6 h post intestinal I/R vs. sham. GSM2539097/2539098/2539099/2539100 refers to the intestine samples from the sham control group, and GSM2539116/2539113/2539115/2539114 refers to the intestine samples from the intestinal I/R group.
 Figure 4. The Gene Ontology (GO) annotations for biological process of the 10 most significant GO enrichment terms. The vertical axis represents enriched GO categories and the horizontal axis represents the ratio of enriched genes in the selected category to all genes analyzed in the GO enrichment analyses. (A) Dot plot shows the upregulated differentially expressed genes (DEGs) at 3 h post intestinal ischemia/reperfusion (I/R) injury; (B) Dot plot shows the downregulated DEGs at 3h post intestinal I/R; (C) Dot plot shows the upregulated DEGs at 6 h post intestinal I/R; (D) Dot plot shows the downregulated DEGs at 6 h post intestinal I/R.
 Figure 5. The Kyoto Encyclopedia of Genes and Genomes (KEGG) pathway analysis of the 10 most significant KEGG enrichment terms. The vertical axis represents enriched KEGG categories, whereas the horizontal axis represents the ratio of enriched genes in the selected category to all genes analyzed in the KEGG enrichment analyses. (A) Dot plot shows the upregulated differentially expressed genes (DEGs) at 3 h post intestinal ischemia/reperfusion (I/R) injury; (B) Dot plot shows the downregulated DEGs at 3 h post intestinal I/R; (C) Dot plot shows the upregulated DEGs at 6 h post intestinal I/R; (D) Dot plot shows the downregulated DEGs at 6 h post intestinal I/R.
 Figure 6. Venn diagrams of differentially expressed genes (DEGs) at 3 h and 6 h post intestinal ischemia/reperfusion (I/R) injury, including (A) upregulated DEGs following intestinal I/R. (B) Downregulated DEGs following intestinal I/R injury.
 Figure 7. Protein–protein interaction network of upregulated differentially expressed genes. Higher degree nodes had larger size.
 Figure 8. Protein–protein interaction network of downregulated differentially expressed genes. Higher degree nodes had larger size.
 Figure 9. Validation of the mRNA expression levels of hub genes in the mice model of intestinal ischemia/reperfusion (I/R) injury and sham-operated samples. (A) The hub genes identified for common upregulated differentially expressed genes (DEGs) at 3 h and 6 h post intestinal I/R injury. (B) The hub genes identified for common downregulated DEGs at 3 h and 6 h post intestinal I/R injury. * P<0.05.
 Figure 10. The modules a (A), b (B), c (C), d (D), and e (E) obtained from the protein–protein interaction (PPI) network. (A–D) The visualized genes of modules in the upregulated differentially expressed genes (DEGs) PPI network. (E) The visualized genes of modules in the downregulated DEGs PPI network.
 Figure 11. CXCR2 and CXCL1 in the Cytokine-cytokine receptor interaction pathway. (A) Map of the Cytokine-cytokine receptor interaction pathway. (B) CXCR2 and CXCL1 are indicated by a red rectangle in the Cytokine-cytokine receptor interaction pathway.
 Figure 12. Protein expression levels of CXCR2 and CXCL1 in the mice model of intestinal ischemia/reperfusion (I/R) injury. (A) Western blot analysis showed that I/R increased CXCR2 protein expression at 3 h and 6 h post intestinal I/R injury. (B) Western blot analysis showed high protein expression of CXCL1 induced by I/R at 3 h and 6 h post intestinal I/R injury. * P<0.05 compared to sham-operated group.
 In Press
15 Apr 2024 : Laboratory Research
The Role of Copper-Induced M2 Macrophage Polarization in Protecting Cartilage Matrix in OsteoarthritisMed Sci Monit In Press; DOI: 10.12659/MSM.943738
07 Mar 2024 : Clinical Research
Knowledge of and Attitudes Toward Clinical Trials: A Questionnaire-Based Study of 179 Male Third- and Fourt...Med Sci Monit In Press; DOI: 10.12659/MSM.943468
08 Mar 2024 : Animal Research
Modification of Experimental Model of Necrotizing Enterocolitis (NEC) in Rat Pups by Single Exposure to Hyp...Med Sci Monit In Press; DOI: 10.12659/MSM.943443
18 Apr 2024 : Clinical Research
Comparative Analysis of Open and Closed Sphincterotomy for the Treatment of Chronic Anal Fissure: Safety an...Med Sci Monit In Press; DOI: 10.12659/MSM.944127
Most Viewed Current Articles
17 Jan 2024 : Review article
Vaccination Guidelines for Pregnant Women: Addressing COVID-19 and the Omicron VariantDOI :10.12659/MSM.942799
Med Sci Monit 2024; 30:e942799
14 Dec 2022 : Clinical Research
Prevalence and Variability of Allergen-Specific Immunoglobulin E in Patients with Elevated Tryptase LevelsDOI :10.12659/MSM.937990
Med Sci Monit 2022; 28:e937990
16 May 2023 : Clinical Research
Electrophysiological Testing for an Auditory Processing Disorder and Reading Performance in 54 School Stude...DOI :10.12659/MSM.940387
Med Sci Monit 2023; 29:e940387
01 Jan 2022 : Editorial
Editorial: Current Status of Oral Antiviral Drug Treatments for SARS-CoV-2 Infection in Non-Hospitalized Pa...DOI :10.12659/MSM.935952
Med Sci Monit 2022; 28:e935952


