08 December 2020 : Database Analysis
Molecular Mechanisms Underlying Intestinal Ischemia/Reperfusion Injury: Bioinformatics Analysis and In Vivo Validation
Fengshou Chen1ABCDEF, Dan Wang1BCDE, Xiaoqian Li1ACD*, He Wang1ACDDOI: 10.12659/MSM.927476
Med Sci Monit 2020; 26:e927476


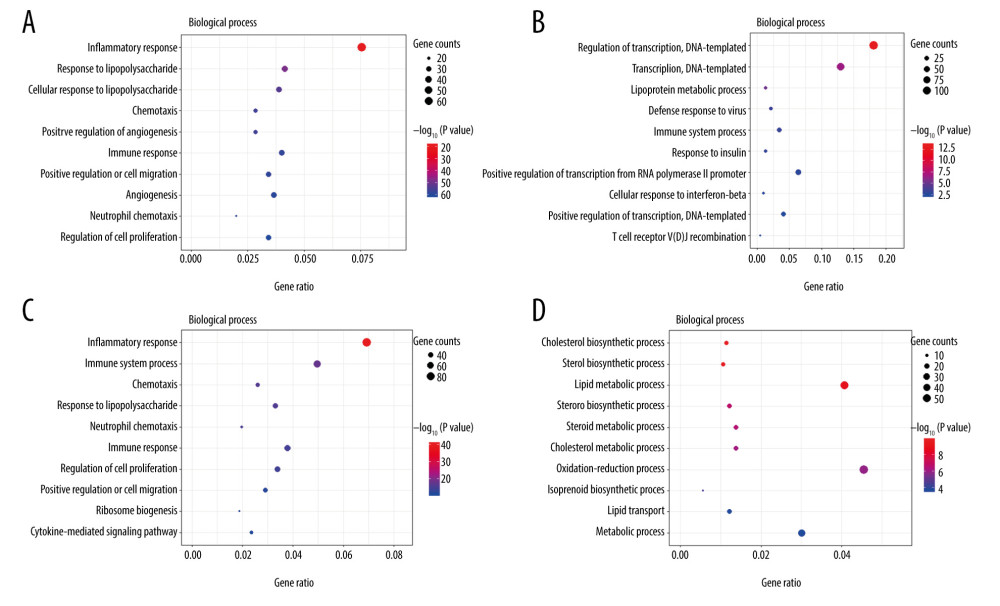
Figure 4 The Gene Ontology (GO) annotations for biological process of the 10 most significant GO enrichment terms. The vertical axis represents enriched GO categories and the horizontal axis represents the ratio of enriched genes in the selected category to all genes analyzed in the GO enrichment analyses. (A) Dot plot shows the upregulated differentially expressed genes (DEGs) at 3 h post intestinal ischemia/reperfusion (I/R) injury; (B) Dot plot shows the downregulated DEGs at 3h post intestinal I/R; (C) Dot plot shows the upregulated DEGs at 6 h post intestinal I/R; (D) Dot plot shows the downregulated DEGs at 6 h post intestinal I/R.