29 January 2021 : Database Analysis
Construction and Evaluation of a Risk Score Model for Autophagy-Related Genes in Esophageal Adenocarcinoma
Tianfu Xu1ABCDEF, Yamei Yuan2EFG*, Chenggong He3D, Kun Yang3DDOI: 10.12659/MSM.927850
Med Sci Monit 2021; 27:e927850


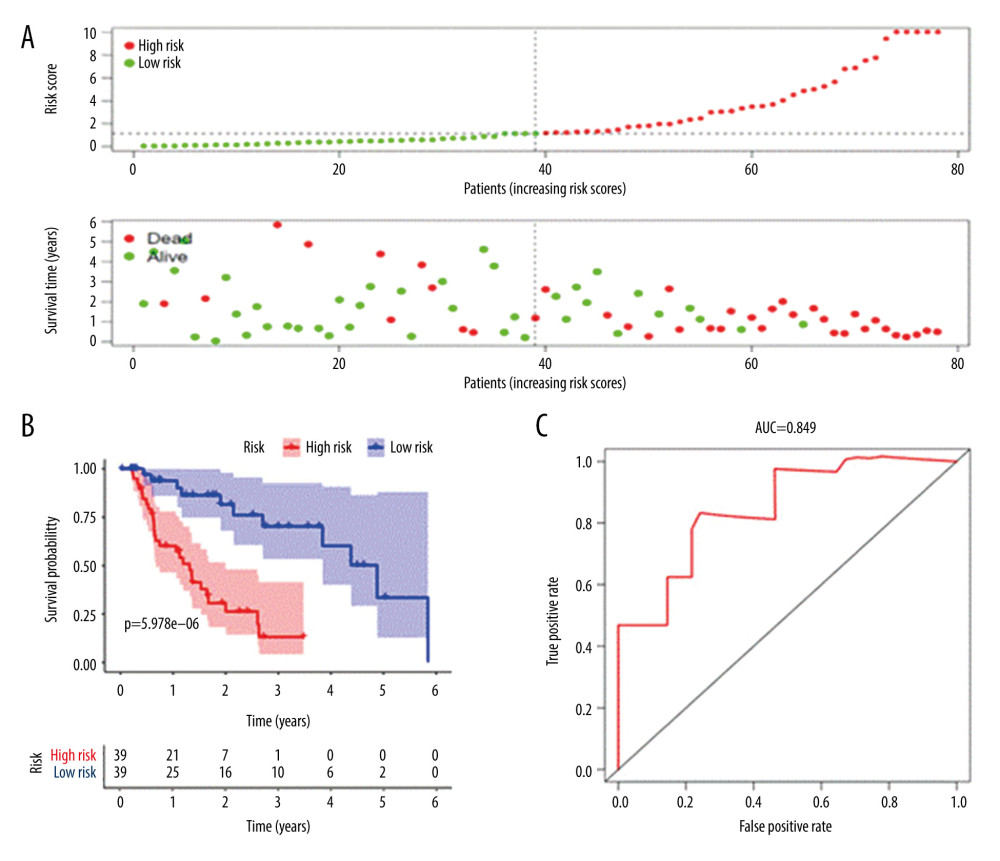
Figure 4 Prognostic risk assessment model for patients with esophageal adenocarcinoma (EAC). (A) From top to bottom are the risk scores and patients’ survival status distribution. The green dots in the figure represent the surviving patients, and the red dots represent the dead patients. The dotted line represents the median value of the risk score. The dotted line’s left side represents the low-risk score group, and the right side of the dotted line represents the high-risk score group. With the increase of patients’ risk score, the number of red dots increased gradually, and the number of dead patients increased. It shows that the patients with esophageal adenocarcinoma in the high-risk group have lower survival and a higher risk of death. (B) Kaplan-Meier curves for low- and high-risk groups. (C) Receiver operating characteristic (ROC) curve for predicting survival in EAC patients by the risk score. AUC – area under the curve.