29 January 2021: Database Analysis
Construction and Evaluation of a Risk Score Model for Autophagy-Related Genes in Esophageal Adenocarcinoma
Tianfu Xu1ABCDEF, Yamei Yuan2EFG*, Chenggong He3D, Kun Yang3DDOI: 10.12659/MSM.927850
Med Sci Monit 2021; 27:e927850


Abstract
BACKGROUND: Several studies have suggested the importance of autophagy during esophageal adenocarcinoma (EAC) development. This study aimed to explore the autophagy-related genes correlated with overall survival in patients with EAC.
MATERIAL AND METHODS: The RNA-seq expression profiles and clinical data of patients with EAC were screened using The Cancer Genome Atlas (TCGA) database. Screening of autophagy-related genes was conducted using the human autophagy database (HADb). Bioinformatic analysis was conducted and included the following: univariate cox, lasso regression, and multivariate cox regression analysis; building overall survival assessment of the prognosis model; drawing the model of receiver operating characteristic (ROC) curve and determining the area under the curve; and a C-index reliability index assessment model through Kaplan-Meier screening of statistically significant genes in the model. The screening results were verified via Oncomine differential expression analysis. Gene set enrichment analysis (GSEA) was further used to analyze the molecular biological functions and related pathways of the gene model.
RESULTS: Through cox regression and ROC analysis, the model showed that the risk score could accurately and independently predict the prognosis of EAC. The screening identified 4 genes: DAPK1, BECN1, ATG5, and VAMP7. GSEA showed that the high and low expression levels of the 4 genes were mainly enriched in biological functions, such as cell production and regulation, and metabolic pathways that maintain cell activity.
CONCLUSIONS: Our research found that autophagy was involved in the process of EAC development and that several autophagy-related genes may provide prognostic information and clinical application value for patients with EAC.
Keywords: Esophageal Neoplasms, Genetic Association Studies, Autophagy-Related Protein 5, beclin-1, Biomarkers, Tumor, Computational Biology, Databases, Genetic, Death-Associated Protein Kinases, R-SNARE Proteins, ROC Curve, Reproducibility of Results, Risk Factors
Background
Esophageal adenocarcinoma (EAC) is one of the most common malignant tumors and the sixth leading cause of cancer deaths. EAC is a pathological subtype of esophageal cancer mainly occurring in the lower esophagus, which is connected with the stomach. EAC development is related to Barrett’s esophagus, gastric reflux, and obesity [1]. At present, the incidence of esophageal adenocarcinoma is increasing in Asia [2]. Owing to the lack of reliable early diagnostic methods and effective interventions, the 5-year survival rate of EAC is less than 20% [3]. EAC malignancy is asymptomatic in the early stage, with symptoms generally appearing in the middle and late stages [4]. Patients with localized EAC can undergo surgical and postoperative therapies, including chemoradiotherapy [5]. However, the treatment of advanced or metastatic EAC provides only palliative and supportive care. Therefore, there is an urgent need to find innovative methods and biomarkers for early detection of EAC and new treatment strategies. So far, several prognostic studies have used various indicators (including DKK3 [6], TXNIP [7], CTO1 [8], and GRB7 [9]) that have been reported as prognostic biomarkers for patients with EAC. However, the median survival of EAC has increased only slightly, and there is still a lack of sensitive gene combination markers to evaluate the prognosis of patients with EAC. Therefore, more studies are needed to explore potential prognostic markers and treatment strategies for EAC.
Autophagy is a crucial biological process that balances cell homeostasis through the degradation of proteins and organelles in cells. Previous studies have validated the role of autophagy in promoting tumor cell survival and suppressing oncogenesis [10–12]; therefore, enhancing and inhibiting autophagy has been suggested as a possible treatment strategy [13–16]. Other studies have demonstrated that autophagy activation shows a marked correlation with tumor dormancy, chemoresistance, and stem cell survival [17]. Exploring the relationship between EAC and autophagy could further elucidate the mechanisms of pathogenesis and improve prognosis and treatment options.
Large-scale expression data have scarcely assessed the role of autophagy in EAC prognosis. This study constructed a bioinformatic prognostic model of EAC based on the RNA-seq expression profile of EAC tissues in The Cancer Genome Atlas (TCGA) database and further determined predictive biomarkers related to autophagy.
Material and Methods
PATIENT SAMPLES AND GENE EXTRACTION:
EAC-related RNA-seq data and clinical data were downloaded from the TCGA database (TCGA,
A query in the human autophagy database (HADb,
UNIVARIATE COX AND LASSO REGRESSION ANALYSIS:
Using combined patient survival information, the survival package in R software was used to conduct a univariate Cox regression analysis of genes with autophagy-related differences. The hazard ratio (HR) and
The screened genes were further analyzed by lasso regression analysis using the glmnet package of R software [18,19], and the regression coefficient was determined by cross-validation to reduce the influence of collinearity among genes [20], prevent the risk model variables from overfitting, and conduct other screens affecting the prognosis of EAC.
MULTIVARIATE COX REGRESSION ANALYSIS AND PROGNOSTIC MODEL CONSTRUCTION:
Using survival R software packages, the lasso method was used to select genes obtained by multivariable Cox regression analysis. According to the Akaike information criterion (AIC), the lowest AIC value yields the smallest model, which is the optimal model [21] containing the critical genes. To calculate the critical genes multifactor regression coefficient, a prognostic risk factor score equation was built:
where exp is the expression level of each gene in the sample, and β is the corresponding gene’s multifactor regression coefficient. The prognostic risk coefficient of each gene was calculated according to the formula. According to the risk value’s median value, the HR value and 95% confidence interval (CI) of the critical genes in the model were calculated. Based on the median risk score, patients with EAC were divided into low- and high-risk groups. The survival analyses were recognized as key outcomes, and Kaplan-Meier (K-M) analysis was used to analyze the overall survival among the various score ranges. Time-dependent receiver operating characteristic (ROC) curves were plotted to calculate the risk model’s predictive ability. R software (version 3.6.1) was used to make bioinformatic analyses.
PROGNOSTIC MODEL EVALUATION AND ONCOMINE ANALYSIS:
The ROC curve of the model was drawn using the survival ROC package in R software. We determined the area under the curve (AUC) values, and the C-index was calculated to evaluate the model’s sensitivity and prediction ability. The higher the AUC and C-index, the better the model’s prognostic accuracy. Through K-M survival analysis of the critical genes in the prognostic model, the value and significance of a single gene in EAC prognostic prediction were explored.
The differentially expressed genes were analyzed using the Oncomine database (www.oncomine.org) [22]. The prognostic model results were verified, and the search conditions were set as high-expression ATG5 gene and low-expression BECN1 gene in the survival analysis of the essential prognostic genes. For differential analysis, the analysis parameters were P<0.05, fold change=all, gene rank=all, cancer type=esophageal adenocarcinoma, and the first 4 results with the lowest P values were drawn.
GENE SET ENRICHMENT ANALYSIS:
To further explore the biological functions of EAC disease-related genes, gene set enrichment analysis (GSEA) was used in this study [23] to assess the phenotypic correlation gene in the distribution trend list, sort and analyze critical genes in EAC prognosis, and identify the biological function of a participating signaling pathway. From the Molecular Signature database (MsigDB), the Gene Ontology (GO) reference gene set “c5. all. v7.1. symbols. gmt” and Kyoto Encyclopedia of Genes and Genomes (KEGG) reference gene set “c2. cp. kegg. v7.1. symbols. gmt” were used. Enrichment analysis was carried out using the weighted enrichment method. The random combination times were set as 1000, and the items with the highest enrichment scores and statistical significance (P<0.05) were visualized for analysis.
Results
SCREENING FOR DIFFERENTIAL GENES RELATED TO AUTOPHAGY:
The RNA-seq expression profile and clinical data of EAC were screened by the TCGA database, including 78 EAC samples and 9 normal tissue samples. The clinical baseline data of EAC patients are summarized in Table 1. The HADb database was used to screen 206 ARGs.
UNIVARIATE COX AND LASSO REGRESSION ANALYSIS:
A univariate Cox regression analysis was performed on ARGs to calculate the HR and P value of each gene for survival in EAC patients; 14 genes with a significant difference (P<0.05) were screened. Significant association defines the gene as a candidate gene, and the genes were mapped on a single factor Cox regression analysis diagram (Figure 1).
These genes were further screened using lasso regression (P<0.05) (Figure 1), and a model was established using cross-validation (Figure 2) to screen 13 significantly correlated candidate genes.
MULTIVARIATE COX ANALYSIS:
Thirteen significantly correlated candidate genes were screened by multivariate Cox analysis and the optimal model was selected according to the lowest AIC value; 8 genes were defined as key in the model and were used to draw the gene multivariable Cox analysis diagram (Figure 3).
The prognostic risk score was calculated according to the corresponding regression coefficient, where the risk score=(0.460965×TP73
The prognostic risk index of all samples was calculated and divided into cutoff points by the median value dividing the risk indexes into a high-risk group and a low-risk group for subsequent analysis.
DRAWING OF SURVIVAL CURVE, RISK CURVE, AND ROC CURVE:
The survival score was obtained based on a prognostic risk assessment model derived from the multivariate Cox analysis. The median of the prognostic risk index of the sample was 1.14E+00. Patients with a risk index >1.14E+00 were defined as a high-risk group and patients with a risk index <1.14E+00 were defined as a low-risk group.
The risk curve, survival point map, and risk value of the relationship between the expression of critical genes were drawn by analyzing the survival difference of patients in the high- and low-risk assessment groups (Figure 4A). The results showed that with the increase of risk score, the number of deaths in the high-risk group was higher than that in the low-risk group, indicating that the survival rate of patients in the high-risk group was low. A K-M survival curve (Figure 4B) was drawn for the high-risk and low-risk groups. From the survival data, the 3-year survival rate was 13.1% (95% CI, 4.15–4.16%) in the high-risk group and 70.2% (95% CI, 53.3–92.6%) in the low-risk group. The difference in survival rate between the 2 groups increased with the passing of time. The difference between the 2 groups was statistically significant (P<5.978E-06). At the same time, the ROC curve model was drawn (Figure 4C), where the overall survival for AUC was 0.849, and the C-index was 0.808, indicating that the model was accurate in the prognosis of patients with EAC and had good clinical value.
SURVIVAL ANALYSIS OF ESSENTIAL EAC PROGNOSTIC GENES:
Further single-gene K-M survival analysis was performed on the 8 critical genes in the model obtained by multivariate Cox regression analysis. The results showed that 4 of the genes were statistically significant (P<0.05) and related to prognosis, namely, VAMP7, ATG5, BECN1, and DAPK1. The higher the expression level of VAMP7 and ATG5, the worse the prognosis, and the higher the expression level of BECN1 and DAPK1, the better the prognosis (Figure 5). These results indicated that VAMP7 and ATG5 may be independent adverse factors for EAC prognosis, while BECN1 and DAPK1 may be independent protective factors for EAC prognosis.
DIFFERENTIAL EXPRESSION ANALYSIS OF ATG5 AND BECN1 GENES IN THE ONCOMINE DATABASE:
The Oncomine database was used to analyze the differential expression of ATG5, an independent adverse prognostic factor of EAC, and BECN1, an independent protective factor of EAC. The first 4 differential analyses results of the 2 genes with statistical significance (P<0.05) were selected for statistical analysis. Among all differentially expressed genes, the median value of ATG5 was 580.5 (P=0.008), indicating that ATG5 was significantly highly expressed in EAC tissue (Figure 6A). The BECN1 gene ranked 1739.5 among all differentially expressed genes (P=0.007), indicating that BECN1 had significantly low expression in EAC tissue (Figure 6B).
GSEA OF ESSENTIAL PROGNOSTIC GENES:
GO functional enrichment analysis of prognostic EAC genes by GSEA was carried out with “c5. all. v7.1. symbols. gmt” as the reference gene set, and the critical prognosis genes in GO were enriched in 5426 expression samples, 3949 of which had high expression and 1477 of which had low expression. There were 168 statistically significant genes in the high-expression samples (P<0.05) and 28 statistically significant genes in the low-expression samples (P<0.05). The top 5 items with highest enrichment scores in the high- and low-expression sample (Table 2) were visualized (Figure 7).
Using “c2. cp. kegg. v7.1. symbols. gmt” as the reference gene set, KEGG enrichment analysis results showed the prognosis of critical gene enrichment of the KEGG pathway in 178 genes, 94 of which had high expression and 84 of which had low expression. Among them, 3 were statistically significant in the high-expression samples (P<0.05), and 6 were statistically significant in the low-expression samples (P<0.05) (Table 3). The above 9 items were visualized in high and low expression (Figure 8).
Discussion
Although esophagectomy, chemotherapy, and radiotherapy can improve EAC prognosis, not all EAC patients are helped by these therapies. The current application of molecularly targeted drugs in the treatment of EAC is not satisfactory [24]. The mechanism of autophagy in tumors has long been proposed as a new therapeutic approach. Several studies have supported an association of distinct expression levels between autophagic genes and EAC, showing that ARG regulation may be associated with EAC occurrence and development [25]. Therefore, we searched for EAC autophagy genes as molecular markers to help design an autophagy-targeted treatment strategy to improve patient prognosis with esophageal cancer.
This study summarized the RNA-seq data and clinical information on EAC in the TCGA database. The HADb database screened 206 ARGs, univariate Cox regression analysis was used to obtain 14 prognostic ARGs to reduce the collinearity between genes, 13 ARGs were obtained by Lasso regression analysis, and the HR values and corresponding
DAPK1 regulates multiple cellular processes and plays an essential role in the pro-apoptotic, apoptotic, and autophagy pathways. DAPK1 participates in autophagy by phosphorylating downstream Beclin-1 and enhances autophagy via interaction with Beclin-1 [26]. Some studies have found that Beclin-1 gene mutation or gene knockout cells could not form an effective autophagosome to clear damaged organelles, and mitochondria could not repair DNA and protein damage, leading to aggregation of harmful substances, inflammatory factors, and cytokines, thus inducing tumor formation [27]. Other studies showed that Beclin-1 expression is significantly decreased in the tumor tissues of digestive tract tumors and the corresponding normal tissue cells, indicating that Beclin-1-mediated autophagy plays a role in the inhibition of tumor development [28]. Recent research shows that the loss of Beclin-1 expression occurs more frequently in patients with EAC than in controls (49.0%
Conclusions
ARGs affecting prognosis were screened and combined into a risk scoring model. Multiple bioinformatic methods confirmed their essential role in EAC prognosis. The relationship between risk score and survival time of patients was verified. The expression of these 4 genes, DAPK1, BECN1, ATG5 and VAMP7, can be used to calculate the risk score for any patient with EAC to evaluate the patients by clinical data analysis. The model could also be used as an independent prognostic factor, providing adequate prognostic information and clinical application value for patients with EAC.
Figures
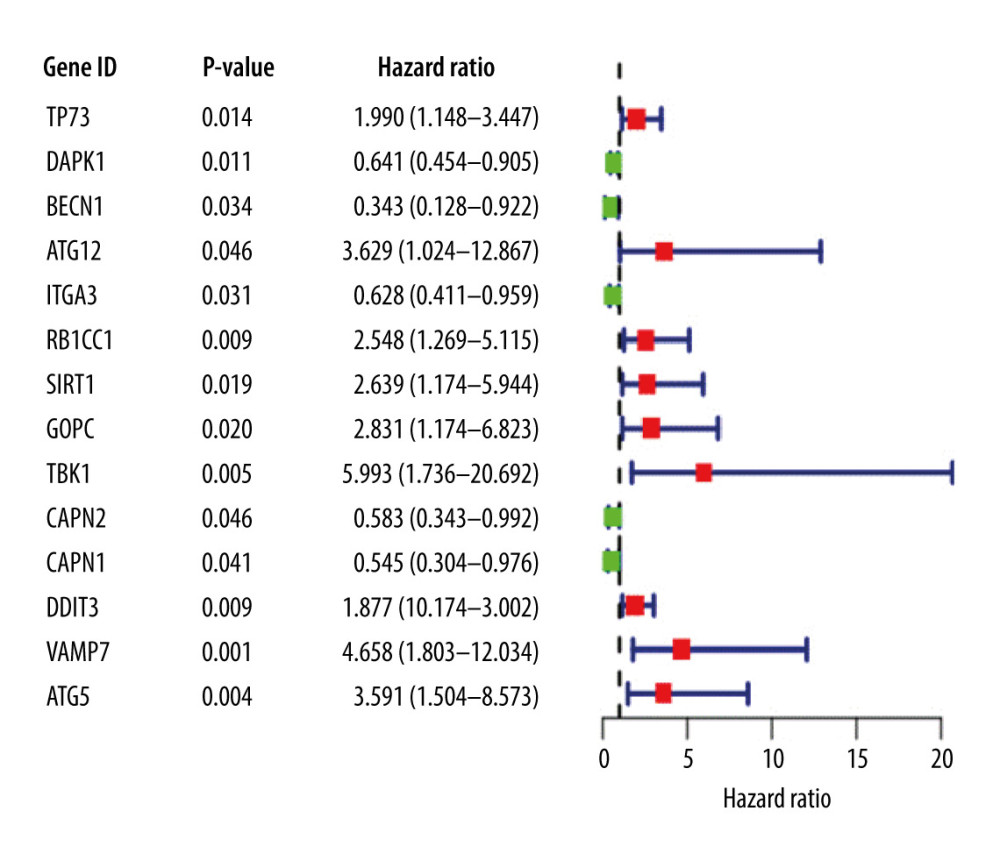 Figure 1. Univariate Cox proportional hazards regression analysis of 14 prognostic genes in patients with esophageal adenocarcinoma. The red and green squares represent the hazards ratio (HR) and the short transverse lines represent the 95% confidence interval. P<0.05.
 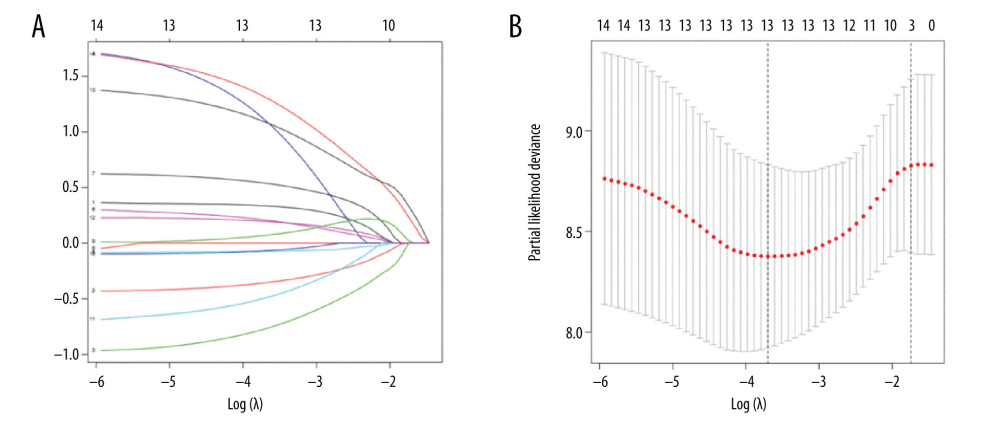 Figure 2. (A) Genes screened by lasso regression analysis. The lasso regression model and cross validation method were used to screen genes. When the number of variables was 13, the partial likelihood deviation is the minimum, corresponding to the minimum λ value. (B) Cross validation results. The regression coefficient map of genes in the lasso model. Dotted vertical lines were drawn at the optimal values by using the minimum criteria and the 1 standard error (SE) of the minimum criteria (the 1-SE criteria).
 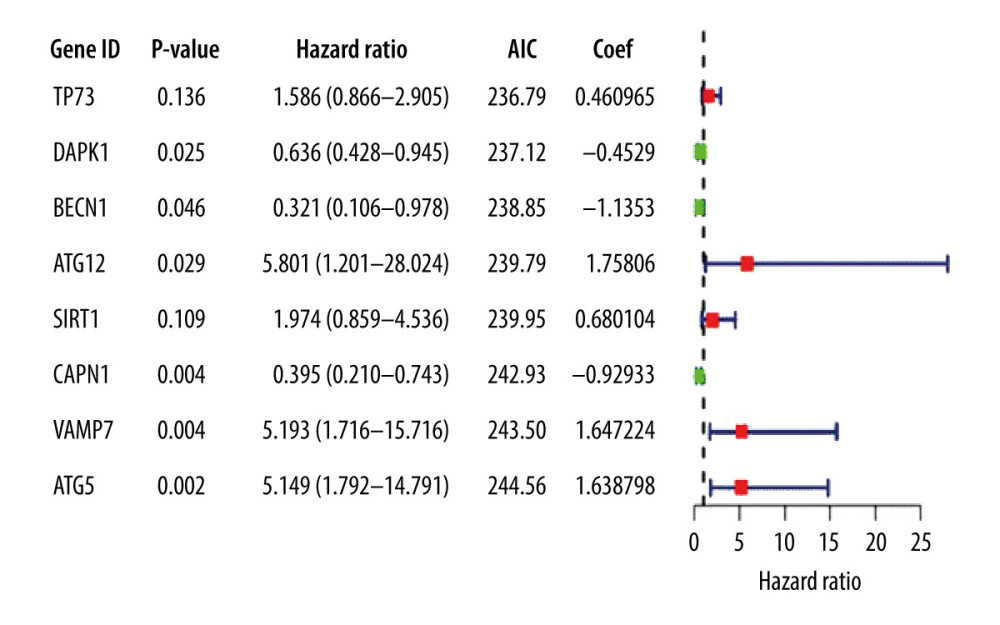 Figure 3. Multivariate Cox proportional hazards regression analysis of 8 prognostic genes in patients with esophageal adenocarcinoma. The red and green squares represent the hazards ratios and the short transverse lines represent 95% confidence intervals. P<0.05.
 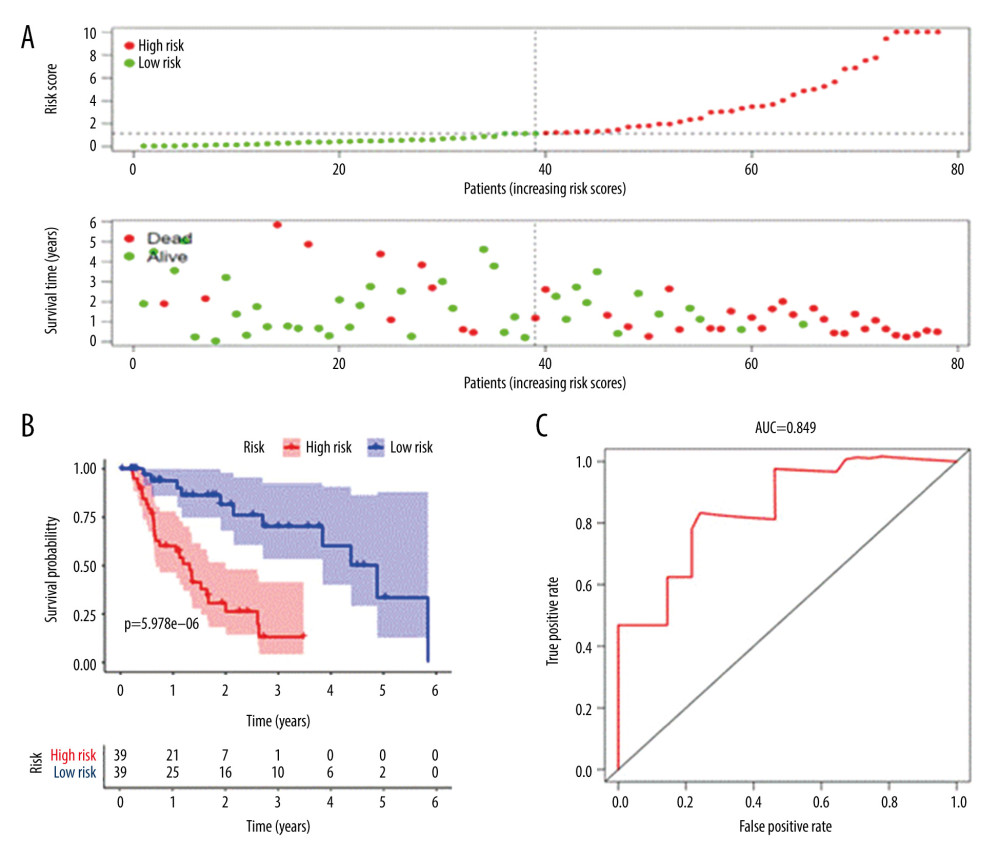 Figure 4. Prognostic risk assessment model for patients with esophageal adenocarcinoma (EAC). (A) From top to bottom are the risk scores and patients’ survival status distribution. The green dots in the figure represent the surviving patients, and the red dots represent the dead patients. The dotted line represents the median value of the risk score. The dotted line’s left side represents the low-risk score group, and the right side of the dotted line represents the high-risk score group. With the increase of patients’ risk score, the number of red dots increased gradually, and the number of dead patients increased. It shows that the patients with esophageal adenocarcinoma in the high-risk group have lower survival and a higher risk of death. (B) Kaplan-Meier curves for low- and high-risk groups. (C) Receiver operating characteristic (ROC) curve for predicting survival in EAC patients by the risk score. AUC – area under the curve.
 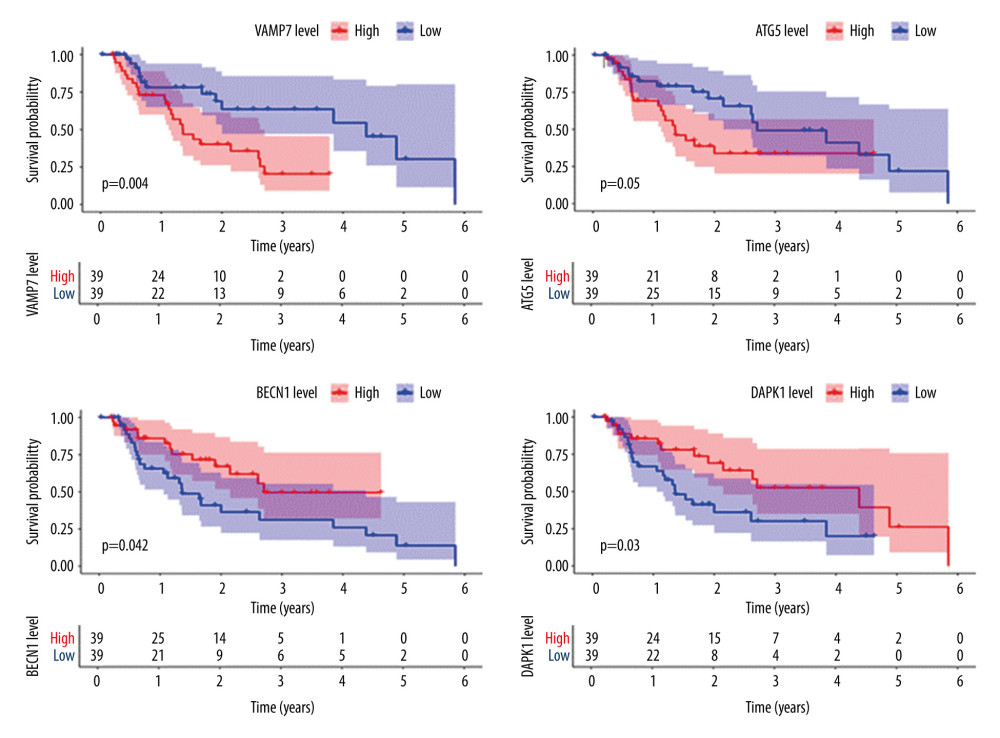 Figure 5. Survival analysis of genes associated with prognosis in patients with esophageal adenocarcinoma, Kaplan-Meier survival curves of 4 critical genes were selected with P<0.05 as the screening criteria. The red plots represent high expression and the blue plots represent median/low expression.
 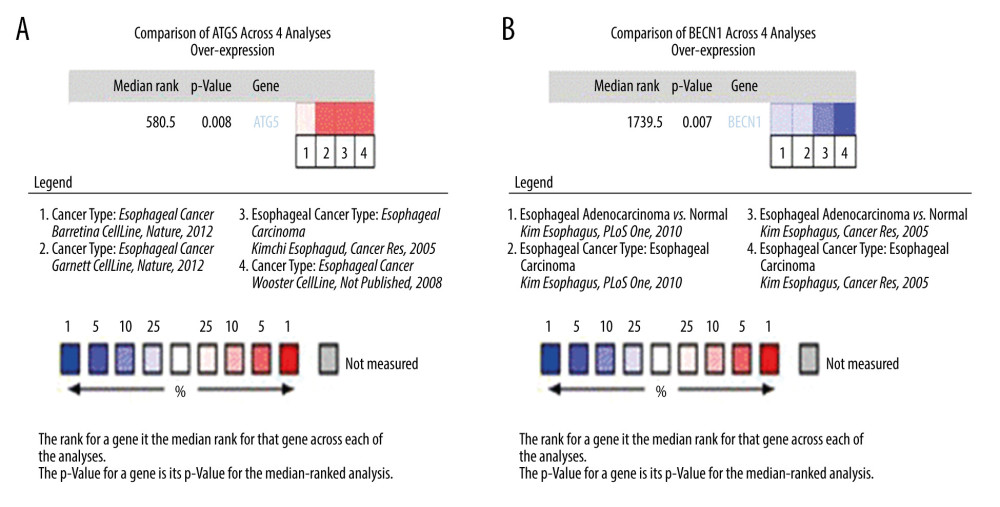 Figure 6. Expression analysis of esophageal adenocarcinoma (EAC) adverse prognostic factors based on the Oncomine database. (A) ATG5 and (B) BECN1 expression levels in EAC. The intensity of gene expression is indexed with the color bar, and the median rank is used to demonstrate the gene rank in each analysis.
 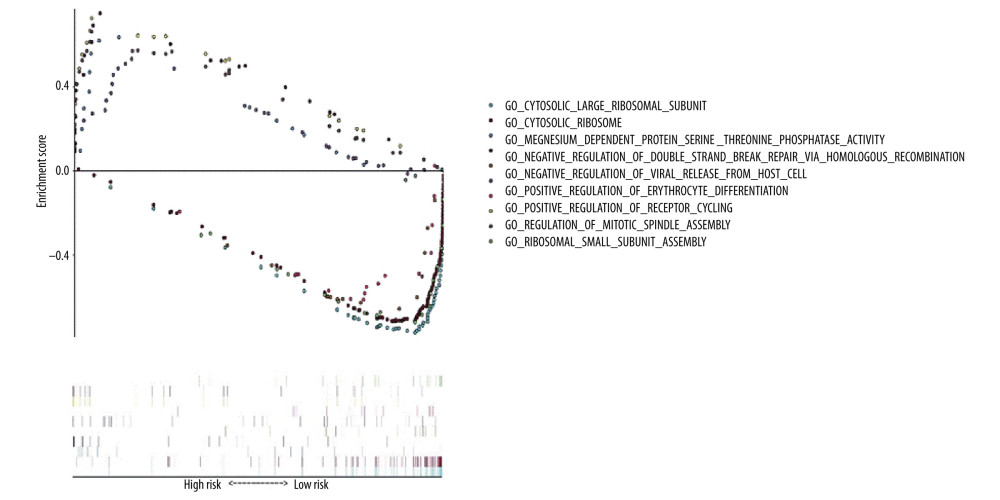 Figure 7. Gene Ontology (GO) functional enrichment analysis of essential prognostic genes of esophageal adenocarcinoma by gene set enrichment analysis (GSEA) was carried out with “c5. all. v7.1. symbols. gmt” as the reference GSEA criteria. The 5 items with the highest enrichment scores were screened out in the high- and low-expression samples.
 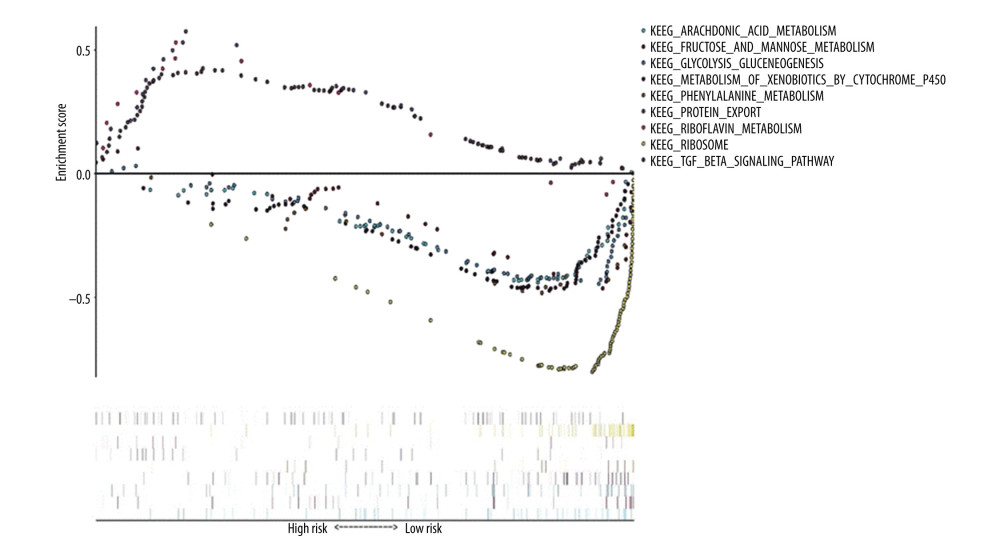 Figure 8. Kyoto Encyclopedia of Genes and Genomes (KEGG) pathway enrichment analysis of essential prognostic genes of esophageal adenocarcinoma by gene set GSEA was carried out with “c2. cp. kegg. v7.1. symbols. gmt” as the reference gene set, and the first 6 items with higher enrichment scores were screened out in the high samples and 3 items in the low expression samples.
 References
1. Alexandre L, Long E, Beales IL, Pathophysiological mechanisms linking obesity and esophageal adenocarcinoma: World J Gastrointest Pathophysiol, 2014; 5(4); 534-49
2. Xie SH, Lagergren J, Time trends in the incidence of oesophageal cancer in Asia: Variations across populations and histological types: Cancer Epidemiol, 2016; 44; 71-76
3. Siegel R, Naishadham D, Jemal A, Cancer statistics, 2012: Cancer J Clin, 2012; 62(1); 10-29
4. Kidane B, Coughlin S, Vogt K, Malthaner R, Preoperative chemotherapy for resectable thoracic esophageal cancer: Cochrane Database Syst Rev, 2015(5); CD001556
5. Fatehi Hassanabad A, Chehade R, Breadner D, Raphael J, Esophageal carcinoma: Towards targeted therapies: Cell Oncol, 2020; 43(2); 195-209
6. Wang Z, Lin L, Thomas DG, The role of Dickkopf-3 overexpression in esophageal adenocarcinoma: J Thorac Cardiovasc Surg, 2015; 150(2); 377-385.e2
7. Woolston CM, Madhusudan S, Soomro IN, Thioredoxin interacting protein and its association with clinical outcome in gastro-oesophageal adenocarcinoma: Redox Biol, 2013; 1(1); 285-91
8. Kojima K, Yamashita K, Ushiku H, The clinical significance of cysteine dioxygenase type 1 methylation in Barrett esophagus adenocarcinoma: Dis Esophagus, 2017; 30(3); 1-9
9. Gotovac JR, Liu DS, Yates MJ, GRB7 is an oncogenic driver and potential therapeutic target in oesophageal adenocarcinoma: J Pathol, 2020; 252(3); 317-29
10. Karsli-Uzunbas G, Guo JY, Price S, Autophagy is required for glucose homeostasis and lung tumor maintenance: Cancer Discov, 2014; 4(8); 914-27
11. Qu X, Yu J, Bhagat G, Promotion of tumorigenesis by heterozygous disruption of the beclin 1 autophagy gene: J Clin Invest, 2003; 112(12); 1809-20
12. Rao S, Tortola L, Perlot T, A dual role for autophagy in a murine model of lung cancer: Nat Commun, 2014; 5(1); 3056
13. Amaravadi R, Kimmelman AC, White E, Recent insights into the function of autophagy in cancer: Genes Dev, 2016; 30(17); 1913-30
14. Levy JMM, Thorburn A, Targeting autophagy during cancer therapy to improve clinical outcomes: Pharmacol Ther, 2011; 131(1); 130-41
15. Levy JMM, Towers CG, Thorburn A, Targeting autophagy in cancer: Nat Rev Cancer, 2017; 17(9); 528-42
16. Towers CG, Thorburn A, Therapeutic targeting of autophagy: EBioMedicine, 2016; 14; 15-23
17. Galluzzi L, Pietrocola F, Levine B, Kroemer G, Metabolic control of autophagy: Cell, 2014; 159(6); 1263-76
18. Tibshirani R, The lasso method for variable selection in the Cox model: Stat Med, 1997; 16(4); 385-95
19. Engebretsen S, Bohlin J, Statistical predictions with glmnet: Clin Epigenetics, 2019; 11(1); 123
20. Simon RM, Subramanian J, Li MC, Menezes S, Using cross-validation to evaluate predictive accuracy of survival risk classifiers based on high-dimensional data: Brief Bioinform, 2011; 12(3); 203-14
21. Cavanaugh JE, Neath AA, The Akaike information criterion: Background, derivation, properties, application, interpretation, and refinements: Wiley Interdiscip Rev Comput Stat, 2019; 11(3); e1460
22. Rhodes DR, Yu J, Shanker K, ONCOMINE: A cancer microarray database and integrated data-mining platform: Neoplasia, 2004; 6(1); 1-6
23. Subramanian A, Kuehn H, Gould J, GSEA-P: A desktop application for gene set enrichment analysis: Bioinformatics, 2007; 23(23); 3251-53
24. Secrier M, Li X, de Silva N, Mutational signatures in esophageal adenocarcinoma define etiologically distinct subgroups with therapeutic relevance: Nat Genet, 2016; 48(10); 1131-41
25. Saxena R, Klochkova A, Murray MG, Roles for autophagy in esophageal carcinogenesis: Implications for improving patient outcomes: Cancers, 2019; 11(11); 1697
26. Singh P, Ravanan P, Talwar P, Death associated protein kinase 1 (DAPK1): A regulator of apoptosis and autophagy: Front Mol Neurosci, 2016; 9; 46
27. Fei B, Ji F, Chen X, Expression and clinical significance of Beclin-1 in gastric cancer tissues of various clinical stages: Oncol Lett, 2016; 11(3); 2271-77
28. Wirawan E, Lippens S, Vanden Berghe T, Beclin1: A role in membrane dynamics and beyond: Autophagy, 2012; 8(1); 6-17
29. Weh KM, Howell AB, Kresty LA, Expression, modulation, and clinical correlates of the autophagy protein Beclin-1 in esophageal adenocarcinoma: Mol Carcinog, 2016; 55(11); 1876-85
30. Ge J, Chen Z, Huang J, Upregulation of autophagy-related gene-5 (ATG-5) is associated with chemoresistance in human gastric cancer: PLoS One, 2014; 9(10); e110293
31. Yang PW, Hsieh MS, Chang YH, Genetic polymorphisms of ATG5 predict survival and recurrence in patients with early-stage esophageal squamous cell carcinoma: Oncotarget, 2017; 8(53); 91494-504
32. Zheng K, Li Y, Wang S, Inhibition of autophagosome-lysosome fusion by ginsenoside Ro via the ESR2-NCF1-ROS pathway sensitizes esophageal cancer cells to 5-fluorouracil-induced cell death via the CHEK1-mediated DNA damage checkpoint: Autophagy, 2016; 12(9); 1593-613
33. Yang J, He Y, Zhai N, MicroRNA-181 a inhibits autophagy by targeting Atg 5 in hepatocellular carcinoma: Front Biosci, 2018; 23; 388-96
34. Aoyagi K, Ohara-Imaizumi M, Itakura M, VAMP7 regulates autophagy to maintain mitochondrial homeostasis and to control insulin secretion in pancreatic β-cells: Diabetes, 2016; 65(6); 1648-59
35. Steffen A, Le Dez G, Poincloux R, MT1-MMP-Dependent invasion is regulated by TI-VAMP/VAMP7: Curr Biol, 2008; 18(12); 926-31
Figures
Figure 1. Univariate Cox proportional hazards regression analysis of 14 prognostic genes in patients with esophageal adenocarcinoma. The red and green squares represent the hazards ratio (HR) and the short transverse lines represent the 95% confidence interval. P<0.05.Figure 2. (A) Genes screened by lasso regression analysis. The lasso regression model and cross validation method were used to screen genes. When the number of variables was 13, the partial likelihood deviation is the minimum, corresponding to the minimum λ value. (B) Cross validation results. The regression coefficient map of genes in the lasso model. Dotted vertical lines were drawn at the optimal values by using the minimum criteria and the 1 standard error (SE) of the minimum criteria (the 1-SE criteria).Figure 3. Multivariate Cox proportional hazards regression analysis of 8 prognostic genes in patients with esophageal adenocarcinoma. The red and green squares represent the hazards ratios and the short transverse lines represent 95% confidence intervals. P<0.05.Figure 4. Prognostic risk assessment model for patients with esophageal adenocarcinoma (EAC). (A) From top to bottom are the risk scores and patients’ survival status distribution. The green dots in the figure represent the surviving patients, and the red dots represent the dead patients. The dotted line represents the median value of the risk score. The dotted line’s left side represents the low-risk score group, and the right side of the dotted line represents the high-risk score group. With the increase of patients’ risk score, the number of red dots increased gradually, and the number of dead patients increased. It shows that the patients with esophageal adenocarcinoma in the high-risk group have lower survival and a higher risk of death. (B) Kaplan-Meier curves for low- and high-risk groups. (C) Receiver operating characteristic (ROC) curve for predicting survival in EAC patients by the risk score. AUC – area under the curve.Figure 5. Survival analysis of genes associated with prognosis in patients with esophageal adenocarcinoma, Kaplan-Meier survival curves of 4 critical genes were selected with P<0.05 as the screening criteria. The red plots represent high expression and the blue plots represent median/low expression.Figure 6. Expression analysis of esophageal adenocarcinoma (EAC) adverse prognostic factors based on the Oncomine database. (A) ATG5 and (B) BECN1 expression levels in EAC. The intensity of gene expression is indexed with the color bar, and the median rank is used to demonstrate the gene rank in each analysis.Figure 7. Gene Ontology (GO) functional enrichment analysis of essential prognostic genes of esophageal adenocarcinoma by gene set enrichment analysis (GSEA) was carried out with “c5. all. v7.1. symbols. gmt” as the reference GSEA criteria. The 5 items with the highest enrichment scores were screened out in the high- and low-expression samples.Figure 8. Kyoto Encyclopedia of Genes and Genomes (KEGG) pathway enrichment analysis of essential prognostic genes of esophageal adenocarcinoma by gene set GSEA was carried out with “c2. cp. kegg. v7.1. symbols. gmt” as the reference gene set, and the first 6 items with higher enrichment scores were screened out in the high samples and 3 items in the low expression samples. Tables
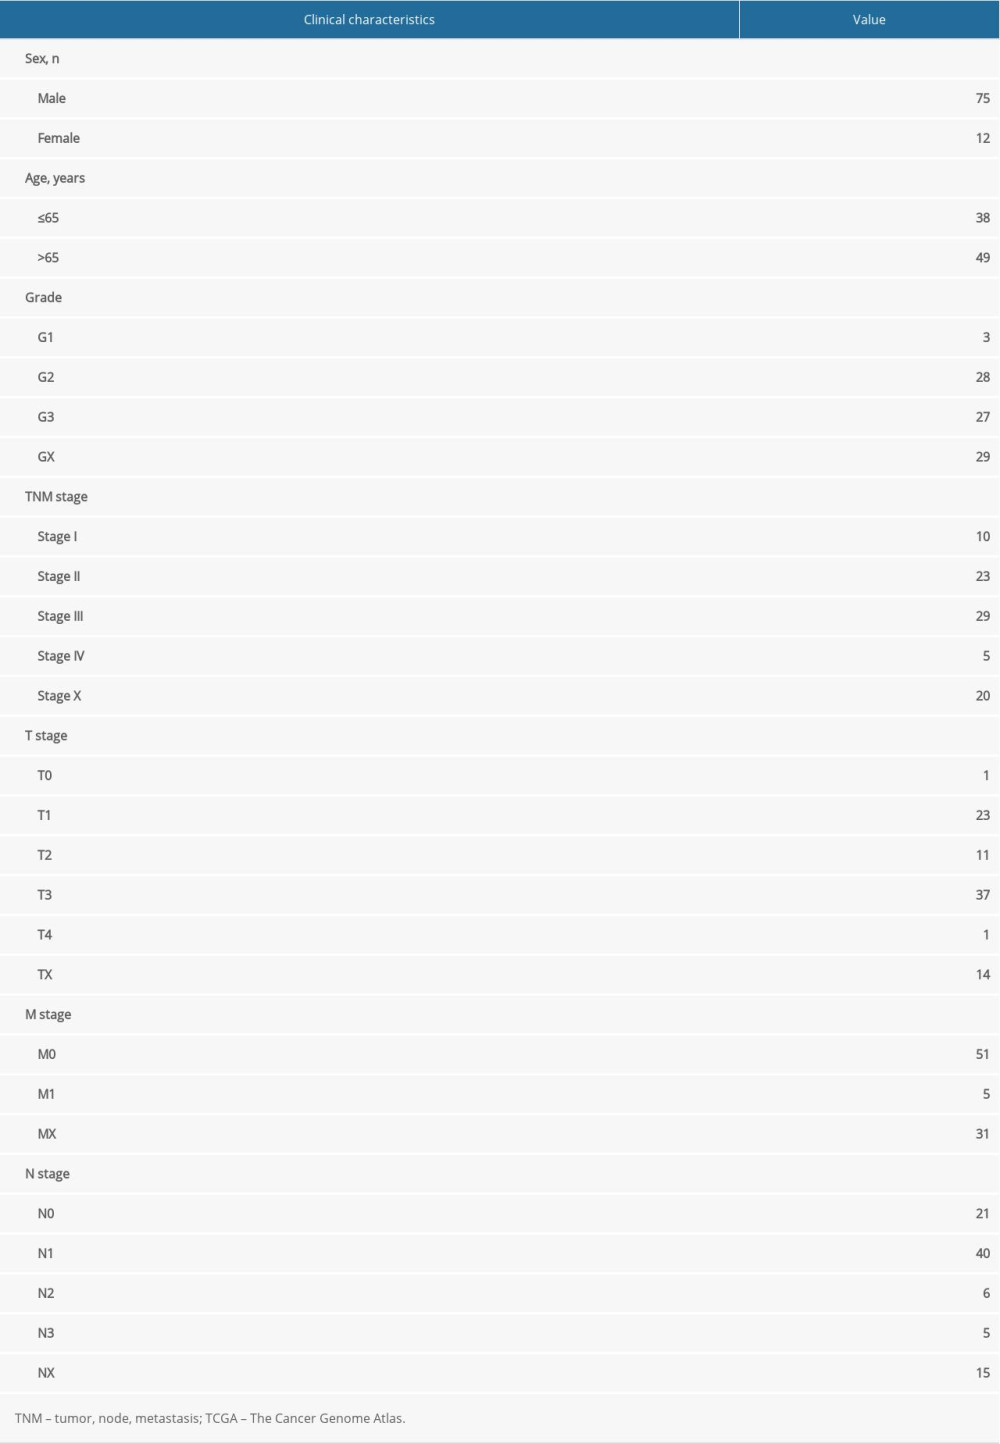 Table 1. Clinical baseline data for esophageal adenocarcinoma from The Cancer Genome Atlas database.
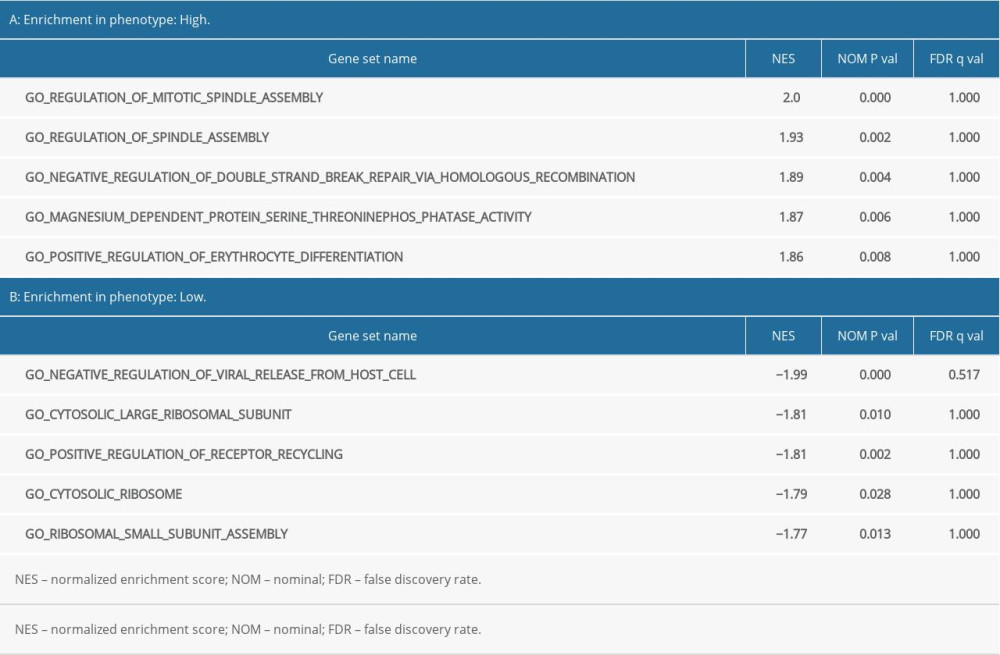 Table 2. Results of Gene Ontology (GO) enrichment analyses.
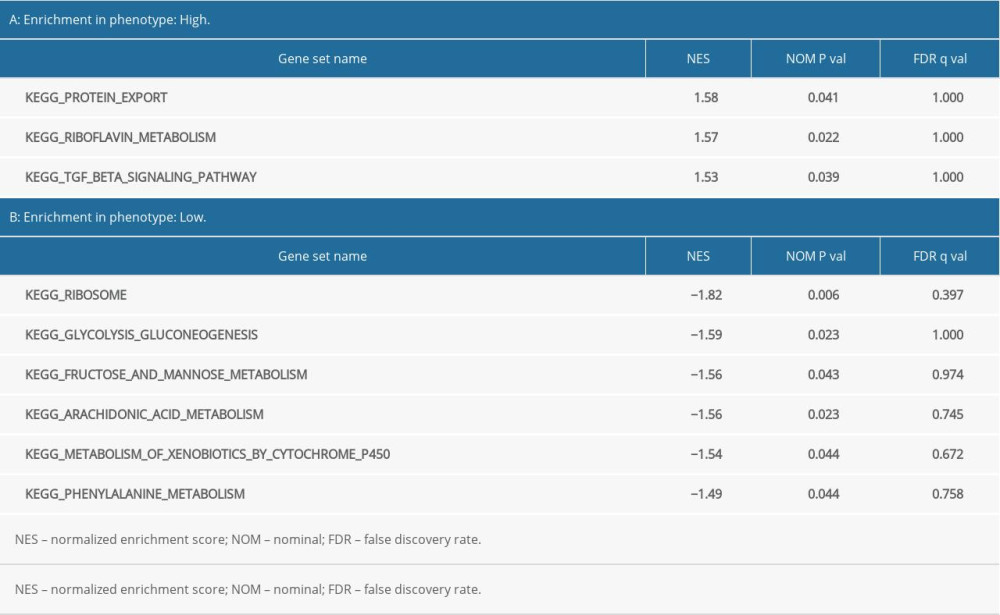 Table 3. Results of Kyoto Encyclopedia of Genes and Genomes (KEGG) enrichment analyses.Table 1. Clinical baseline data for esophageal adenocarcinoma from The Cancer Genome Atlas database.Table 2. Results of Gene Ontology (GO) enrichment analyses.Table 3. Results of Kyoto Encyclopedia of Genes and Genomes (KEGG) enrichment analyses.
 In Press
Clinical Research
Body Weight and Insulin Resistance Indicators Among ChildrenMed Sci Monit In Press; DOI: 10.12659/MSM.951434
Clinical Research
Comparison of Radiographic Cervical Sagittal Alignment Parameters in Patients With Nonspecific Neck Pain, D...Med Sci Monit In Press; DOI: 10.12659/MSM.952950
Clinical Research
Combined Fibrinogen and Urinary α1-Microglobulin as Predictors of Respiratory Tract Infection in Children w...Med Sci Monit In Press; DOI: 10.12659/MSM.951066
Database Analysis
Evaluation of Salivary Total Oxidant Status (TOS) and Total Antioxidant Status (TAS) in Orthodontic Patient...Med Sci Monit In Press; DOI: 10.12659/MSM.952052
Most Viewed Current Articles
17 Jan 2024 : Review article 14,175,576
Vaccination Guidelines for Pregnant Women: Addressing COVID-19 and the Omicron VariantDOI :10.12659/MSM.942799
Med Sci Monit 2024; 30:e942799
13 Nov 2021 : Clinical Research 3,756,620
Acceptance of COVID-19 Vaccination and Its Associated Factors Among Cancer Patients Attending the Oncology ...DOI :10.12659/MSM.932788
Med Sci Monit 2021; 27:e932788
14 Dec 2022 : Clinical Research 2,465,966
Prevalence and Variability of Allergen-Specific Immunoglobulin E in Patients with Elevated Tryptase LevelsDOI :10.12659/MSM.937990
Med Sci Monit 2022; 28:e937990
16 May 2023 : Clinical Research 708,651
Electrophysiological Testing for an Auditory Processing Disorder and Reading Performance in 54 School Stude...DOI :10.12659/MSM.940387
Med Sci Monit 2023; 29:e940387