16 February 2021 : Animal Research
Effects of Diabetes Mellitus on Sperm Quality in the Db/Db Mouse Model and the Role of the FoxO1 Pathway
Jisheng Wang12ABDE, Binghao Bao12ABE, Junlong Feng12ABCE, Qi Zhao12BCF, Hengheng Dai12BDF, Fanchao Meng12BF, Sheng Deng12DF, Bin Wang2AG*, Haisong Li2AEDOI: 10.12659/MSM.928232
Med Sci Monit 2021; 27:e928232


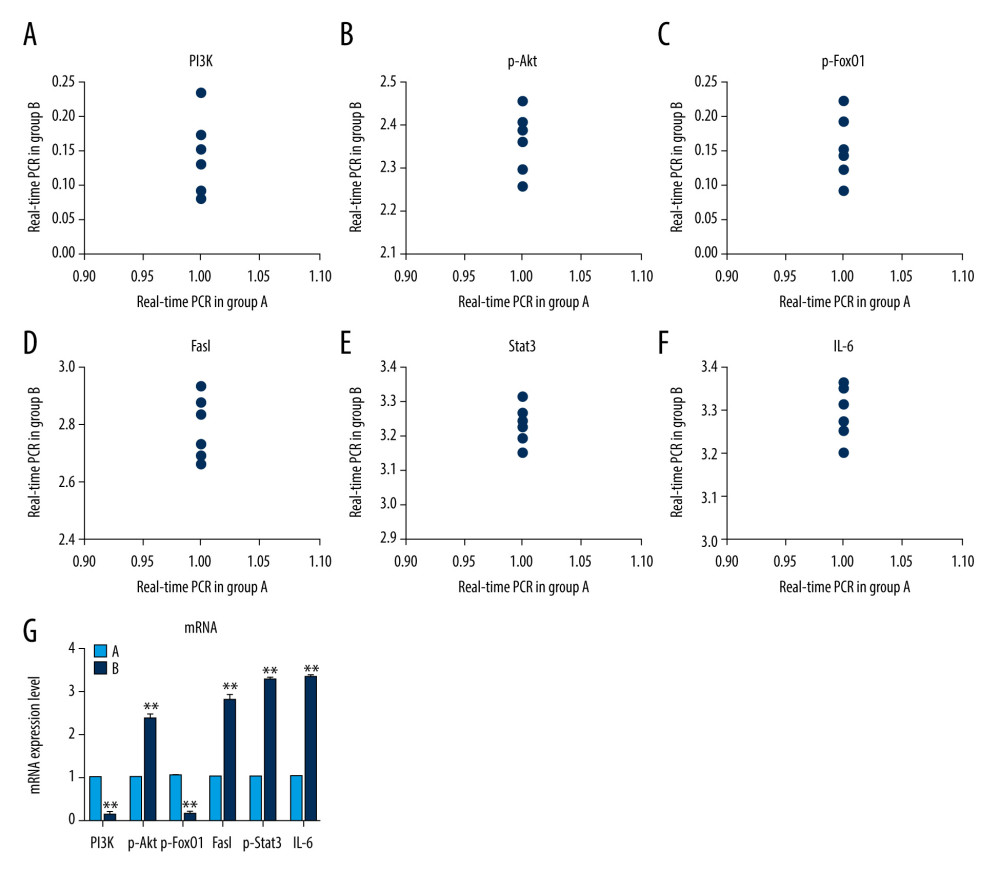
Figure 7 Scatter plot of mRNA expression of (A) PI3K, (B) p-Akt, (C) p-FoxO1, (D) FasL, (E) p-Stat3, and (F) IL-6 protein in the 2 groups of mice: group A (control) and group B (diabetic). (G) Expression of the mRNA of PI3K, p-Akt, p-FoxO1, FasL, p-Stat3, and IL-6 in mice testes. The light blue bar graph represents expression of the mRNA of PI3K, p-Akt, p-FoxO1, FasL, p-Stat3, and IL-6 in group A. The deep blue bar chart represents expression of the mRNA of PI3K, p-Akt, p-FoxO1, FasL, p-Stat3, and IL-6 in group B. Values are the mean±SEM (n=6 animals per group). The t test was used to compare group B with group A. * P<0.05, ** P<0.01.