18 December 2020 : Database Analysis
Functional Analysis of Estrogen Receptor 1 in Diabetic Wound Healing: A Knockdown Cell-Based and Bioinformatic Study
Sha Qi1ABC, Qiong Han1BC, Danmou Xing1D, Long Qian1CE, Xiang Yu1E, Dong Ren1F, Huan Wang1E, Quan Chen1ABFG*DOI: 10.12659/MSM.928788
Med Sci Monit 2020; 26:e928788


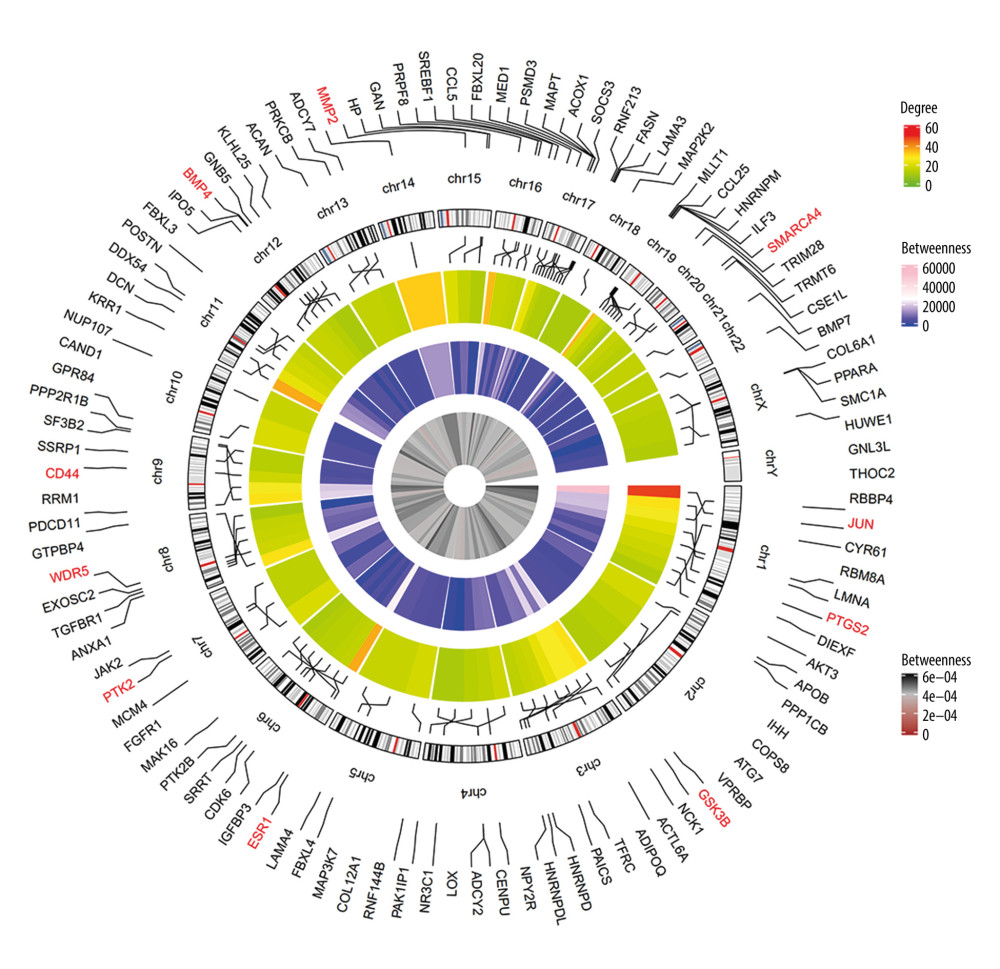
Figure 7 Circular visualization of chromosomal positions and connectivity of the top 100 genes in the protein–protein interaction (PPI) network. The names of the genes are shown in the outer circle. Different colors show different values of degree, betweenness, and closeness. The outer circle represents chromosomes; lines coming from each gene point to their specific chromosomal locations. The 10 hub genes are shown in red.