13 January 2022 : Database Analysis
Comprehensive Analysis of Tripterine Anti-Ovarian Cancer Effects Using Weighted Gene Co-Expression Network Analysis and Molecular Docking
Xi Long1A, Leping Liu12E, Qinyu Zhao3C, Xinyi Xu1B, Pingan Liu4D, Guoming Zhang1G, Jie Lin4F*DOI: 10.12659/MSM.932139
Med Sci Monit 2022; 28:e932139


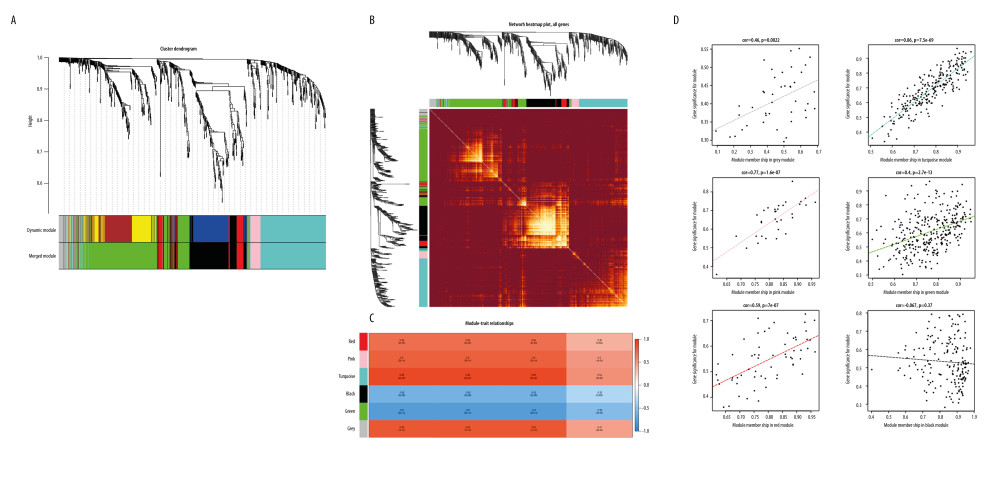
Figure 3 (A) Gene-clustering dendrogram. Each end of the clustering dendrogram corresponds to a gene, and different colors correspond to the different modules in which genes are clustered, and some modules which need to be merged are highly similar. (B) Topological-overlap matrix graph, each row and column represents a module and the genes of the module. This diagram shows the degree of correlation within the module. (C) Module-trait relationship. Each row corresponds to a module, and each column corresponds to a clinical trait. Each cell contains a corresponding correlation. (D) Module membership in each module.