03 December 2021 : Clinical Research
Impact of H-Type Hypertension on Pericarotid Adipose Tissue and Plaque Characteristics Based on Computed Tomography (CT) Angiography: A Propensity Score Matching Study
Ying Liu1ABEF, Lun Xu2ACD, Yan Gu1ADG*, Yonggang Zhang1DF, Chongchang Miao1BDDOI: 10.12659/MSM.933351
Med Sci Monit 2021; 27:e933351


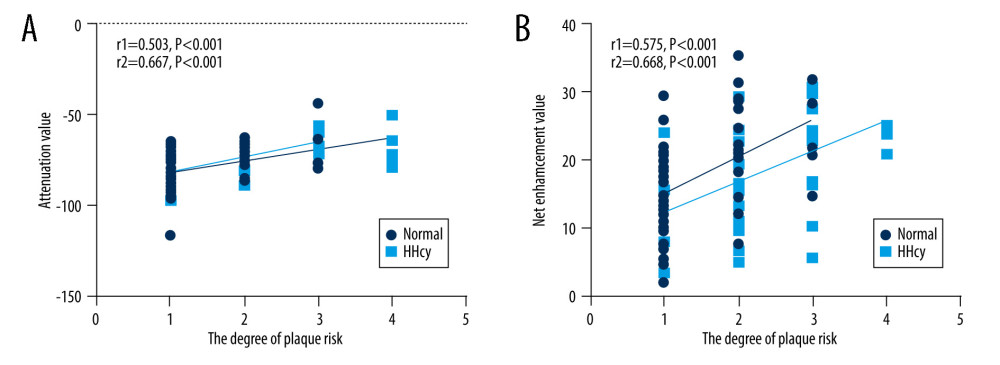
Figure 4 (A) Spearman correlation analysis was performed on the attenuation value of peripheral carotid fat and plaque risk classification. The gray dots represent the normal Hcy group (r1=0.503, P<0.001), and the blue dots represent the HHcy group (r2=0.667, P<0.001). (B) Spearman correlation analysis was performed on the net enhancement value of PCAT and plaque risk classification. The gray dots represent the normal Hcy group (r1=0.575, P<0.001), and the blue dots represent the HHcy group (r2=0.668, P<0.001).