15 February 2022: Database Analysis
A Bioinformatics Study of Differentially Expressed Genes in Microarrays of Dorsal Root Ganglia from Rat Models of Neuropathic Pain
Yongle Wu 1BCDEF , Hai Nie 2ADF*DOI: 10.12659/MSM.934122
Med Sci Monit 2022; 28:e934122

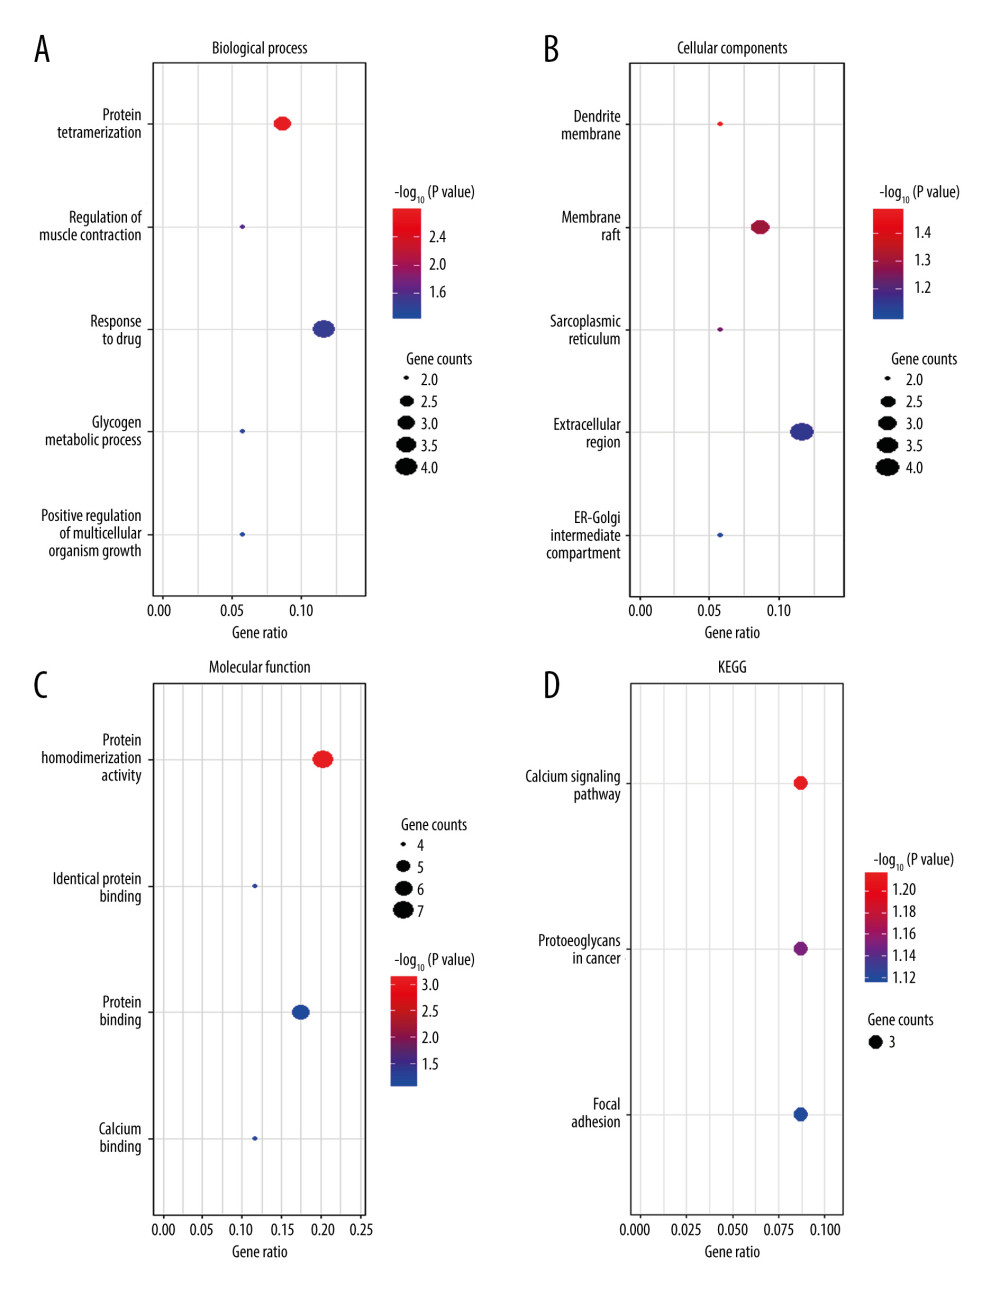
Figure 3 Functional enrichment analysis of common differentially expressed genes (DEGs) between GSE2884 and GSE24982 at the late stage after spinal nerve ligation. (A) Biological process enriched in Gene Ontology (GO) analyses. (B) Cellular components enriched in GO analyses. (C) Molecular function enriched in GO analyses. (D) Enriched Kyoto Encyclopedia of Genes and Genomes (KEGG) pathways. The bubble charts were created by using R software with ggplot2. The dot size represents the number of enriched DEGs. The dot color represents −log10 (P value).


