15 February 2022: Database Analysis
A Bioinformatics Study of Differentially Expressed Genes in Microarrays of Dorsal Root Ganglia from Rat Models of Neuropathic Pain
Yongle Wu1BCDEF, Hai Nie2ADF*DOI: 10.12659/MSM.934122
Med Sci Monit 2022; 28:e934122


Abstract
BACKGROUND: Neuropathic pain is a significant complication of nerve injury. This study aimed to conduct bioinformatics analysis of differentially expressed genes (DEGs) in microarrays of dorsal root ganglia (DRG) from rat models of neuropathic pain, based on 4 GEO datasets: GSE15041, GSE38038, GSE2884, and GSE24982.
MATERIAL AND METHODS: We retrieved the 4 microarray datasets, which were generated using DRG samples collected in the early and late stages after spinal nerve ligation in rats. The common DEGs (co-DEGs) were identified and then subjected to Gene Ontology, pathway enrichment, and Protein–protein interaction network analyses. Drugs targeting the identified hub genes were analyzed using the Drug Gene Interaction Database.
RESULTS: We identified 75 early-stage co-DEGs, which were enriched in chromosome segregation and protein catabolic processes, cytosol and extracellular exosome components, and ATP binding function and metabolic pathways. We identified 29 late-stage co-DEGs, which were enriched in protein tetramerization and drug responses, extracellular and membrane raft components, and protein homodimerization and binding functions and calcium signaling pathways. We also identified several hub genes, including Snap25 (synaptosome-associated protein of 25 kDa), Vamp2 (vesicle associated membrane protein 2), and Sf3b1 (splicing factor 3b subunit 1), the first 2 of which can be targeted by botulinum toxin derivatives. SNAP25 plays a role in synaptogenesis and the exocytotic release of neurotransmitters, and VAMP2 participates in neurotransmitter release at a step between docking and fusion.
CONCLUSIONS: The present study reveals new mechanisms of neuropathic pain and provides key genes, including SNAP25 and VAMP2, for future studies.
Keywords: acute pain, Computational Biology, Microarray Analysis, Snap25 Protein, Mouse, Spinal Nerve Roots, Animals, Disease Models, Animal, Ganglia, Spinal, gene ontology, Neuralgia, Protein Interaction Maps, Rats
Background
Neuropathic pain is a complex clinical condition caused by lesions or diseases in the somatosensory nervous system [1]. Peripheral nerve injury is frequently complicated by neuropathic pain, which causes distress and significantly decreases the quality of life in patients [2]. There are limited treatments available for neuropathic pain. This type of chronic pain is usually poorly controlled, and the treatment is unsatisfactory in patients with peripheral neuropathy [1,2].
The precise molecular mechanisms for the development of neuropathic pain are still unclear. Cell bodies of the primary sensory nerves are located in the dorsal root ganglia (DRG) that transmit the noxious stimuli to the brain. It is well documented that the DRG are implicated in the development of neuropathic pain [3,4]. Following peripheral nerve injury, the DRG undergo dramatic cellular and molecular changes [1]. The spinal nerve ligation (SNL) rat model has been widely used to investigate the molecular mechanisms and therapeutic targets of neuropathic pain [5]. SNL results in significant behavioral signs, including mechanical, heat, and cold hypersensitivity. In addition to behavioral changes, SNL induces pro-inflammatory responses and ion channel alterations in DRG [1]. In recent years, high-throughput next-generation sequencing and transcriptome microarrays have been used to screen differentially expressed genes (DEGs) in the DRG of the SNL rat model [6–8]. These studies were performed in different laboratories, and the DRG samples were collected at various time points after SNL. Therefore, it is challenging to compare and summarize the results of these studies and to make a clear conclusion.
This study aimed to undertake bioinformatics analysis of DEGs in microarrays of DRG from the SNL and sham rat models of neuropathic pain, based on 4 Gene Expression Omnibus (GEO) datasets, GSE15041, GSE38038, GSE2884, and GSE24982. There were 2 recently published bioinformatics analyses of DEGs in microarrays of DRG using other types of animal models of neuropathic pain, including spared nerve injury and spinal nerve transection [9,10]. The present study may improve the understanding of molecular mechanisms in the development of neuropathic pain after peripheral nerve injury.
Material and Methods
DATA COLLECTION:
The microarray datasets GSE15041, GSE38038, GSE2884, and GSE24982 were downloaded from the GEO database (http://www.ncbi.nlm.nih.gov/geo/) [6–8]. The investigators collected the DRG samples on day 7 for GSE15041 and GSE38038 and on day 28 for GSE2884 and GSE24982 datasets. These datasets were generated by performing transcriptome microarray assays in the DRG collected from adult rats that underwent a L4/L5 SNL or a sham operation without ligation. In total, 7 biological repeats in the sham group and 7 in the SNL group were performed on day 7 following the procedure, while 7 biological repeats in the sham group and 9 in the SNL group were performed on day 28. The platforms that were used for gene expression arrays were Affymetrix rat genome 230 2.0 array, Affymetrix rat genome U34 array, and Rosetta/Merck rat 25k v1.2 microarray. Ethics approval was waived for bioinformatic analyses of published datasets.
DATA PROCESSING:
DEGs between SNL and sham DRG specimens were identified via GEO2R online tools (
FUNCTIONAL AND PATHWAY ENRICHMENT ANALYSES:
We performed Gene Ontology (GO) functional enrichment analyses, which includes the biological process (BP), molecular function (MF), and cellular component (CC). The enrichment analyses were performed for the co-DEGs between GSE15041 and GSE38038 for day 7 and the co-DEGs between GSE2884 and GSE24982 for day 28 by using the online bioinformatic tool, the Database for Annotation, Visualization, and Integrated Discovery (DAVID,
PROTEIN–PROTEIN INTERACTION ANALYSES:
We performed Protein–protein interaction (PPI) network analyses of co-DEGs for either day 7 or day 28 by using STRING database of functional protein association networks (
TARGETED DRUG PREDICTION:
The hub genes identified by CytoHubba were submitted to the drug gene interaction database (DGIdb database,
Results
IDENTIFICATION OF DEGS:
For the DRG collected on day 7 after SNL, we identified 1207 DEGs from GSE15041, 1959 DEGs from GSE38038, and 75 co-DEGs between GSE15041 and GSE38038. For the DRG collected on day 28 after SNL, we identified 151 DEGs from GSE2884, 1098 DEGs from GSE24982, and 29 co-DEGs between GSE2884 and GSE24982. There was no co-DEG between the DRG collected on day 7 and day 28, suggesting that the molecular mechanisms of neuropathic pain are different between the early and late stages. The results are displayed in a Venn diagram (Figure 1).
FUNCTIONAL ENRICHMENT:
GO enrichment and KEGG analyses of the co-DEGs for days 7 and 28 were performed using DAVID. For the DRG collected on day 7, the enriched biological processes in GO analyses were ubiquitin-dependent protein catabolic process and chromosome segregation (Figure 2A); the enriched cellular components were cytosol and extracellular exosome (Figure 2B); the enriched molecular functions were ATP binding and GTPase activity (Figure 2C); and the enriched KEGG pathways were adherens junction and metabolic pathways (Figure 2D). For the DRG collected on day 28, the enriched biological processes in GO analyses were protein tetramerization and response to drug (Figure 3A); the enriched cellular components were membrane raft and extracellular region (Figure 3B); the molecular functions were protein homodimerization activity and protein binding (Figure 3C); and the enriched KEGG pathways were calcium signaling pathway, proteoglycans, and focal adhesion (Figure 3D).
PPI NETWORK ENRICHMENT:
PPI networks for the DRG collected on day 7 and day 28 after SNL are displayed in Figures 4A and 5A, respectively. The constructed PPI networks were further analyzed by using the MCODE plugin in Cytoscape. For the DRG collected on day 7, the first cluster was enriched in synaptic vesicle trafficking and exocytosis (Figure 4B) and the second cluster was enriched in interleukin-1- and tumor necrosis factor-involved inflammation (Figure 4C). For the DRG collected on day 28, the first cluster was enriched in mRNA splicing (Figure 5B) and the second cluster was enriched in intracellular calcium handling (Figure 5C). Hub genes in the constructed PPI networks were identified by using the CytoHubba plugin in Cytoscape. The hub genes for the DRG collected on day 7 included Snap25, Vamp2, Cplx1, Stx5, Stxbp1, Gosr2, Bet1, Gosr1, Napa, and Stx1a (Figure 4D), which primarily regulate synaptic vesicle trafficking and exocytosis. For the DRG collected on day 28, the hub genes included Sf3b1, Cd2bp2, Lsm4, Sart1, Prpf8, Prpf31, Prpf6, Lsm7, Eftud2, and Sf3b2 (Figure 5D), which primarily regulate mRNA splicing.
TARGETED DRUG PREDICTION:
Potential drugs targeting the hub genes were predicted by using the DGIdb database. Regarding the hub genes for the DRG collected on day 7, six drugs targeting SNAP25 (synaptosome-associated protein of 25 kDa) and VAMP2 (vesicle associated membrane protein 2) were predicted, namely diazoxide, abobotulinumtoxinA, incobotulinumtoxinA, botulinum toxin type A purified neurotoxin complex, botulinum toxin type B, and phorbol myristate acetate (Figure 6A). For the hub genes for the DRG collected on day 28, only Chembl1221944 targeting SF3B1 (splicing factor 3b subunit 1) was predicted (Figure 6B). AbobotulinumtoxinA and incobotulinumtoxinA have been used in clinical practice to treat neck pain due to neck muscle spasm. Diazoxide is a well-known oral medication that is used to treat hyperinsulinism and hypoglycemia but has never been used for pain management.
Discussion
In the present study, we performed comprehensive bioinformatic analyses of 4 transcriptome array datasets that were generated by 4 independent research groups. The datasets compared mRNA expression profiles in the DRG from rats with and without SNL in the early and late stages. We found that there were no common DEGs between the early and late stages. The co-DEGs in the early stage were mainly enriched in synaptic vesicle trafficking and exocytosis and pro-inflammatory responses, while the co-DEGs in the late stage were primarily enriched in intracellular calcium handling and insulin-like growth factor signaling pathways.
Mechanisms for the development and progression of neuropathic pain are not fully understood, which can partly lead to the poor management of patients with neuropathic pain. High-throughput transcriptome array is a promising strategy for screening key genes and pathways involved in the development of neuropathic pain. To reduce the between-laboratory biases, we combined 2 distinct microarray datasets at each time point for bioinformatic analyses. An unpredicted finding was that there were no common DEGs in the DRG between the early (day 7) and late (day 28) stages. This finding suggests that neuropathic pain in the early and late stages has distinct molecular mechanisms. Therefore, further mechanism and functional studies for neuropathic pain in the early and late stages should be performed separately.
In the early stage, co-DEGs of the DRG were majorly enriched in chromosome segregation and protein catabolic processes, cytosol and extracellular exosome components, ATP binding function, and metabolic pathways. These findings suggest that the DRG in the early stage after peripheral nerve injury mainly underwent a metabolically active cellular process. These co-DEGs formed 3 major clusters, including synaptic vesicle trafficking and exocytosis, interleukin-1- and tumor necrosis factor-involved inflammation, and cell autophagy.
In the late stage, co-DEGs of the DRG were majorly enriched in protein tetramerization and drug response processes, extracellular and membrane raft components, protein homodimerization and binding functions, and calcium signaling and focal adhesion pathways. These co-DEGs formed 3 major clusters, including mRNA splicing, intracellular calcium handling, and insulin-like growth factor signaling pathways.
All 4 datasets we analyzed in the present study were generated from the SNL rat model of neuropathic pain. There are several different animal models used to explore the molecular mechanisms of neuropathic pain [24,25]. Two recent bioinformatics analyses were performed in microarrays of DRG from neuropathic pain animal models of spared nerve injury and spinal nerve transection, and their identified DEGs are different from those in the present study [9,10]. This inconsistency suggests that different animal models of neuropathic pain may have distinct molecular mechanisms.
One of the limitations of the present study is that only 2 datasets are available for each time point after SNL. The numbers of common DEGs among the microarrays are relatively small, indicating that variations in these datasets might be significant. Future studies involving more datasets may help solve this issue. The microarrays we analyzed in the present study were generated using whole DRG tissue, which contains not only primary sensory neurons but also other types of cells, such as satellite glial cells, vascular cells, and other mesenchymal cells. Therefore, it is not clear which change in which type of cells contributed to the identified DEGs. Future microarrays may need to be performed in purified sensory neurons. Another limitation is that the identified targets were not validated by experiments in the present study because of a funding issue. Validation should be carried out in vitro and in vivo.
Conclusions
In conclusion, the present study deepens our understanding of the molecular mechanism of neuropathic pain. The present study identifies several key genes, including
Figures
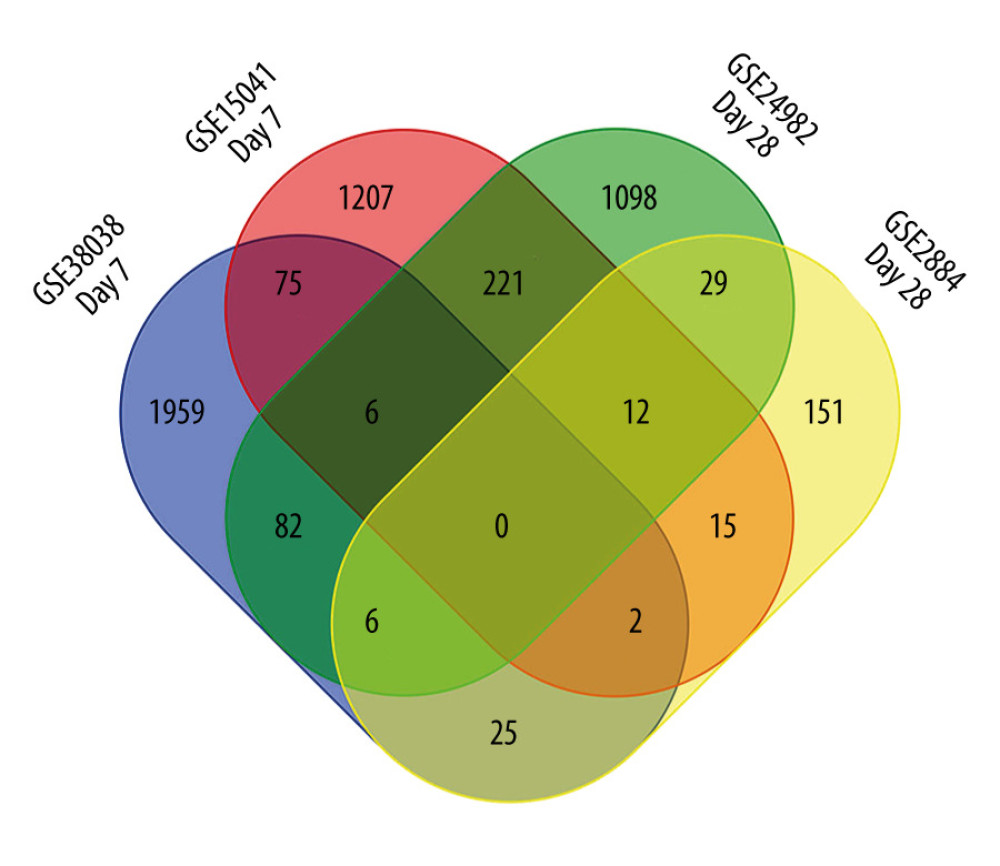 Figure 1. Venn diagram of common differentially expressed genes (DEGs). Intersections were analyzed among DEGs in GSE15041, GSE38038, GSE2884, and GSE24982 microarray datasets. The diagram was created by using a Venn diagram maker from the Van de Peer Lab. GSE15041 and GSE38038 were based on dorsal root ganglia collected on day 7 after spinal nerve ligation, while GSE2884 and GSE24982 were based on dorsal root ganglia collected on day 28.
 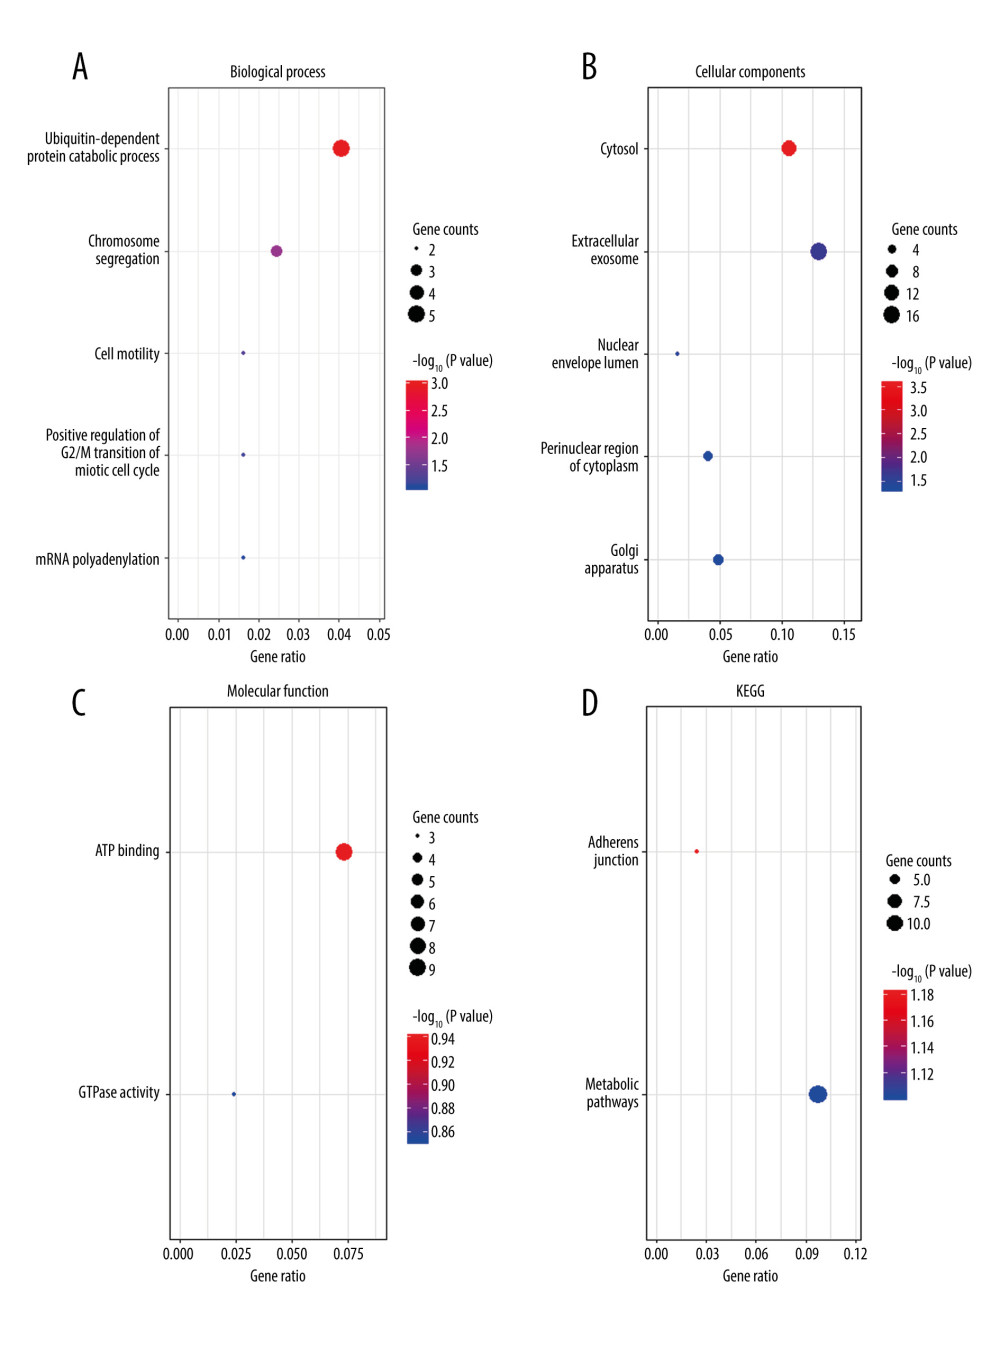 Figure 2. Functional enrichment analysis of common differentially expressed genes (DEGs) between GSE15041and GSE38038 at the early stage after spinal nerve ligation. (A) Biological process enriched in Gene Ontology (GO) analyses. (B) Cellular components enriched in GO analyses. (C) Molecular function enriched in GO analyses. (D) Enriched Kyoto Encyclopedia of Genes and Genomes (KEGG) pathways. The bubble charts were created by using R software with ggplot2. The dot size represents the number of enriched DEGs. The dot color represents −log10 (P value).
 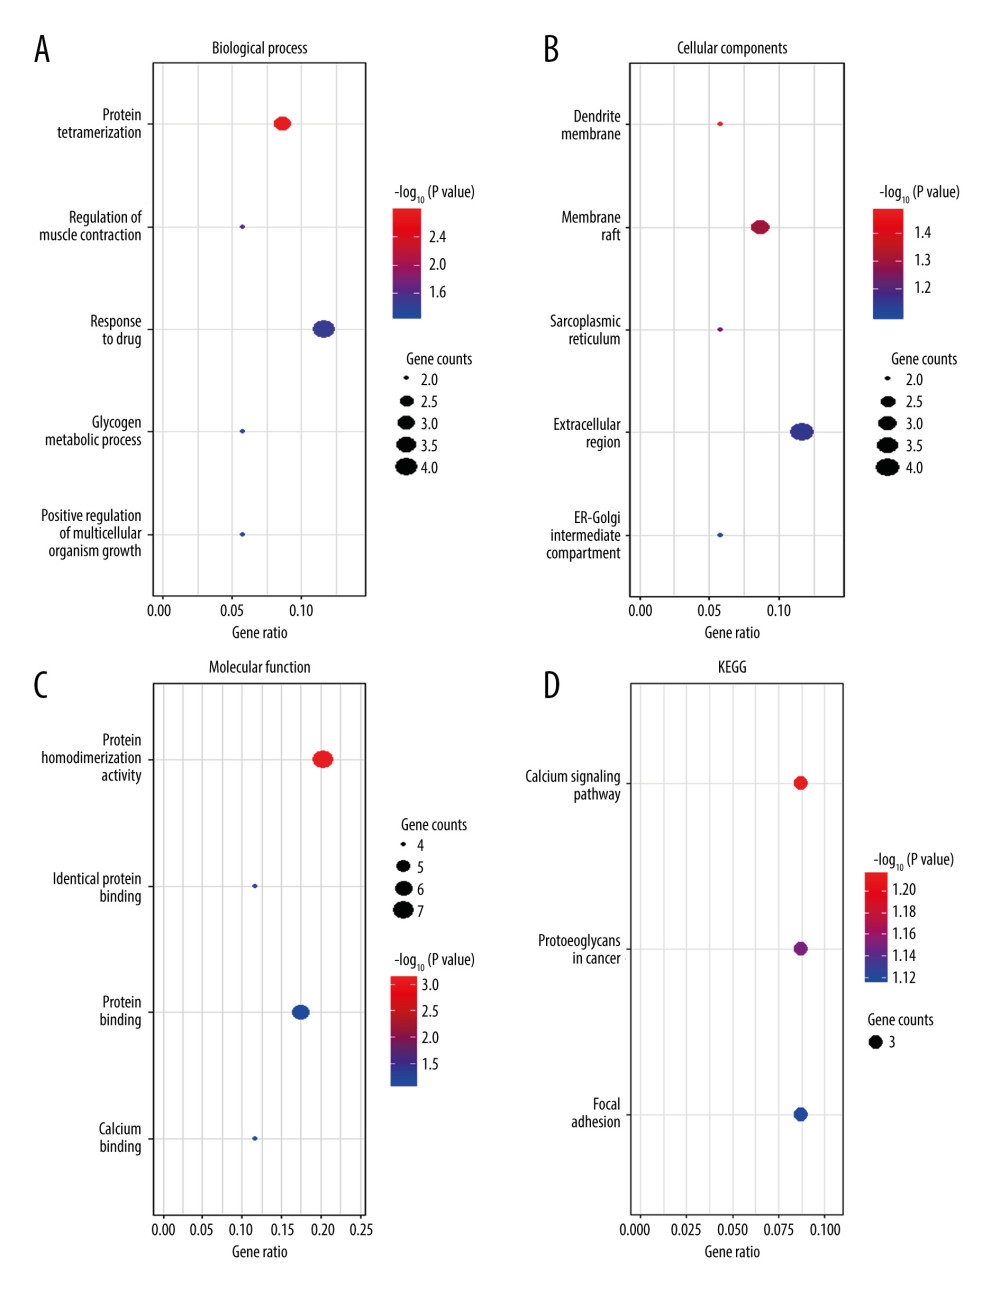 Figure 3. Functional enrichment analysis of common differentially expressed genes (DEGs) between GSE2884 and GSE24982 at the late stage after spinal nerve ligation. (A) Biological process enriched in Gene Ontology (GO) analyses. (B) Cellular components enriched in GO analyses. (C) Molecular function enriched in GO analyses. (D) Enriched Kyoto Encyclopedia of Genes and Genomes (KEGG) pathways. The bubble charts were created by using R software with ggplot2. The dot size represents the number of enriched DEGs. The dot color represents −log10 (P value).
 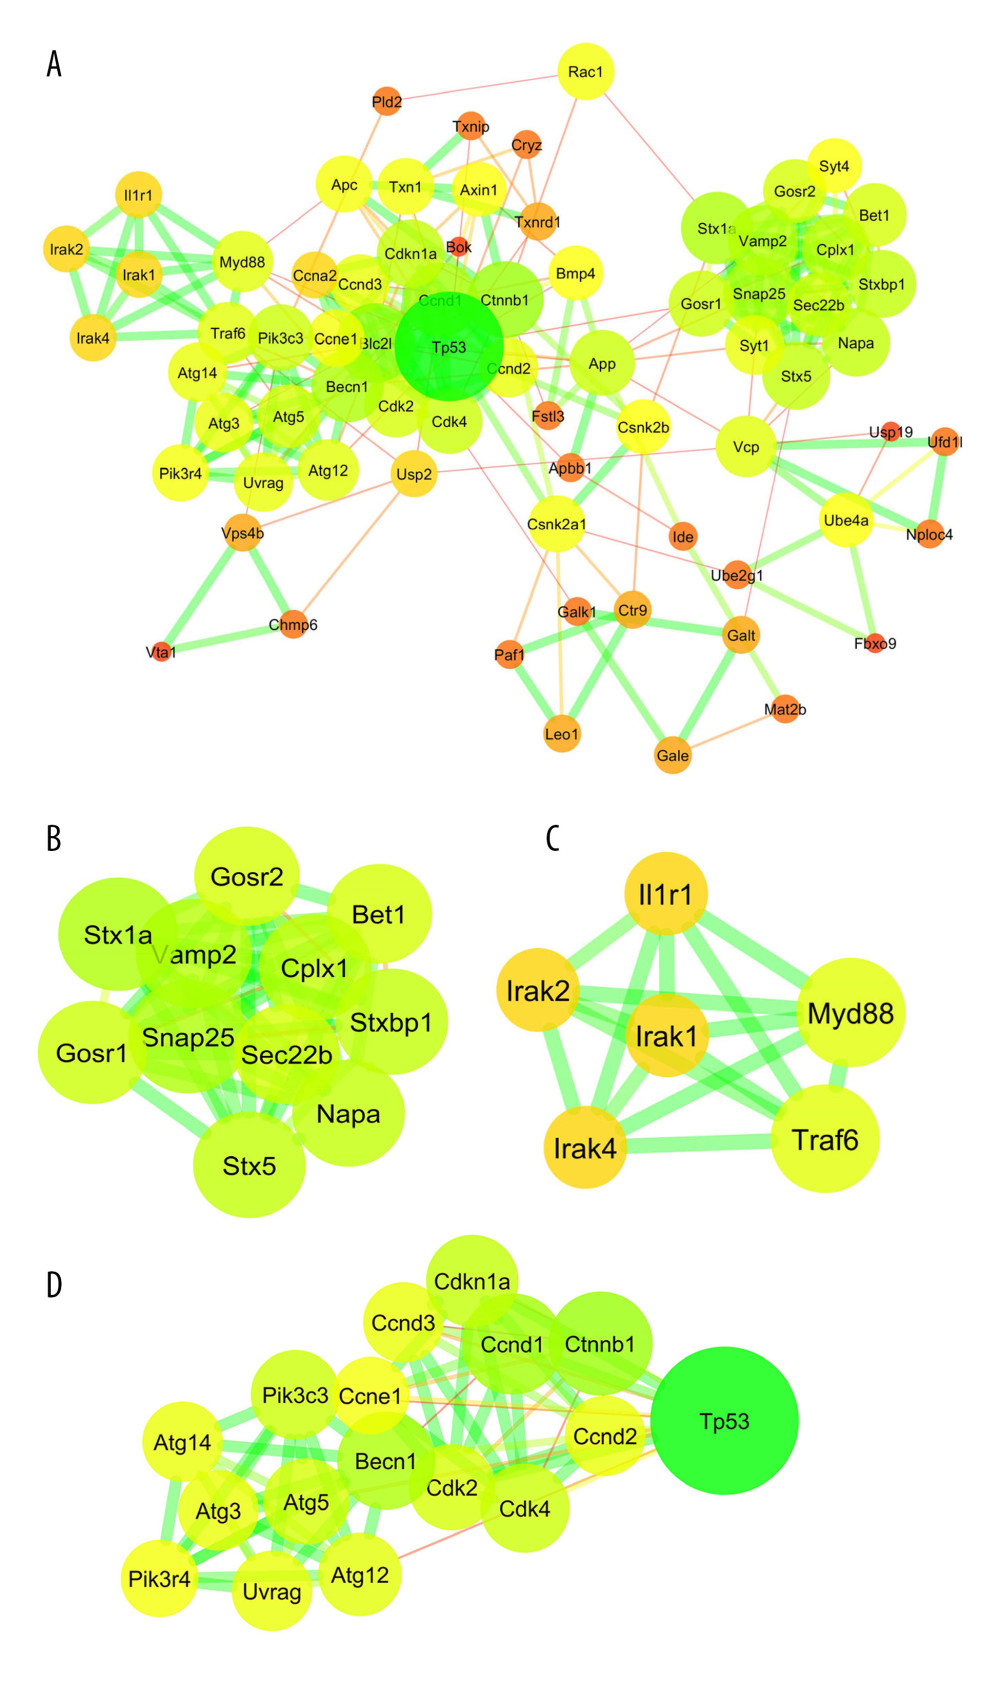 Figure 4. Protein–protein interaction (PPI) network analyses of common differentially expressed genes (DEGs) between GSE15041and GSE38038. (A) PPI network and the (B) first and (C) second sub-clusters. The PPI network charts were created using Cytoscape. The circle size of each protein represents its connection degree to other proteins. The width of each edge represents the combined score between the 2 proteins. (D) The hub genes were identified by the CytoHubba plugin in Cytoscape.
 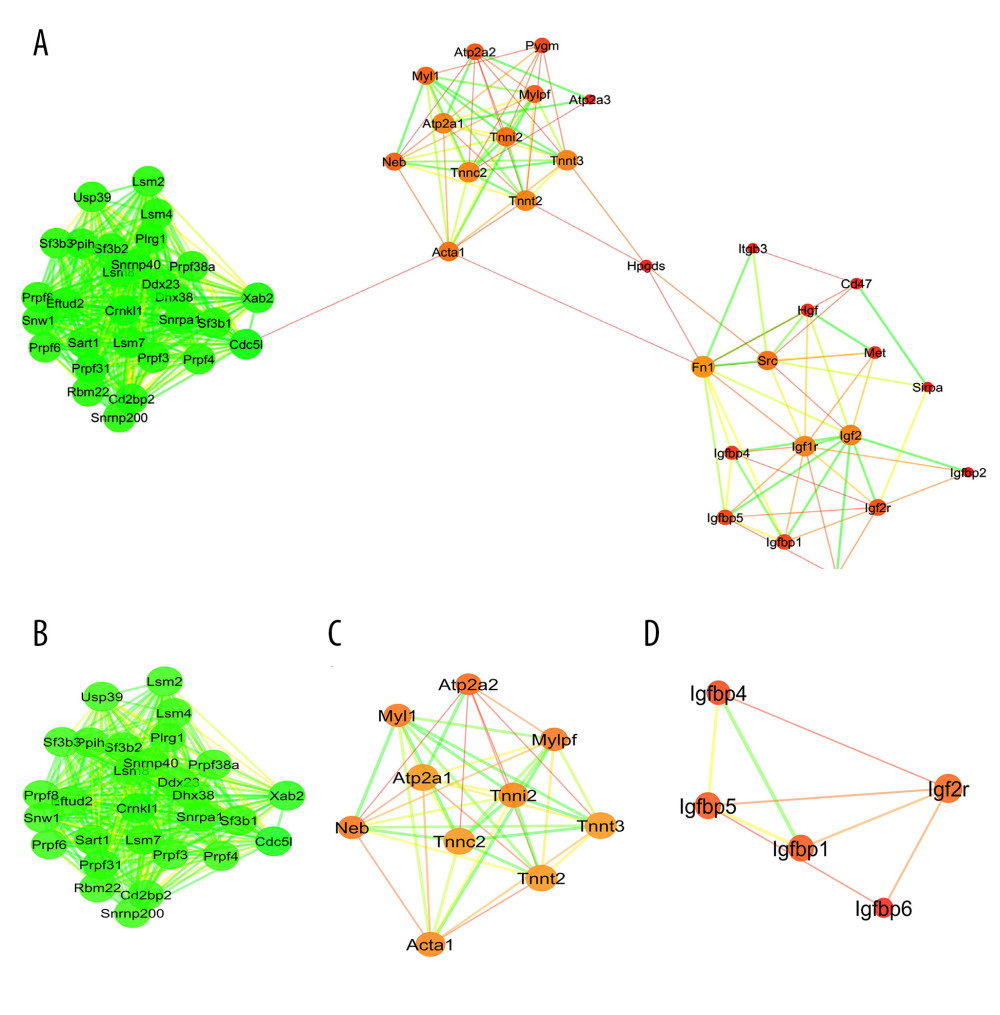 Figure 5. Protein–protein interaction (PPI) network analyses of common differentially expressed genes (DEGs) between GSE2884 and GSE24982. (A) PPI network and the (B) first and (C) second sub-clusters. The PPI network charts were created using Cytoscape. The circle size of each protein represents its connection degree to other proteins. The width of each edge represents the combined score between the 2 proteins. (D) The hub genes were identified by the CytoHubba plugin in Cytoscape.
 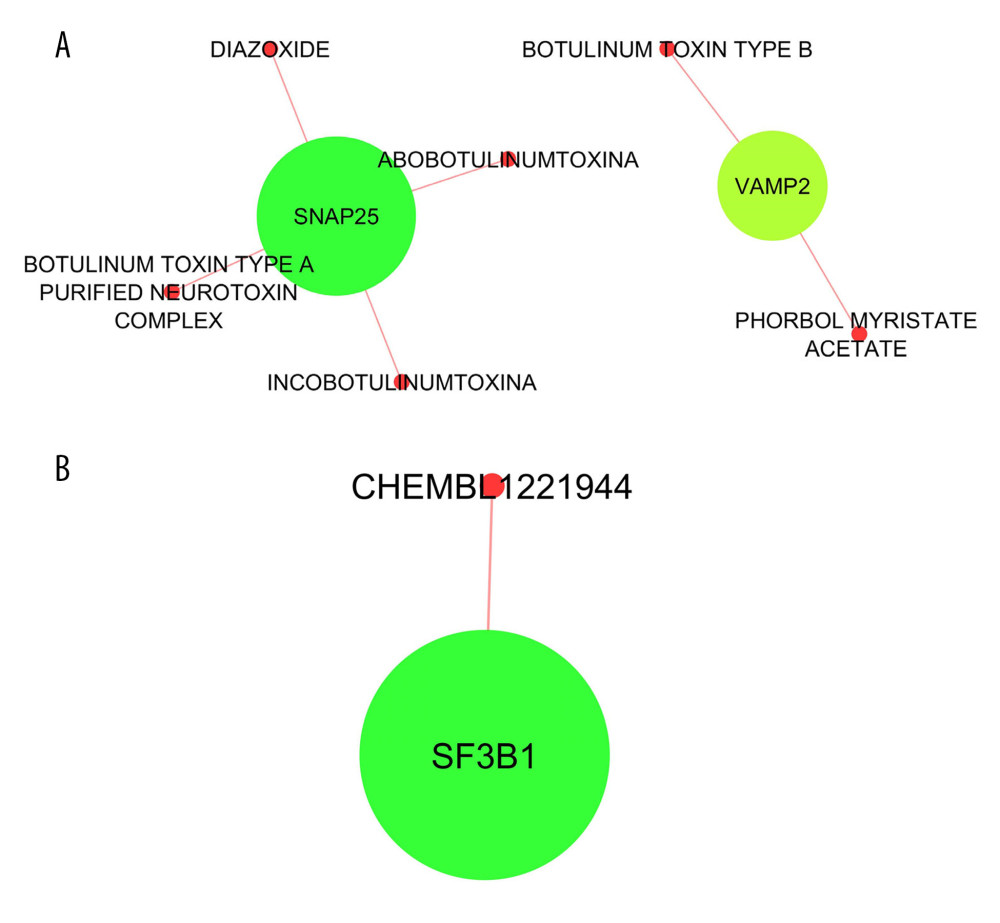 Figure 6. Drug-hub gene interaction network analyses for the hub genes identified at the (A) early and (B) late stages. The drug-hub gene interaction network charts were created using Cytoscape. The green nodes represent the hub genes.
 References
1. Colloca L, Ludman T, Bouhassira D, Neuropathic pain: Nat Rev Dis Primers, 2017; 3; 17002
2. Galluzzi KE, Management of neuropathic pain: J Am Osteopath Assoc, 2005; 105; S12-19
3. Krames ES, The role of the dorsal root ganglion in the development of neuropathic pain: Pain Med, 2014; 15; 1669-85
4. Guha D, Shamji MF, The dorsal root ganglion in the pathogenesis of chronic neuropathic pain: Neurosurgery, 2016; 63(Suppl 1); 118-26
5. Chung JM, Kim HK, Chung K, Segmental spinal nerve ligation model of neuropathic pain: Methods Mol Med, 2004; 99; 35-45
6. Wang IM, Zhang B, Yang X, Systems analysis of eleven rodent disease models reveals an inflammatome signature and key drivers: Mol Syst Biol, 2012; 8; 594
7. von Schack D, Agostino MJ, Murray BS, Dynamic changes in the microRNA expression profile reveal multiple regulatory mechanisms in the spinal nerve ligation model of neuropathic pain: PLoS One, 2011; 6; e17670
8. Vega-Avelaira D, Geranton SM, Fitzgerald M, Differential regulation of immune responses and macrophage/neuron interactions in the dorsal root ganglion in young and adult rats following nerve injury: Mol Pain, 2009; 5; 70
9. Yu H, Liu Y, Li C, Bioinformatic analysis of neuroimmune mechanism of neuropathic pain: Biomed Res Int, 2020; 2020; 4516349
10. Yang X, Zhu L, Zhao B, Screening and identification of key genes, pathways, and drugs associated with neuropathic pain in dorsal horn: Evidence from bioinformatic analysis: J Pain Res, 2021; 14; 1813-26
11. Antonucci F, Corradini I, Fossati G, SNAP-25, a known presynaptic protein with emerging postsynaptic functions: Front Synaptic Neurosci, 2016; 8; 7
12. Wang J, Xu W, Kong Y, SNAP-25 contributes to neuropathic pain by regulation of VGLuT2 expression in rats: Neuroscience, 2019; 423; 86-97
13. Zhong ZQ, Xiang Y, Hu X, Synaptosomal-associated protein 25 may be an intervention target for improving sensory and locomotor functions after spinal cord contusion: Neural Regen Res, 2017; 12; 969-76
14. Ding XD, Wang W, Ding ZG, Impact of Botox-A SNAP-25 protein expression and the mechanism of inhibitory neurotransmitter imbalance in chronic sciatic nerve pain rat model: Exp Ther Med, 2017; 13; 2783-86
15. Schoch S, Deak F, Konigstorfer A, SNARE function analyzed in synaptobrevin/VAMP knockout mice: Science, 2001; 294; 1117-22
16. Zhang HH, Zhang XQ, Wang WY, Increased synaptophysin is involved in inflammation-induced heat hyperalgesia mediated by cyclin-dependent kinase 5 in rats: PLoS One, 2012; 7; e46666
17. Muller HK, Kragballe M, Fjorback AW, Wiborg O, Differential regulation of the serotonin transporter by vesicle-associated membrane protein 2 in cells of neuronal versus non-neuronal origin: PLoS One, 2014; 9; e97540
18. Brandenburger T, Johannsen L, Prassek V, MiR-34a is differentially expressed in dorsal root ganglia in a rat model of chronic neuropathic pain: Neurosci Lett, 2019; 708; 134365
19. Quesada V, Conde L, Villamor N, Exome sequencing identifies recurrent mutations of the splicing factor SF3B1 gene in chronic lymphocytic leukemia: Nat Genet, 2011; 44; 47-52
20. Liu Q, Zhang B, Liu C, Zhao D, Molecular mechanisms underlying the positive role of treadmill training in locomotor recovery after spinal cord injury: Spinal Cord, 2017; 55; 441-46
21. Rojewska E, Korostynski M, Przewlocki R, Expression profiling of genes modulated by minocycline in a rat model of neuropathic pain: Mol Pain, 2014; 10; 47
22. Lewitt MS, Boyd GW, The role of insulin-like growth factors and insulin-like growth factor-binding proteins in the nervous system: Biochem Insights, 2019; 12; 1178626419842176
23. Simon CM, Rauskolb S, Gunnersen JM, Dysregulated IGFBP5 expression causes axon degeneration and motoneuron loss in diabetic neuropathy: Acta Neuropathol, 2015; 130; 373-87
24. von Hehn CA, Baron R, Woolf CJ, Deconstructing the neuropathic pain phenotype to reveal neural mechanisms: Neuron, 2012; 73; 638-52
25. Ji RR, Nackley A, Huh Y, Neuroinflammation and central sensitization in chronic and widespread pain: Anesthesiology, 2018; 129; 343-66
Figures
Figure 1. Venn diagram of common differentially expressed genes (DEGs). Intersections were analyzed among DEGs in GSE15041, GSE38038, GSE2884, and GSE24982 microarray datasets. The diagram was created by using a Venn diagram maker from the Van de Peer Lab. GSE15041 and GSE38038 were based on dorsal root ganglia collected on day 7 after spinal nerve ligation, while GSE2884 and GSE24982 were based on dorsal root ganglia collected on day 28.Figure 2. Functional enrichment analysis of common differentially expressed genes (DEGs) between GSE15041and GSE38038 at the early stage after spinal nerve ligation. (A) Biological process enriched in Gene Ontology (GO) analyses. (B) Cellular components enriched in GO analyses. (C) Molecular function enriched in GO analyses. (D) Enriched Kyoto Encyclopedia of Genes and Genomes (KEGG) pathways. The bubble charts were created by using R software with ggplot2. The dot size represents the number of enriched DEGs. The dot color represents −log10 (P value).Figure 3. Functional enrichment analysis of common differentially expressed genes (DEGs) between GSE2884 and GSE24982 at the late stage after spinal nerve ligation. (A) Biological process enriched in Gene Ontology (GO) analyses. (B) Cellular components enriched in GO analyses. (C) Molecular function enriched in GO analyses. (D) Enriched Kyoto Encyclopedia of Genes and Genomes (KEGG) pathways. The bubble charts were created by using R software with ggplot2. The dot size represents the number of enriched DEGs. The dot color represents −log10 (P value).Figure 4. Protein–protein interaction (PPI) network analyses of common differentially expressed genes (DEGs) between GSE15041and GSE38038. (A) PPI network and the (B) first and (C) second sub-clusters. The PPI network charts were created using Cytoscape. The circle size of each protein represents its connection degree to other proteins. The width of each edge represents the combined score between the 2 proteins. (D) The hub genes were identified by the CytoHubba plugin in Cytoscape.Figure 5. Protein–protein interaction (PPI) network analyses of common differentially expressed genes (DEGs) between GSE2884 and GSE24982. (A) PPI network and the (B) first and (C) second sub-clusters. The PPI network charts were created using Cytoscape. The circle size of each protein represents its connection degree to other proteins. The width of each edge represents the combined score between the 2 proteins. (D) The hub genes were identified by the CytoHubba plugin in Cytoscape.Figure 6. Drug-hub gene interaction network analyses for the hub genes identified at the (A) early and (B) late stages. The drug-hub gene interaction network charts were created using Cytoscape. The green nodes represent the hub genes. In Press
Clinical Research
Analysis of the Clinical Characteristics and Endoscopic Features of Phytobezoar-Induced Ulcers and Gastric ...Med Sci Monit In Press; DOI: 10.12659/MSM.952191
Clinical Research
Effect of Indirect Co-Culture With Gingival Mesenchymal Stem Cells on Cytokine Secretion in Primary Oral Sq...Med Sci Monit In Press; DOI: 10.12659/MSM.952439
Clinical Research
Comparison of Sleep Architecture in Individuals Aged 65 to 80 Years With and Without Mild Cognitive Impairm...Med Sci Monit In Press; DOI: 10.12659/MSM.952493
Clinical Research
Effects of Single-Bout Endurance Exercise Intensity on Peripheral Neurotrophic Factors in Patients With Isc...Med Sci Monit In Press; DOI: 10.12659/MSM.952089
Most Viewed Current Articles
17 Jan 2024 : Review article 14,176,514
Vaccination Guidelines for Pregnant Women: Addressing COVID-19 and the Omicron VariantDOI :10.12659/MSM.942799
Med Sci Monit 2024; 30:e942799
13 Nov 2021 : Clinical Research 3,760,677
Acceptance of COVID-19 Vaccination and Its Associated Factors Among Cancer Patients Attending the Oncology ...DOI :10.12659/MSM.932788
Med Sci Monit 2021; 27:e932788
14 Dec 2022 : Clinical Research 2,466,264
Prevalence and Variability of Allergen-Specific Immunoglobulin E in Patients with Elevated Tryptase LevelsDOI :10.12659/MSM.937990
Med Sci Monit 2022; 28:e937990
16 May 2023 : Clinical Research 708,906
Electrophysiological Testing for an Auditory Processing Disorder and Reading Performance in 54 School Stude...DOI :10.12659/MSM.940387
Med Sci Monit 2023; 29:e940387