11 February 2022: Clinical Research
Estimation of 24-h Urine Protein Excretion Using Urine Albumin-to-Creatinine Ratio from an In-Hospital Population
Xin Liu 12BCDEF , Yonghong Zhao 3CDE , Yunlin Feng 24ACDEF*DOI: 10.12659/MSM.934307
Med Sci Monit 2022; 28:e934307

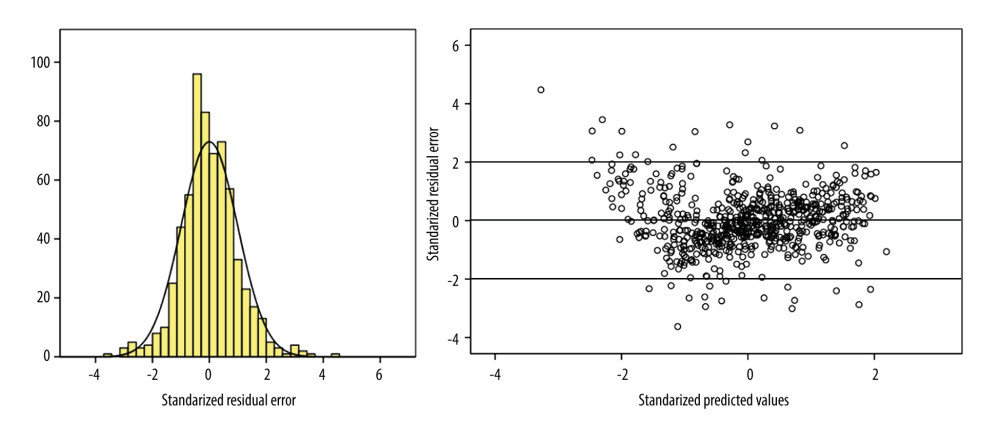
Figure 2 Illustration of performance evaluation in the development group. (Left) Histogram of standardized residual error in the development group, demonstrating the linear regression met the requirement of normality. The horizontal coordinates represent standardized residual errors between predicted and observed results. The vertical coordinates represent percentages. (Right) Plot of residual errors in the development group, demonstrating the linear regression met the requirement of homogeneity and independence. The horizontal coordinates represent predicted natural logarithm-transformed 24-h urine protein excretion. The vertical coordinates represent residual errors between predicted and observed results. The figure was created by SPSS version 22.0 (IBM Corp, Armonk, NY, USA).


