16 April 2022 : Database Analysis
Identification of Novel Genes and Associated Drugs in Cervical Cancer by Bioinformatics Methods
Dan Wang1CDE, Yanling Liu2F, Shuyu Cheng1D, Guoyan Liu123AG*DOI: 10.12659/MSM.934799
Med Sci Monit 2022; 28:e934799


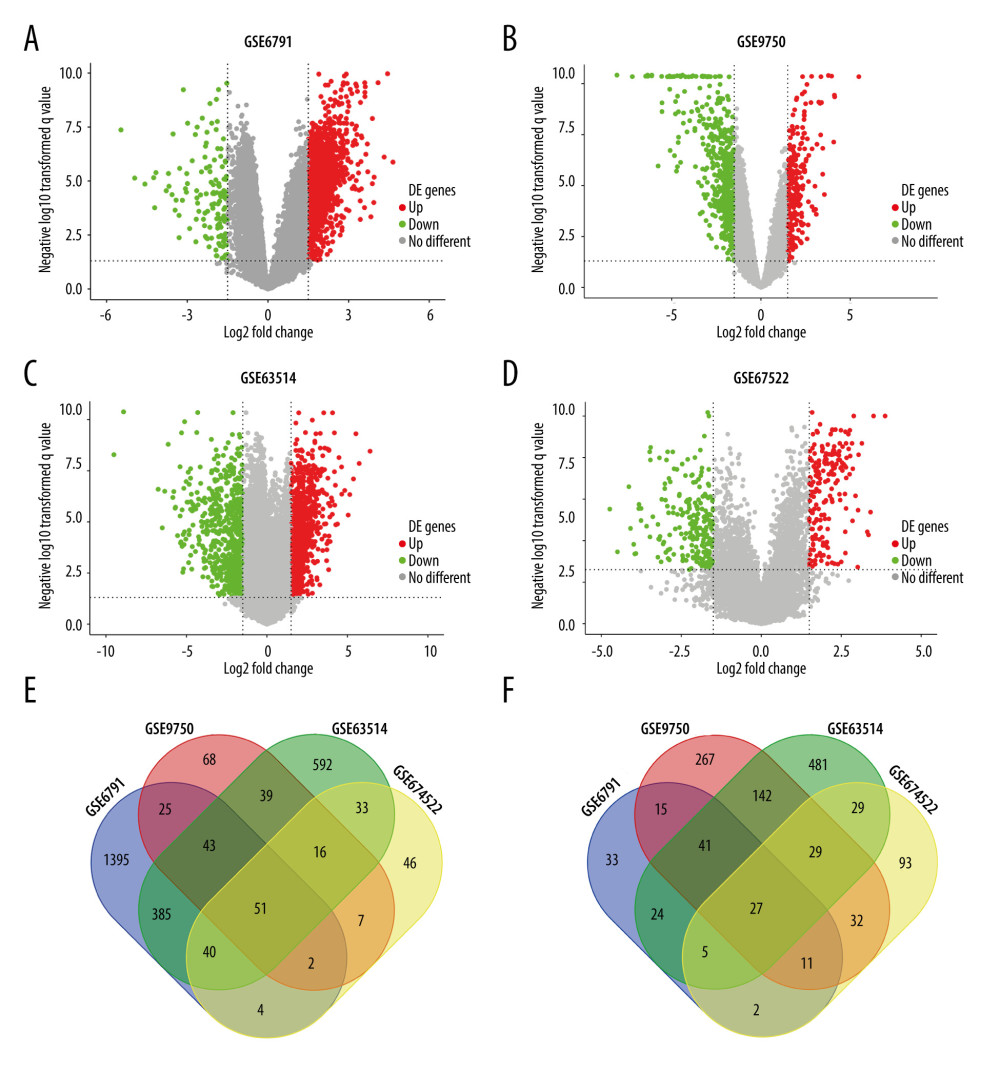
Figure 1 78 overlapping DEGs among GSE6791, GSE9750, GSE63514, and GSE67522 datasets. The volcano plots of DEGs in (A) GSE6791, (B) GSE9750, (C) GSE63514, and (D) GSE67522 green dots and red dots represent the significantly downregulated and upregulated DEGs respectively. The upregulated (E) and downregulated (F) overlapping DEGs are illustrated in the Venn diagram. The relevant graphics are made through the Image GP (http://www.ehbio.com/Cloud_Platform/front/).