15 May 2022 : Database Analysis
Bibliometric Visualization Analysis of Microbiome-Gut-Brain Axis from 2004 to 2020
Hui Wang1ABE, Tianlin Long2ACG, Jing You2BC, Ping Li23ACDF*, Quanhua Xu2AGDOI: 10.12659/MSM.936037
Med Sci Monit 2022; 28:e936037


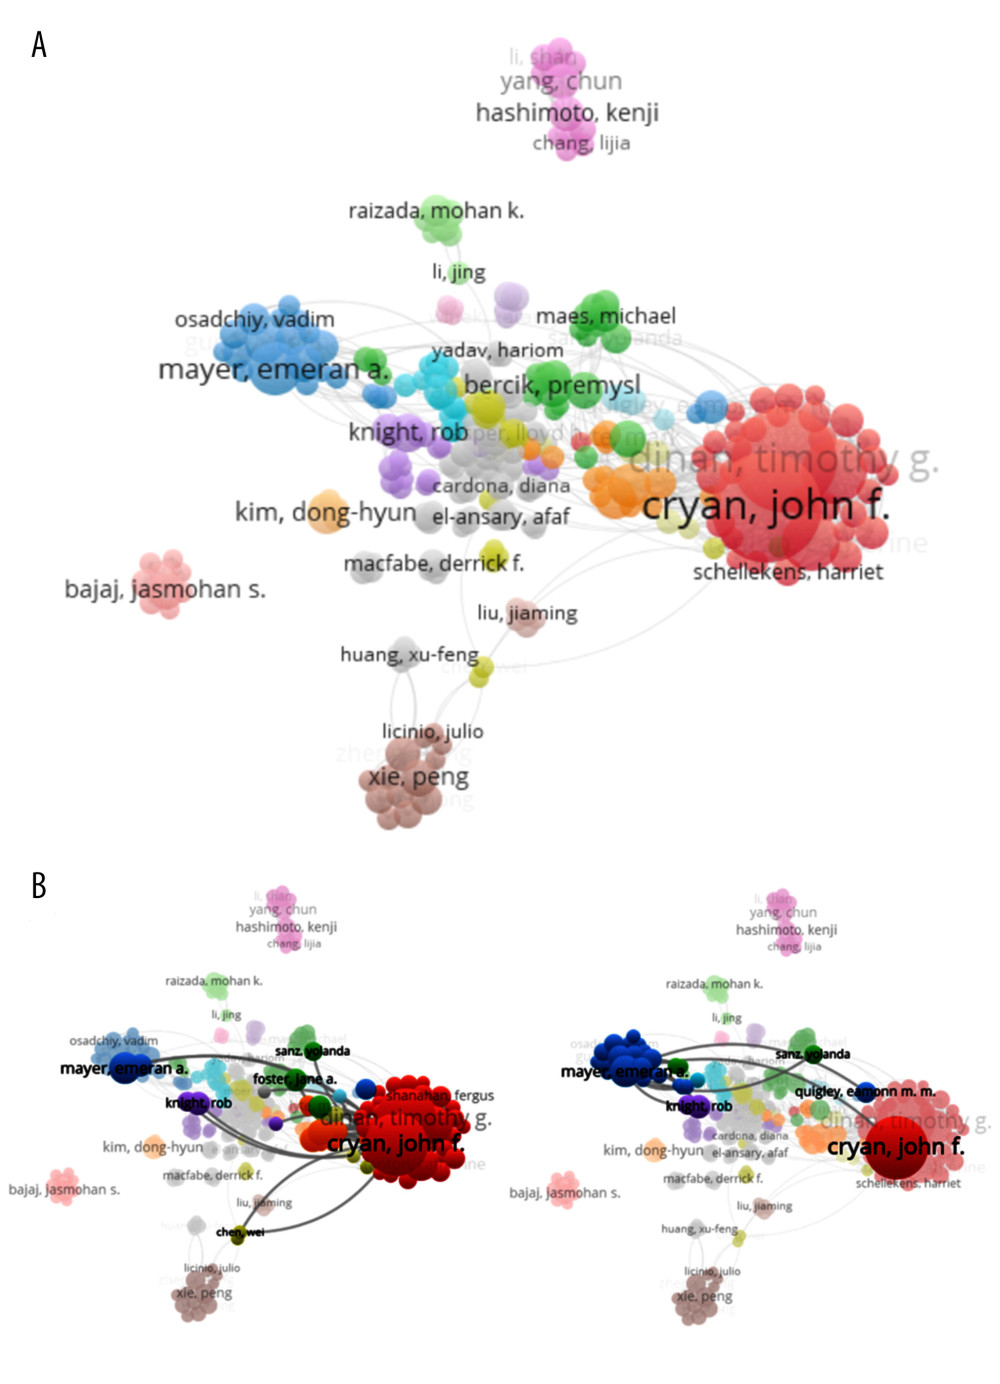
Figure 4 Co-authorship analysis of authors. (A) Map of the cooperation between 338 authors by the VOSviewer. (B) Analysis of the authors who cooperated with John F. Cryan or Emeran A. Mayer. Different colors indicate clusters of collaboration between authors, the size of the circle indicates citations to the publication, and the thickness of the line indicates the size of collaboration. The network visualization was performed by VOSviewer (1.6.15 versions; Centre for Science and Technology Studies, Leiden University, the Netherlands).