15 May 2022 : Database Analysis
Bibliometric Visualization Analysis of Microbiome-Gut-Brain Axis from 2004 to 2020
Hui Wang1ABE, Tianlin Long2ACG, Jing You2BC, Ping Li23ACDF*, Quanhua Xu2AGDOI: 10.12659/MSM.936037
Med Sci Monit 2022; 28:e936037


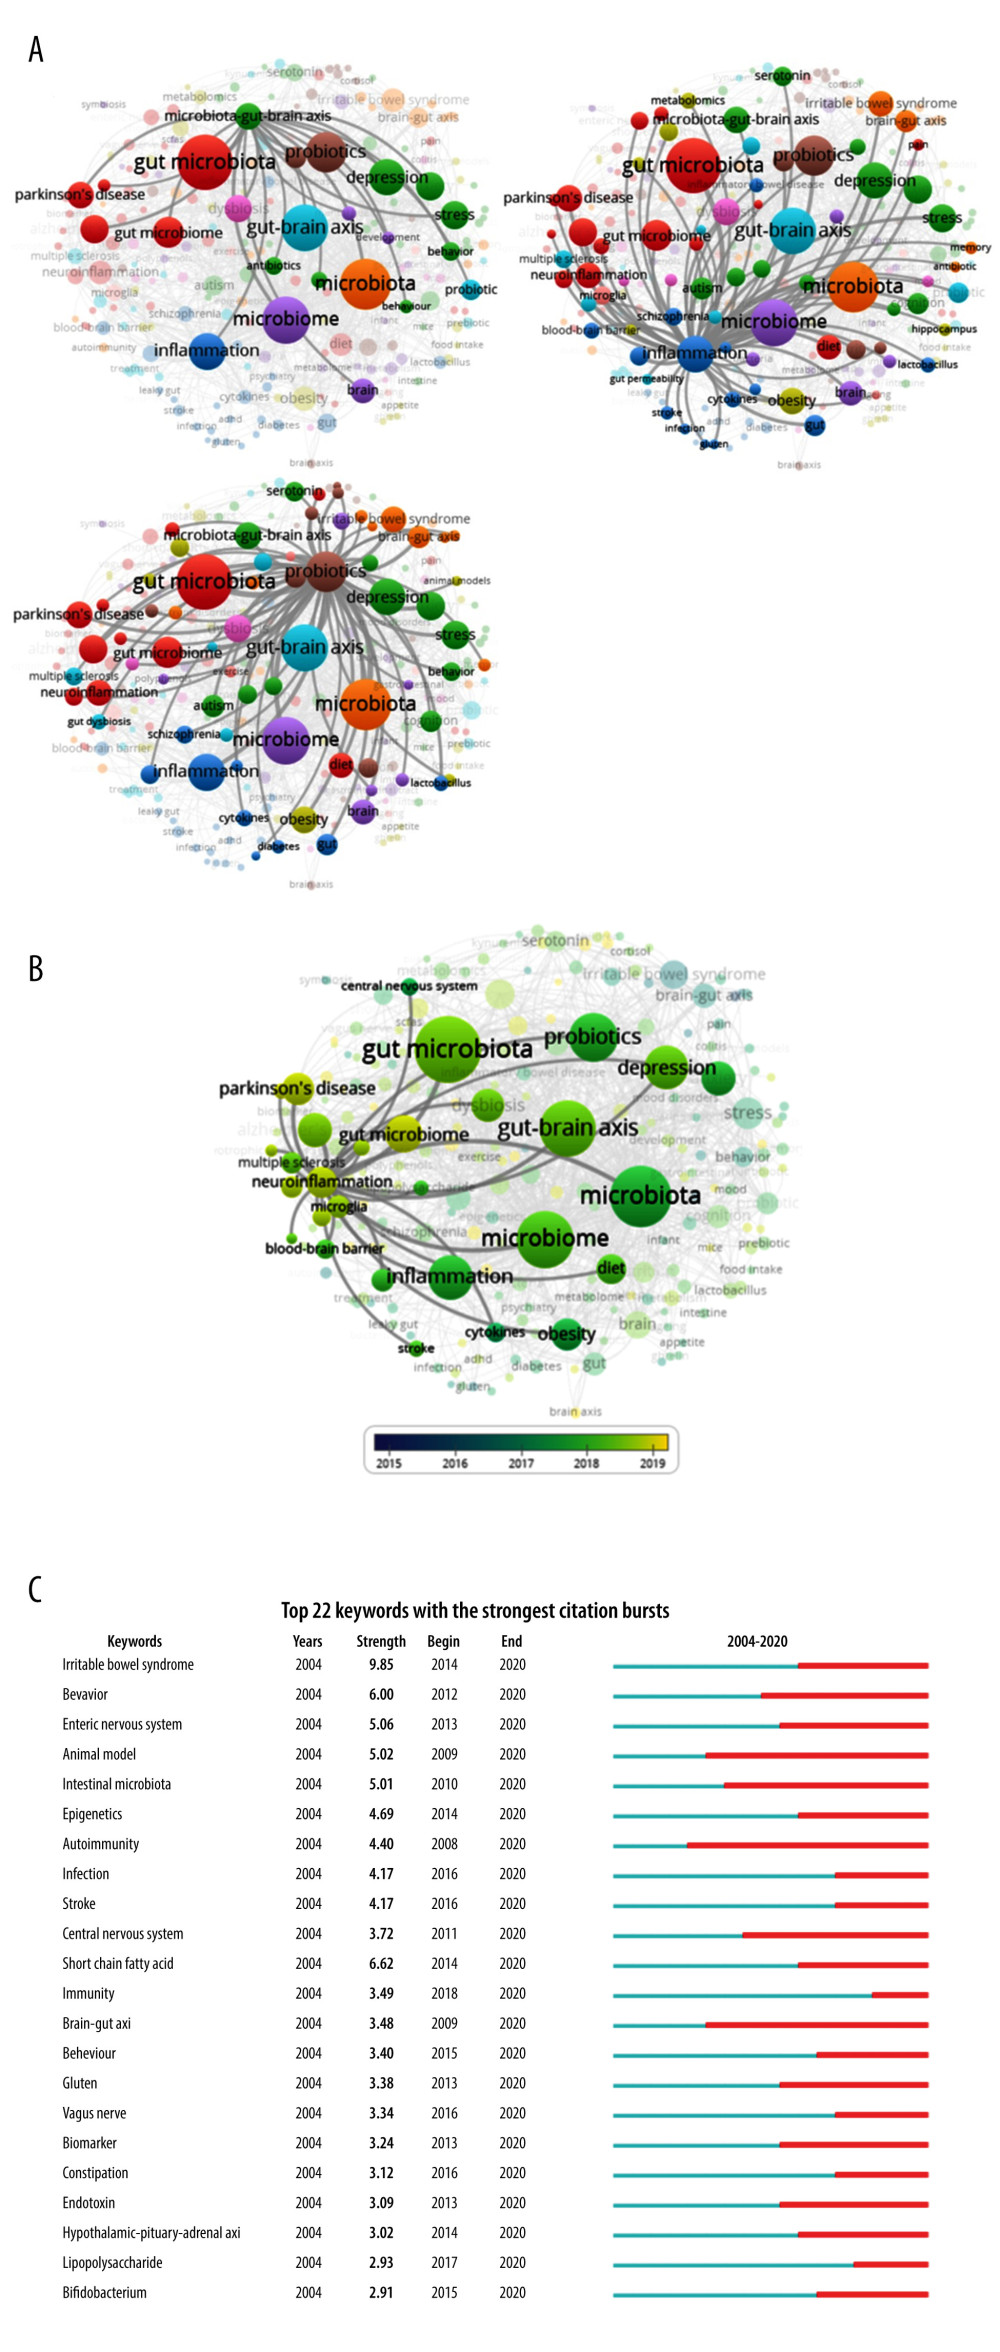
Figure 5 Co-occurrence analysis of author keywords. (A) Map of the relevant author keywords of microbiota-gut-brain-axis, inflammation, or probiotics. (B) The average published year shows the relationship of neuroinflammation between other author keywords. The color shows the average published year. The network visualization was performed by VOSviewer (1.6.15 versions; Centre for Science and Technology Studies, Leiden University, the Netherlands). (C) Top 20 keywords with the strongest citation bursts by Citespace (5.7. R3 versions; College of Information Science and Technology, Leisel University, USA). ɣ: 1.0; minimum duration: 2.