14 June 2022 : Clinical Research
Fully Automatic Knee Joint Segmentation and Quantitative Analysis for Osteoarthritis from Magnetic Resonance (MR) Images Using a Deep Learning Model
Xiongfeng Tang1ABCEF, Deming Guo1BF, Aie Liu2ACDE, Dijia Wu2ADE, Jianhua Liu3BCD, Nannan Xu3BDF, Yanguo Qin4ACDG*DOI: 10.12659/MSM.936733
Med Sci Monit 2022; 28:e936733


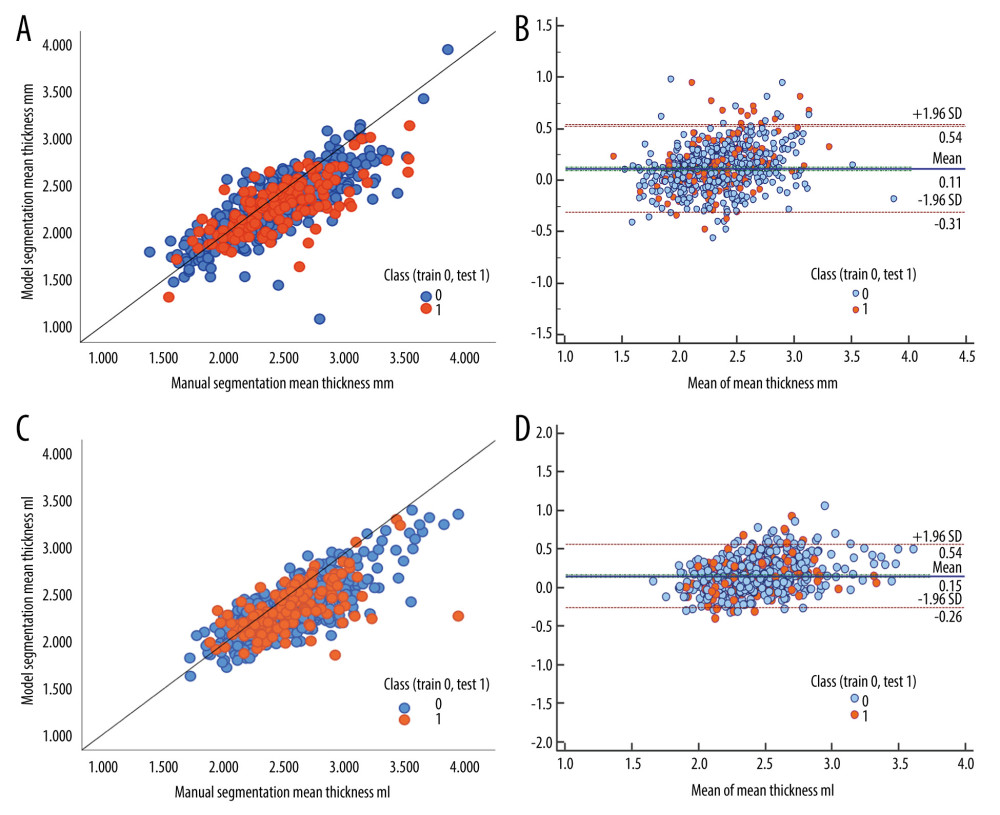
Figure 6 The scatterplots and Bland-Altman plots show comparisons of OA-related imaging biomarkers including thickness, volumetric, joint space width, coverage for segmented structure calculations produced from manual and automatic segmentation. (A, C) Scatterplots of mean thickness of medial meniscus (MM)/lateral meniscus (LM) between manual and automatic segmentation; (B, D) Bland-Altman Plots of mean thickness of MM/LM between manual and automatic segmentation. Note that the mean difference and standard errors of the mean of the Bland-Altman plot were calculated using the entire internal dataset. (Scatterplots made by IBM SPSS Statisitc20; Bland-Altman Plots made by MedCalc Version 20.106).