13 March 2024: Database Analysis
Increasing Burden of Osteoarthritis in China: Trends and Projections from the Global Burden of Disease Study 2019
Shugang Hu1EF, Yongwei Li1C, Xinyi Zhang1B, Tariq Alkhatatbeh1D, Wei Wang1A*DOI: 10.12659/MSM.942626
Med Sci Monit 2024; 30:e942626


Abstract
BACKGROUND: This study aimed to evaluate the epidemiology of osteoarthritis in China in a comprehensive and reliable way, to project its future epidemiological patterns, and to mitigate its health hazards.
MATERIAL AND METHODS: Data were extracted and analyzed from the Global Burden of Diseases Study 2019. Trends in osteoarthritis epidemiology were explored using joinpoint regression analysis. Additionally, we analyzed dynamic trends using the sociodemographic index (SDI) of China. To assess and predict the epidemiology of osteoarthritis from 2020 to 2039, we used both the Bayesian age-period-cohort model and Nordpred model.
RESULTS: The number of prevalent cases, incident cases, and years lived with disability (YLDs) for osteoarthritis in China increased from 51.8, 4.6, and 1.8 million, respectively, in 1990, to 132.8, 10.7, and 4.7 million, respectively, in 2019, and the average annual percentage changes were 3.286, 2.938, and 3.324, respectively. The prevalence and YLDs peaked in the population aged over 90 years old, while the incidence peaked in the population aged around 50 years old. A significant positive correlation was found between osteoarthritis burden and SDI. Osteoarthritis burden is expected to continue to increase. In the population studied here, it was higher in women than in men, but this may invert by 2039.
CONCLUSIONS: The prevalence, incidence, and YLDs of osteoarthritis had significantly increased and may continue to increase during the next 2 decades. Prevention and treatment strategies should target women, middle-aged individuals, and the elderly.
Keywords: Incidence, Osteoarthritis, Prevalence
Background
Osteoarthritis is the most common form of arthritis, affecting multiple joints in older adults [1,2]. The main symptom of osteoarthritis includes pain, stiffness, swelling, and limited joint function. It can also lead to long-term consequences including depression, fatigue, and sleep disorders, in addition to reduced physical function [3–5]. The prevalence of osteoarthritis has been estimated to have increased from 247.51 million in 1990 to 527.81 million in 2019 globally, primarily due to an aging population and the obesity epidemic [6]. The cost of osteoarthritis has been estimated to account for 1% to 2.5% of the gross domestic product in various high-income countries [7].
During the last 3 decades, China has undergone significant economic, demographic, and epidemiological changes [8,9]. From 1990 to 2019, the gross national income per capita increased from 1667 to 69 881, and the proportion of the population aged 65 years and older increased from 5.6% to 12.6%, with life expectancy increasing by 10.49 years [10,11]. The prevalence of obesity in adults was estimated to be 51.2% in 2018 and is projected to reach 70.5% in 2030 [12]. With the rapid increase of income per capita, an aging population, longer life expectancy, and rising obesity rate, the burden of osteoarthritis in China has significantly increased and is expected to be a substantial burden in the near future. In Beijing, the 10-year average age-standardized prevalence of osteoarthritis was 4.6%, and the average prevalence for people over 55 years old was 13.2% [13].
Comprehensive epidemiological data on osteoarthritis serves to provide reliable information for policymakers to develop efficient health policies to alleviate the osteoarthritis burden in China. The Global Burden of Disease Study (GBD) provides a tool for comprehensively investigating the burden of osteoarthritis in China. A previous study by Long et al described the prevalence and years lived with disability due to osteoarthritis in China from 1990 to 2017 according to age, sex, and geographical location based on the GBD for 2017 (GBD-2017) [14]. However, this study mainly focused on the demographic and geographic distribution of osteoarthritis, while the dynamic trends of osteoarthritis over time also have implications for the development of prevention and treatment strategies [15]. Additionally, the GBD for 2019 (GBD 2019) updated its definition of osteoarthritis and included hand and other osteoarthritis anatomical locations that were not included in GBD 2017. Therefore, this study aimed to describe the long-term trends in osteoarthritis incidence and prevalence, and years lived with disability (YLDs) due to osteoarthritis, according to sex and age, from 1990 to 2019 in China, and to predict the future burden of osteoarthritis until 2039 using data from GBD 2019. The findings of this study may enhance public and policymaker awareness of osteoarthritis and provide primary epidemiological data for future prevention.
Material and Methods
OVERVIEW:
This study was a secondary analysis based on publicly available data from GBD 2019. Briefly, data on osteoarthritis incidence, prevalence, and YLDs from 1990 to 2019 were extracted using a GBD results tool [16]. Then, trends in osteoarthritis epidemiology were evaluated by sex using a joinpoint regression model. The sociodemographic index (SDI) was also extracted from the GBD website [17] and Pearson’s correlation coefficients were used to assess the correlations between SDI level and osteoarthritis epidemiology. Projections of osteoarthritis epidemiology from 2019 to 2039 were created using Nordpred and Bayesian age-period-cohort (BAPC) models.
CASES DEFINITION AND DATA SOURCES:
The GBD 2019 study aimed to provide reliable, comprehensive, and up-to-date assessments of incidence, prevalence, mortality, YLDs, years of life lost, disability-adjusted life years, and maternal mortality ratio for 369 diseases and injuries in different sex and age groups within 204 countries and territories, 7 super-regions, and 21 regions from 1990 to 2019 [18,19]. Osteoarthritis is defined as symptomatic osteoarthritis at the hip, knee, hand, and other joints (other than the spine) that have been radiologically confirmed as Kellgren-Lawrence grade 2–4 [6,20]. Grade 2 symptomatic osteoarthritis involves osteophytes in the affected joint and pain for at least 1 month during the previous 12 months. Grade 3–4 symptomatic osteoarthritis involves osteophytes in the affected joint, the joint space narrowing with deformity, and pain for at least 1 month during the previous 12 months [2,21].
Data for GBD estimating the burden of fatal and non-fatal diseases were taken from censuses, household surveys, civil registration, vital statistics, disease registries, disease notifications, and other sources [18]. The exclusion criteria were: (1) sub-populations clearly not representative of the national population; (2) non-population-based studies; (3) low sample size (less than 150); (4) reviews (rather than original studies). A total of 169 unique data sources were adopted for the estimates of osteoarthritis burden. The number of studies contributing to the osteoarthritis database in China was 15. The specific data sources used in estimating the burden of osteoarthritis can be found in the GBD 2019 Data Input Sources Tool [22].
The SDI, which is a summary measure of the development of countries or other geographic areas, was calculated from the indices of total fertility rate for women under the age of 25, average years of education for those ages 15 and older, and lag-distributed income per capita expressed on a scale of 0 (worst) to 1 (best) [23]. The national SDI for China increased from 0.433 to 0.686 from 1990 to 2019 (Supplementary Table 1).
ESTIMATION OF PREVALENCE, INCIDENCE, AND YLDS:
According to GBD 2019, the prevalence of osteoarthritis was defined as the proportion of people in a population who had osteoarthritis disease, injury, or sequelae, and all results refer to point prevalence [16]. The incidence was defined as the number of new cases of osteoarthritis due to any given cause during a given period in a specified population, and incidence was expressed as the number of new cases in a year divided by the mid-year population size [16]. The YLDs were defined as years lived with any short-term or long-term health loss weighted for severity by the disability weights [16]. For the estimation of prevalence, incidence, and YLDs, data were first split by age and sex, and then evaluated using the Disease Model Bayesian Meta-Regression (DisMod-MR) 2.1 model [18].
STATISTICAL ANALYSIS:
The osteoarthritis incidence, prevalence, and YLDs were reported with 95% confidence intervals (CIs) according to age and sex. The joinpoint regression model was used to evaluate the trends of osteoarthritis burden, and the annual percentage change (APC), with 95% CIs, was calculated for each segmented line regression with a maximal number of joinpoints. The average annual percent change (AAPC), with its 95% CIs, was calculated for the entire period [24,25]. Pearson’s correlation coefficients were used to assess the correlations between SDI level and osteoarthritis incidence, prevalence, and YLDs.
The Nordpred and BAPC models were used to project the disease burden parameters from osteoarthritis by sex from 2020 to 2039 [26]. To evaluate the performance of the Nordpred and BAPC models, data from 1990 to 2019 were divided into 2 intervals (1990–2009 and 2010–2019). Then, data from 1990 to 2009 were used to project the osteoarthritis burden from 2010 to 2019, and the observed values from 2010 to 2019 were used to validate the accuracy of the projected values. Error rate, calculated by (predicted values - observed values) ÷ (observed values), was used to assess the performance of the Nordpred and BAPC models [27]. Additionally, the number of events was also calculated under the assumptions that the rates remained the same (the optimistic reference), decreased by 1%, or increased by 1% per year, based on the observed rate in 2019, to facilitate comparison with projected results [28,29]. Population data for the period 1990–2039 were also extracted from the GBD website [30]. The age-standardized population used for standardization can be found in previous literature [31]. The joinpoint analyses were performed with Joinpoint Trend Analysis Software version 4.9.1.0 (National Cancer Institute, USA). Other data were analyzed using R program version 4.2.1 (R core team). P values less than 0.05 were considered statistically significant.
Results
TRENDS IN OSTEOARTHRITIS PREVALENCE, INCIDENCE, AND YLDS IN CHINA:
Figure 1 illustrates the trends in total prevalent cases and age-standardized prevalence (ASP) of osteoarthritis from 1990 to 2019 by sex. For men, the total prevalent cases increased from 21.3 million (95% CI, 18.9–24.0) in 1990 to 53.9 million (95% CI, 47.8–60.6) in 2019 with an AAPC of 3.209 (95% CI, 3.022–3.397) (Figure 1A and Supplementary Figure 2, Table 1). For women, the total prevalent cases rose from 30.5 million (95% CI, 27.1–34.2) in 1990 to 78.9 million (95% CI, 70.2–88.7) in 2019 with an AAPC of 3.345 (95% CI, 3.312–3.379) (Figure 1B and Supplementary Figure 2, Table 1). For both sexes combined, the total prevalent cases increased from 51.8 million (95% CI, 45.9–58.3) in 1990 to 132.8 million (95% CI, 118.0–149.1) in 2019, with an AAPC of 3.286 (95% CI, 3.233–3.338) (Figure 1C and Supplementary Figure 2, Table 1).
The ASP among men showed a trend of intermittent increases, characterized by 3 significant increases (1990–1994, 2000–2005, and 2010–2019) and 2 significant declines (1994–2000 and 2005–2010) (Figure 2A). In contrast, the ASP among women initially declined (1990–1998), followed by a significant increase (1998–2015), and subsequent decrease (2015–2019) (Figure 2B). The ASP among both sexes combined exhibited a stable trend during 1990–2000, a significant increase during 2000–2005, and stabilization again during 2005–2019 (Figure 2C). The corresponding AAPC of ASP for men, women, and both sexes were 0.235 (95% CI, 0.113–0.357), 0.240 (95% CI, 0.194–0.285), and 0.241 (95% CI, 0.182–0.301), respectively (Supplementary Table 2). The incidence and YLDs exhibited similar trends to the prevalence (Supplementary Figures 1–4, Supplementary Tables 3, 4).
TRENDS IN OSTEOARTHRITIS BURDEN ACCORDING TO AGE AND SDI:
Figures 3 and 4 depict the long-term trends in the prevalence and total number of osteoarthritis cases from 1990 to 2019. Generally, the osteoarthritis prevalence remained stable with a slight increase, associated with age, for both men and women (Figure 3). The prevalence increased rapidly with age in the population aged from 35 to 64 years and peaked in the population aged over 90 years (Figure 3). However, the highest number of cases was observed in the population aged 50 to 64, while the lowest number was observed in the population aged over 95 years (Figure 4). Notably, there was a rapid increase in the number of prevalent cases among individuals aged 65 to 69 from 2010 to 2019 with no obvious increase in overall prevalence in the population (Figure 4). The incidence increased with age in the population aged 30 to 54, peaking in the population aged 50 to 54, and then decreased with age in the population aged over 55. Notably, the incidence in the population aged over 95 was higher than that in individuals under 49 (Supplementary Figure 5). The number of incident cases showed a trend of intermittent increases. However, the lowest number of incident cases was observed in the population aged over 95 (Supplementary Figure 6). The YLDs due to osteoarthritis showed similar long-term trends, with osteoarthritis prevalence (Supplementary Figures 7, 8), incidence, and YLDs all exhibiting a significant positive correlation with SDI; the correlation coefficients were all over 0.98 (Figure 5 and Supplementary Figure 9).
PROJECTION OF OSTEOARTHRITIS BURDEN IN CHINA FROM 2020 TO 2039:
Based on the data from 1990 to 2019, the BAPC model and Nordpred model were used to project the total incident cases, total prevalent cases, and total YLDs from 2020 to 2039. The accuracy of the 2 models was assessed using the data from 1990 to 2019. Supplementary Figure 10 showed the error rates of the models. The projection results of the BAPC model showed low error rates in women-only and both-sex groups (less than 5%). However, the error rates exceeded 9% for men. The projection error rates of the Nordpred model showed less variation (around 6%). Figures 6 and 7 present the projection results from the BAPC and the Nordpred models. Overall, the total incident cases in China for both sexes were projected to increase from 4.59 million in 2020 to over 12 million in 2039, which is close to the optimistic reference. For men, the models predicted a dramatic increase in the total incidence, approaching the optimistic reference with an annual increase rate of 1%. For women, the BAPC model predicted that total incident cases would first increase to 6.52 million in 2029 and then decrease to 6.18 million in 2039. This number was close to the incident cases for men, which were predicted to reach 5.93 million in 2039 (Figure 6A). According to the Nordpred model, the incident cases for both men and women would continue to increase from 2020 to 2039, with the rates close to the optimistic reference (Figure 7A). The total prevalent cases and total YLDs for men only exhibited similar trends. Notably, the BAPC model predicated that the number of male osteoarthritis patients would exceed that of female osteoarthritis patients in 2039.
Discussion
The present study describes the long-term trends and projections of osteoarthritis burden in China based on GBD 2019. Overall, osteoarthritis prevalence, incidence, and YLDs increased in China from 1990 to 2019. Similar trends of increasing osteoarthritis burden were observed in other countries and regions. For example, the prevalence of osteoarthritis in India, which has the second largest population in the world, a size close to that of China, has increased from 23.46 million in 1990 to 62.35 million in 2019 [21]. In the Middle East and North Africa, which have a different sociodemographic character from China, knee osteoarthritis increased 2.88-fold [32], hip osteoarthritis increased 3.1-fold [33] and hand osteoarthritis increased 2.7-fold [34], from 1990 to 2019.
The results of the joinpoint analysis revealed that, in China, the total prevalence, incidence, and YLDs increased substantially from 1990 to 2019, and the ASP, incidence, and YLDs increased with fluctuation. A longitudinal study based on Beijing Medical Claim Data for Employees reported that the 10-year average ASP and incidence of knee osteoarthritis were 4.6% and 25.2 per 1000 person-years, respectively [13]. Another longitudinal study based on the China Health and Retirement Longitudinal Study reported the cumulative incidence of symptomatic knee osteoarthritis among middle-aged and older Chinese adults was 8.5% [35]. Our findings corroborate this previous study. Interestingly, our results showed a significant increase in ASP, incidence, and YLDs in both men and women from 2000 to 2005, which may be a result of complex factors including an economic boom and income inequality [36], an obesity epidemic [37,38], longer life expectancy [39], an aging population [40], an increase in public health awareness, and medical system reform.
The burden of osteoarthritis has been reported to vary with age [41]; the GBD 2019 study provided age-specific data on osteoarthritis (over 30 years old). In our study, we also investigated the trends of how osteoarthritis varies with age in China. Our results indicated that the incidence and total incident cases of osteoarthritis peaked in the population aged approximately 50 years old. However, the prevalence of osteoarthritis peaked in the population aged over 90 years old, because osteoarthritis is a non-fatal disease. This contrasts with findings from a study by Tang et al, who reported that the prevalence of symptomatic knee osteoarthritis increased with age until the age of 70, and then leveled off [42]. The different data sources of the GBD study might account for this discrepancy. The total prevalent cases of osteoarthritis peaked in the population aged about 60 years old, likely due to a combination of the high incidence and large population base of individuals aged 60 years [35]. Consequently, for older patients, focusing on the treatment of osteoarthritis and improving their life quality may be necessary and efficient. For individuals aged 50 or younger, focusing on primary and secondary prevention strategies for osteoarthritis is more likely to be effective for alleviating the disease burden.
The burden of osteoarthritis in China showed a positive correlation with SDI. This correlation is consistent with findings from a previous study, which demonstrated that the observed burden estimates of osteoarthritis in high-income regions, such as in the USA, were higher than the expected level [2]. As an indicator of development of countries or other geographic areas, an increase in SDI indicates longer life expectancy and better health care. In fact, the number of health technicians per thousand people increased form 3.45 in 1990 to 7.26 in 2019 in China [11]. Changes in various risk factors such as high body mass index rate and social and occupational risk factors may also contribute to the correlation. Therefore, when implementing preventive measures, the correlation between osteoarthritis and SDI should also be taken into account.
BAPC and Nordpred models are commonly used in projecting disease burden [26,27]. We first validated the accuracy of the 2 models using data from 1990 to 2019. Since osteoarthritis prevalence varied with sex [42], the burden of osteoarthritis was calculated separately for men and women. The findings indicated that the BAPC model is more accurate in projecting the osteoarthritis burden for women and both sexes than for men. Meanwhile, the projection error rates of the Nordpred model showed less variation. Thus, the results of both models are presented. Overall, osteoarthritis is more prevalent in women than in men, and the total number of prevalent cases, incident cases, and YLDs are expected to continue increasing over the next 2 decades. However, the increase of osteoarthritis burden for women is projected to slow down and might peak in 2029. According to the results of the BAPC model, the osteoarthritis burden for men is expected to increase rapidly during the next 20 years. This increase would result in the total number of prevalent cases and YLDs for men surpassing that of women by 2039. Notably, China’s sex ratio at birth remained over 120 (120 males for every 100 females) from 2000 to 2010 but has recently started to decline [43]. If the sex ratio remains imbalanced, despite higher osteoarthritis incidence and prevalence in women, the total number of incident cases and prevalent cases may reverse.
There are several limitations to this study. First, the data utilized in this research were collected from the GBD 2019 study, which is modeled data [18]. Consequently, the accuracy of GBD results relies on the quality of the primary data source. Although improvements in data processing and modeling methods, such as DisMod-MR 2.1, may enhance the precision of GBD estimations, substantial advancements require more comprehensive and improved primary data-gathering efforts. In addition, GBD 2019 did not include osteoarthritis data for individuals under 30 years of age; however, a notable increase in prevalence was reported in people under 35 years of age [13]. Secondly, we only analyzed the long-term trend of osteoarthritis by age and sex, but the prevalence of osteoarthritis also exhibits geographic variations [14], including differences between rural and urban areas [42]. Thirdly, the projection results should be treated with caution because they were calculated based on GBD 2019 data, but the COVID-2019 pandemic may have impacted the management of osteoarthritis since 2019 [44].
Conclusions
This study analyzed long-term trends in osteoarthritis epidemiology in China. From 1990 to 2019, osteoarthritis prevalence, incidence, and YLDs increased significantly, and may continue increasing during the next 2 decades, varying according to sex and age. Additionally, osteoarthritis epidemiology is also affected by SDI. Preventive health policies should be constructed to target women, middle-aged individuals, and the elderly to alleviate the osteoarthritis burden.
Figures
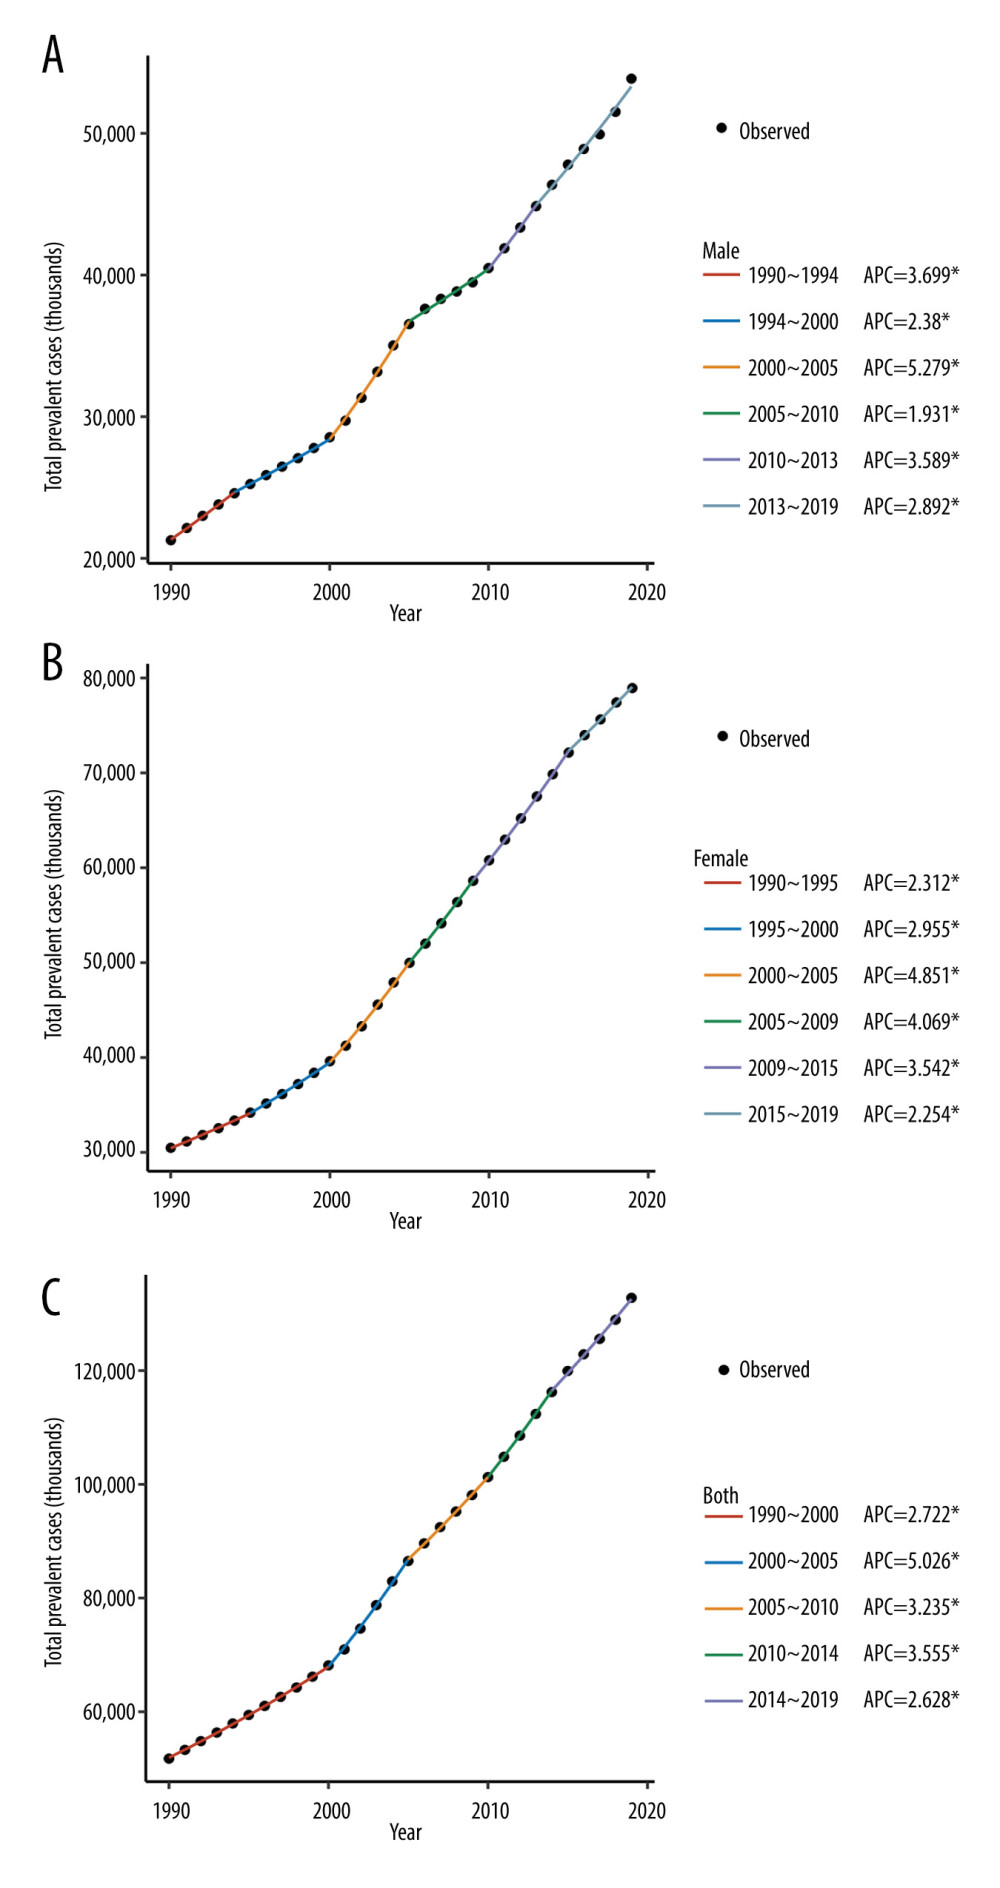 Figure 1. Temporal trend of osteoarthritis prevalence in China from 1990 to 2019 for men (A), women (B), and both sexes (C). * Indicates that the annual percent change (APC) is significantly different from zero. (Created by R software, version 4.2.1, R Foundation for Statistical Computing).
 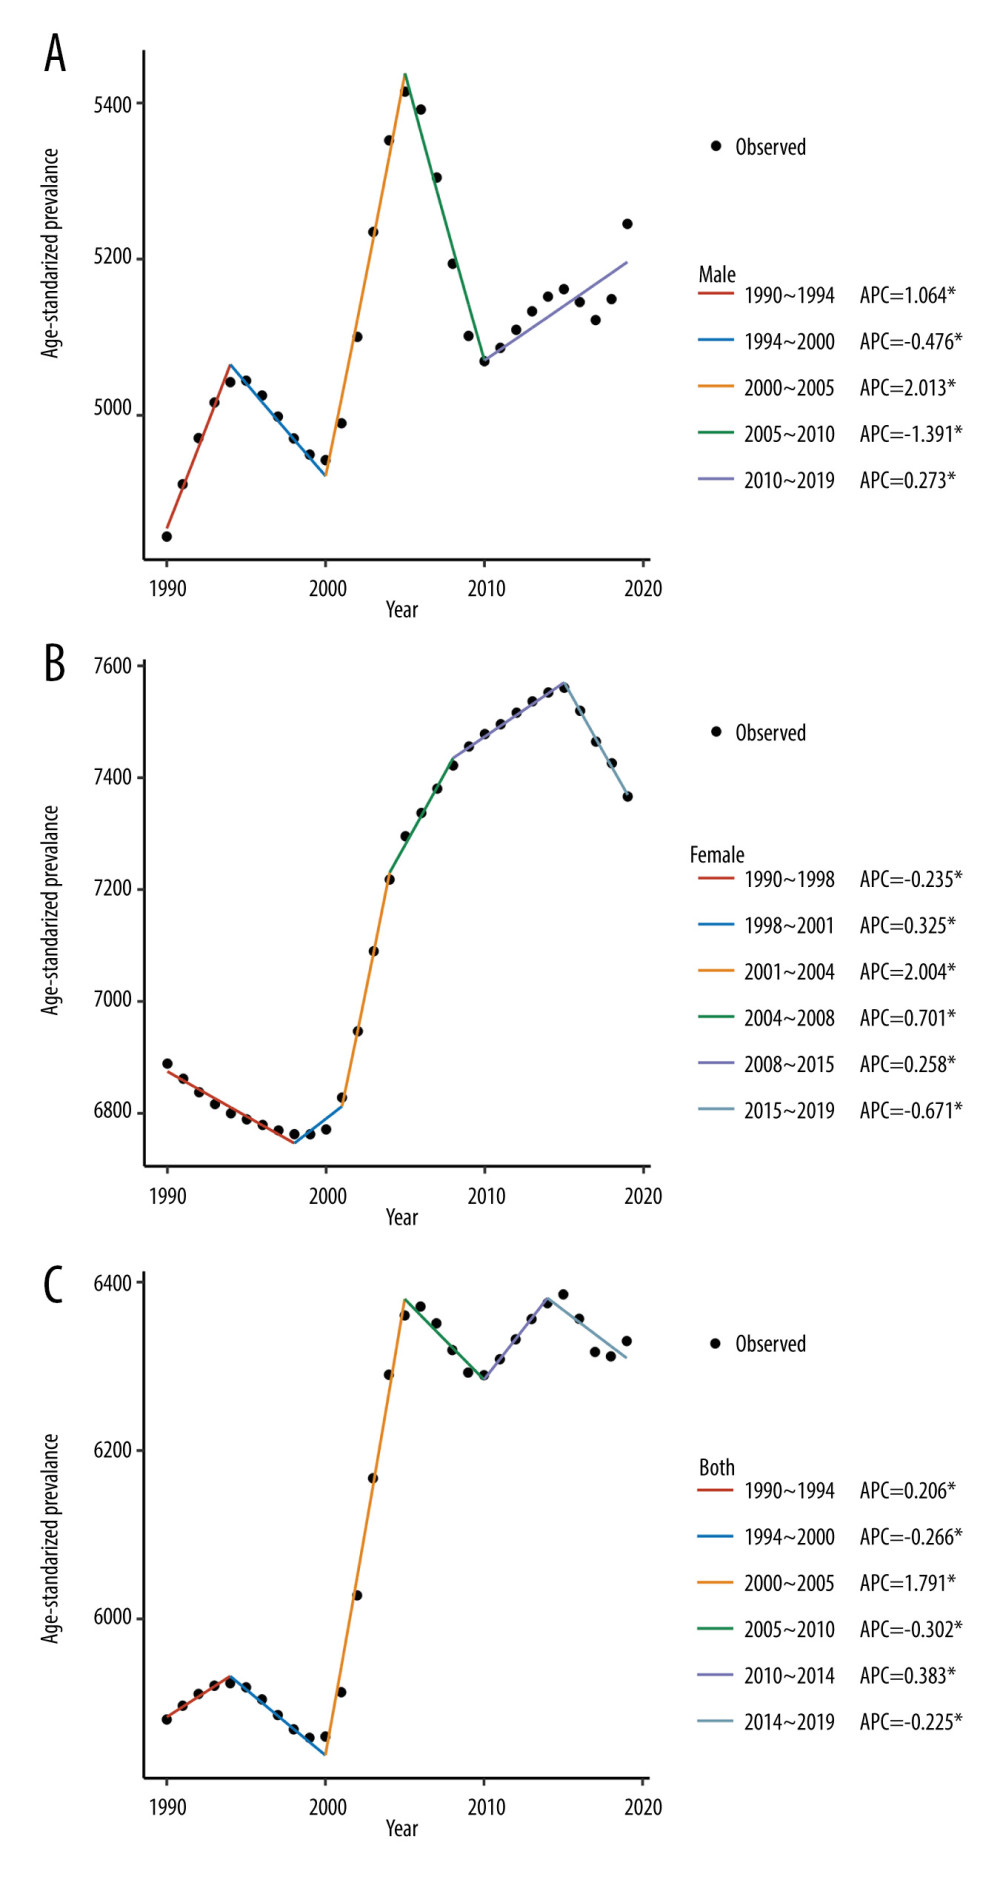 Figure 2. Temporal trend of age-standardized prevalence of osteoarthritis in China from 1990 to 2019 for men (A), women (B), and both sexes (C). * Indicates that the annual percent change (APC) is significantly different from zero. (Created by R software, version 4.2.1, R Foundation for Statistical Computing).
 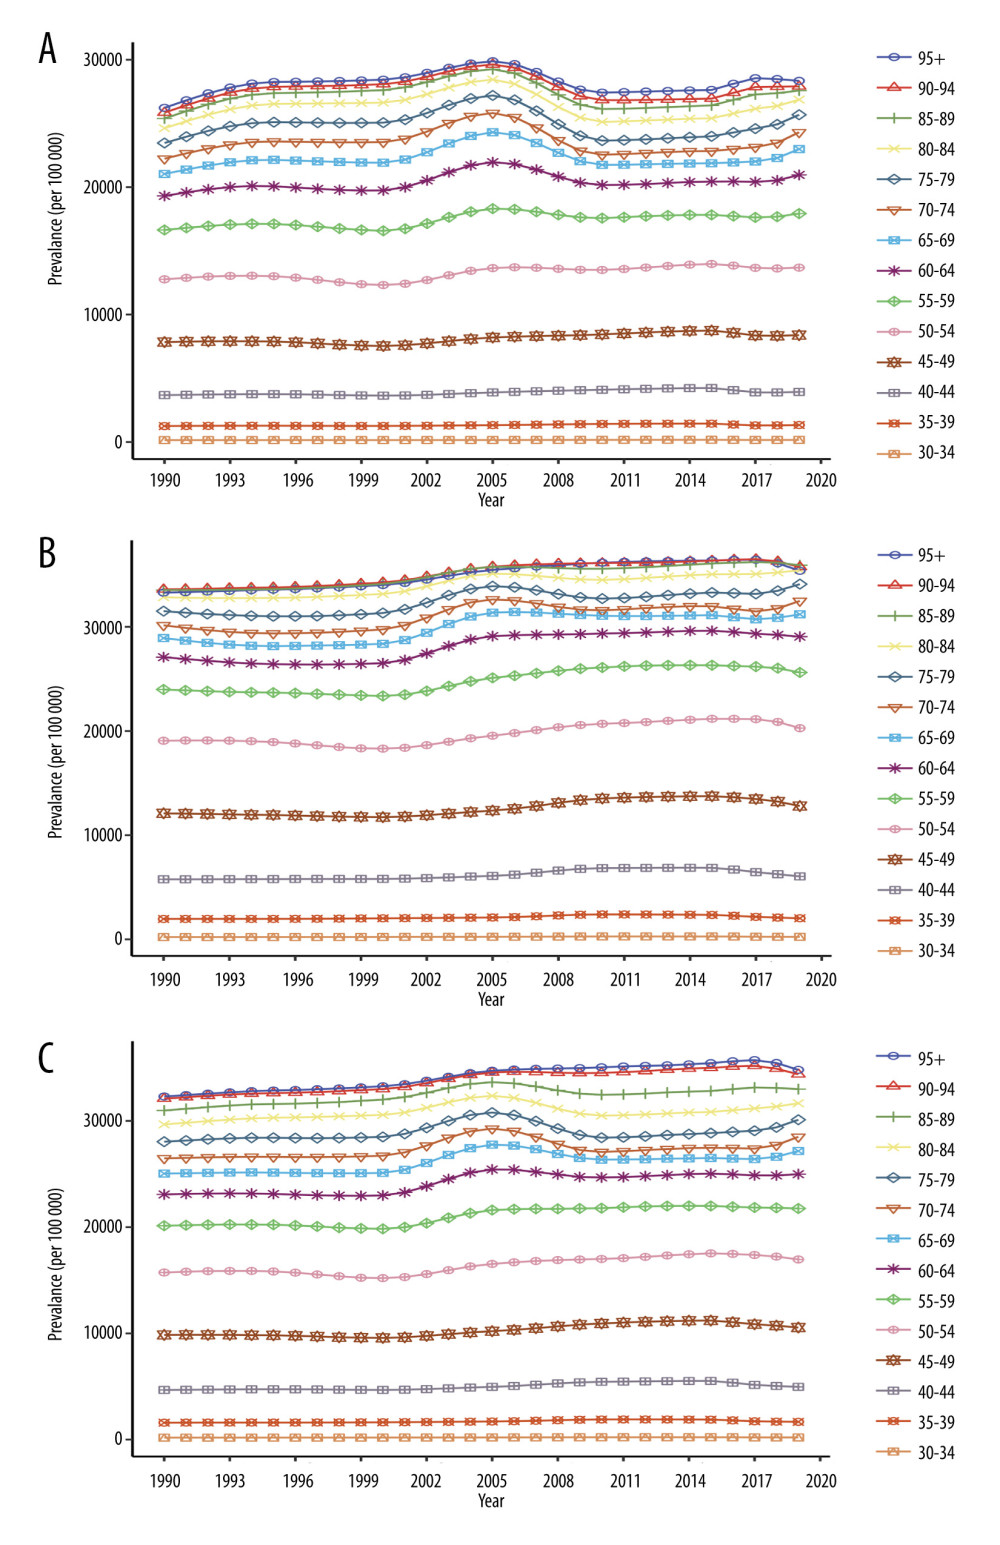 Figure 3. Long-term trends of age-specific variation of osteoarthritis prevalence in China from 1990 to 2019 for men (A), women (B), and both sexes (C). (Created by R software, version 4.2.1, R Foundation for Statistical Computing).
 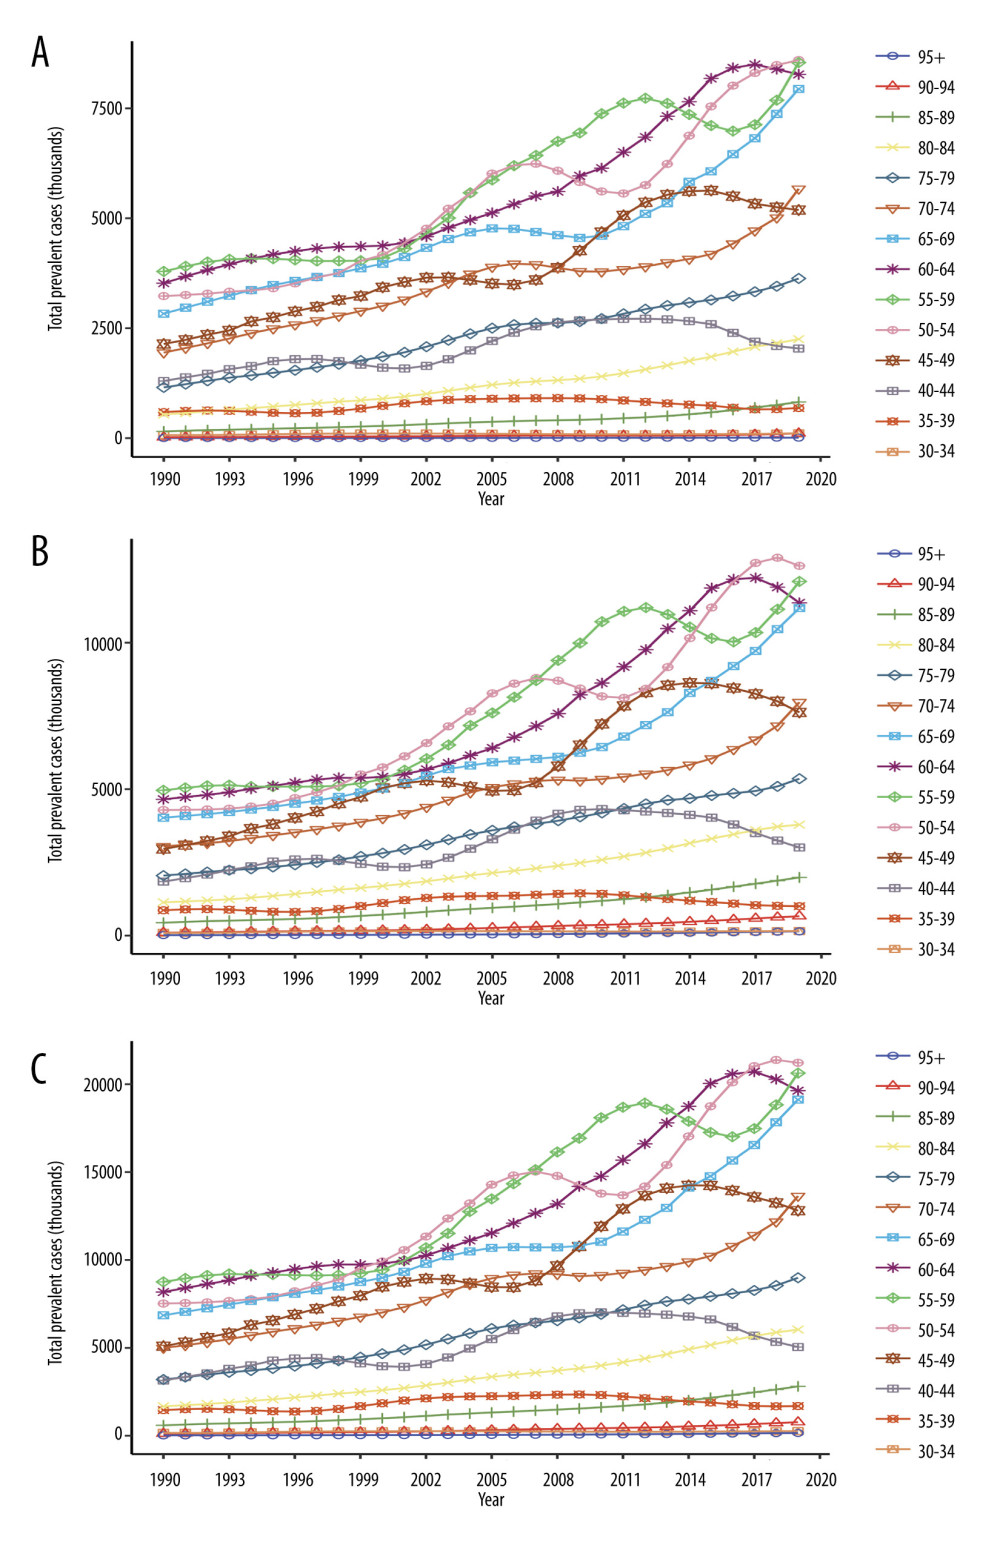 Figure 4. Long-term trends of age-specific variation of total prevalent cases of osteoarthritis in China from 1990 to 2019 for men (A), women (B), and both sexes (C). (Created by R software, version 4.2.1, R Foundation for Statistical Computing).
 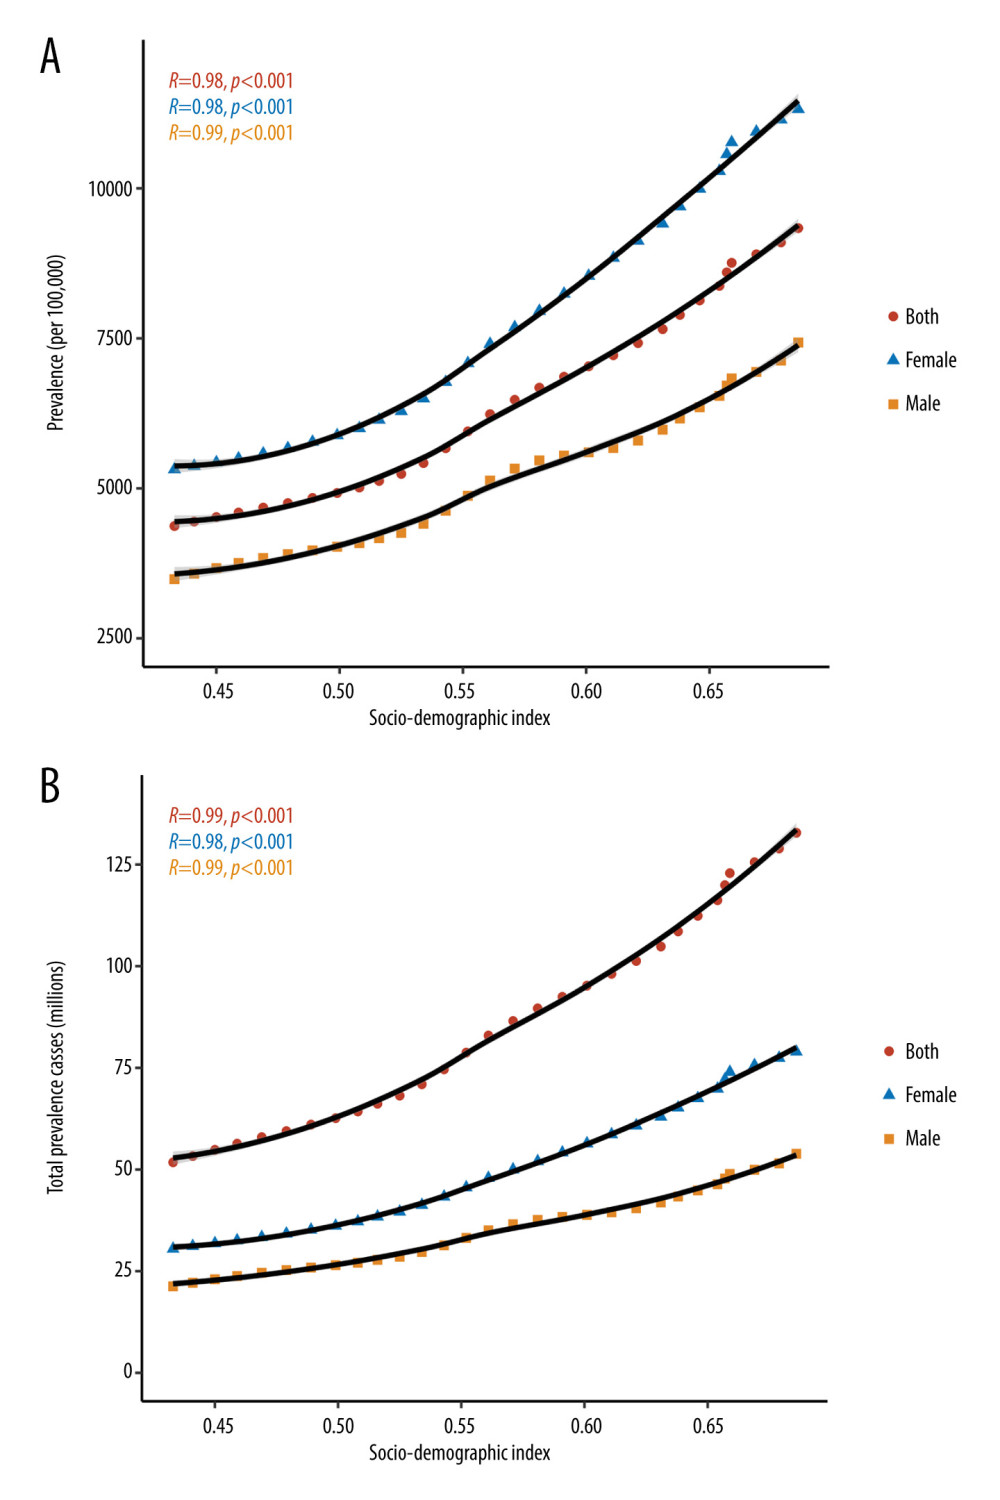 Figure 5. Correlation between the burden of osteoarthritis and SDI from 1990 to 2019. Correlation between (A) osteoarthritis prevalence and SDI; and (B) total prevalent cases and SDI. SDI – sociodemographic index of China. (Created by R software, version 4.2.1, R Foundation for Statistical Computing).
 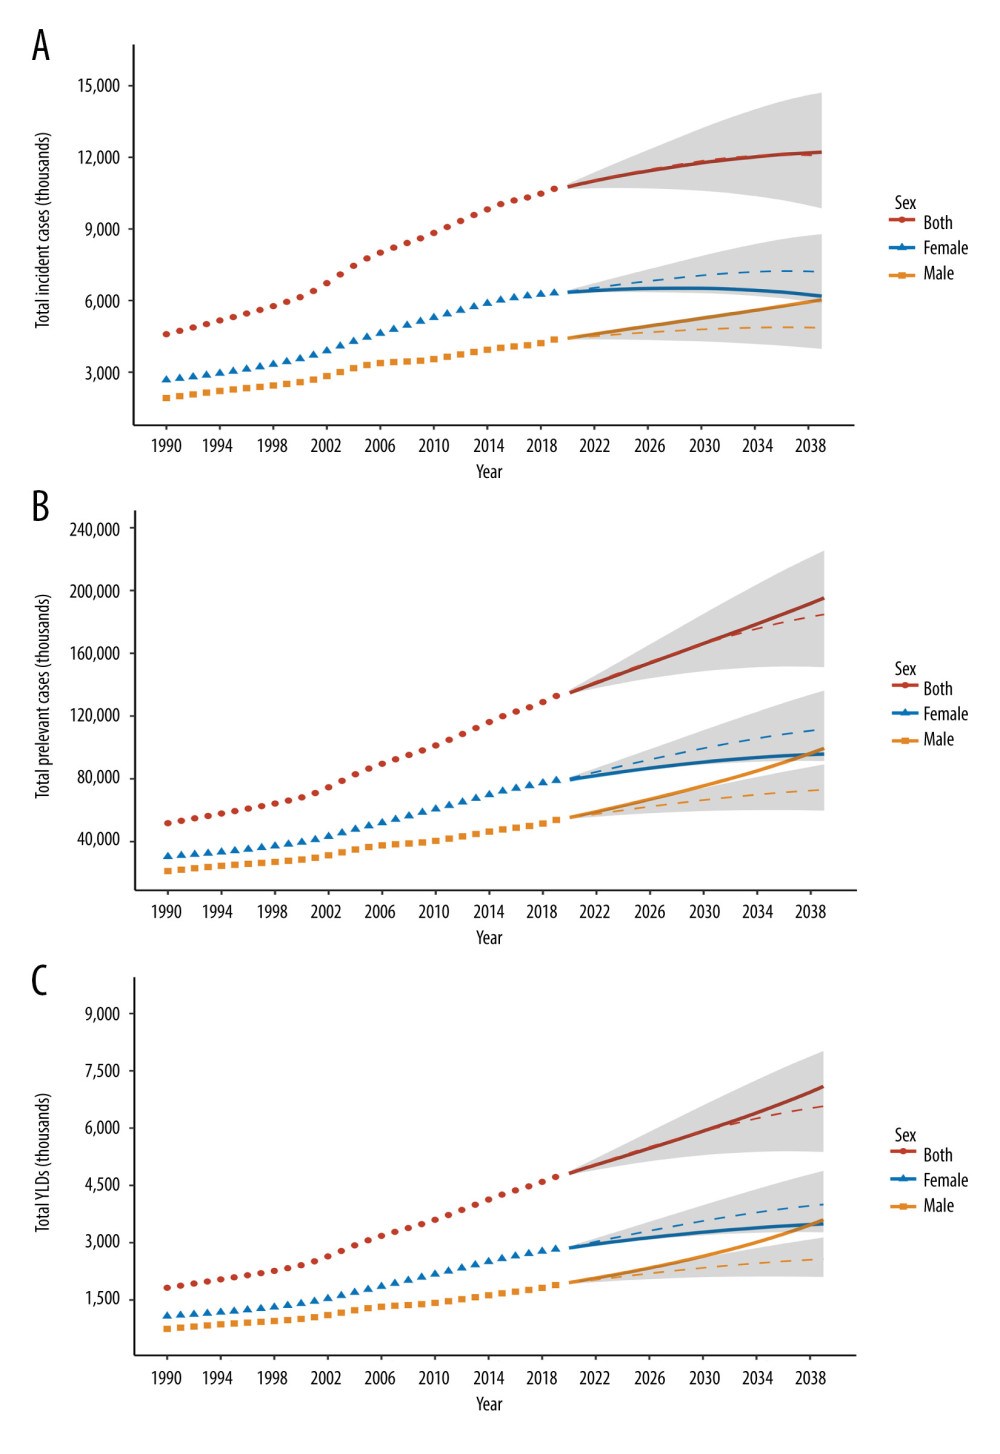 Figure 6. BAPC projections of osteoarthritis burden by sex in China. Trends for total incident cases (A), total prevalent cases (B), and total YLDs (C). The dotted line refers to the observed value (before 2019) and the solid line refers to the projected value (after 2019). The shading indicates whether the rate remained stable (baseline reference), decreased by 1% per year (lower limit), or increased by 1% per year (upper limit). YLDs – years lived with disability, BAPC – Bayesian age-period-cohort. (Created by R software, version 4.2.1, R Foundation for Statistical Computing).
 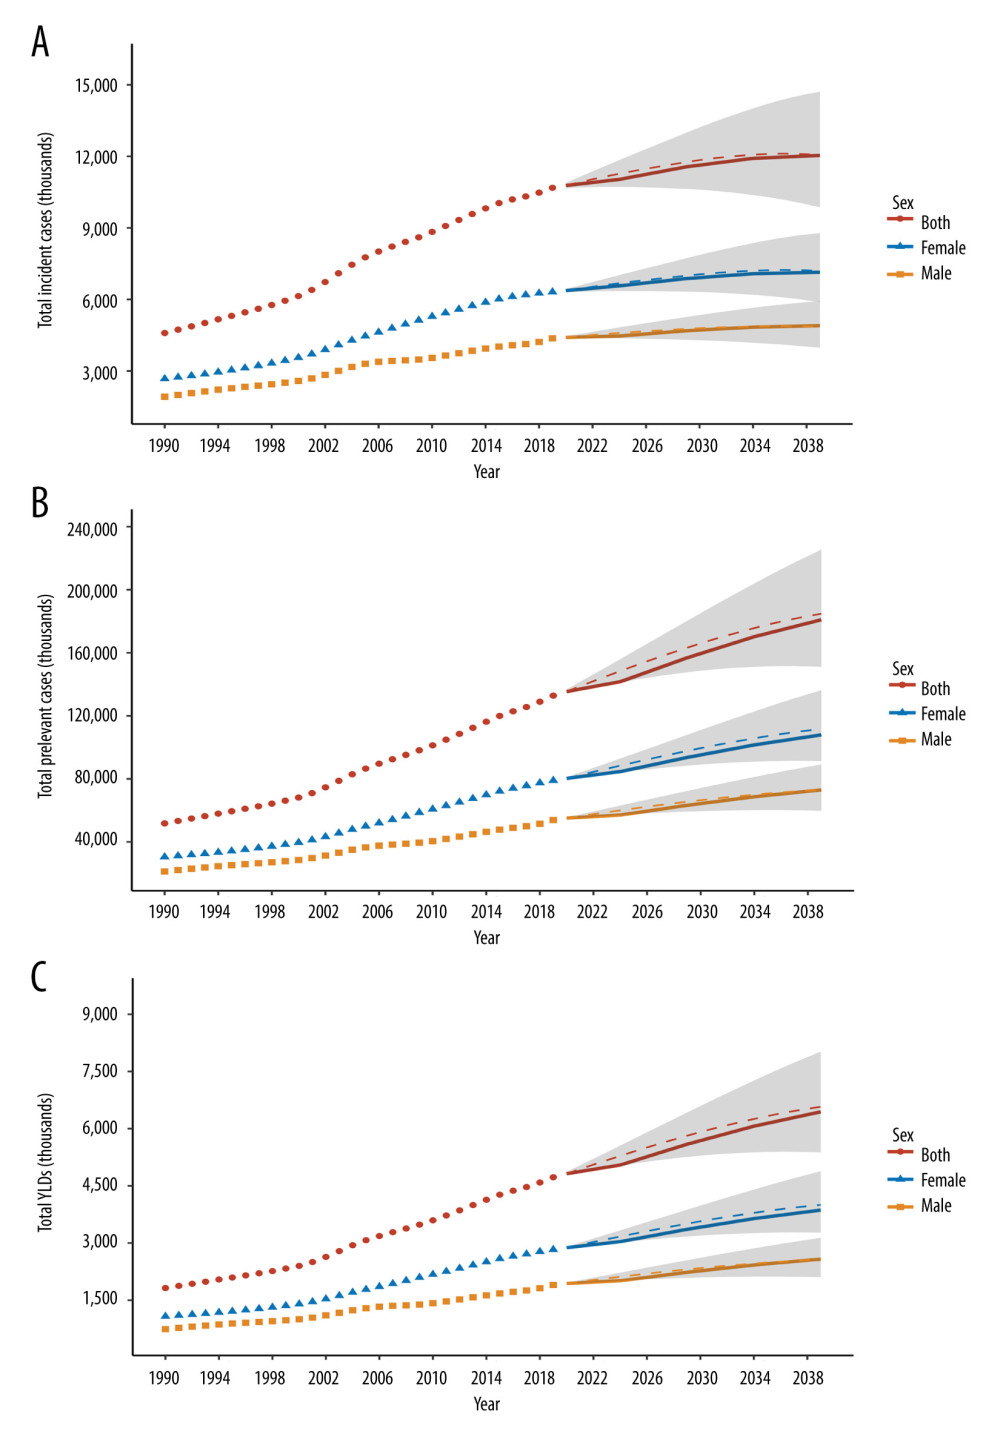 Figure 7. Nordpred projections of osteoarthritis burden by sex in China. Trends for total incident cases (A), total prevalent cases (B), and total YLDs (C). The dotted line refers to the observed value (before 2019) and the solid line refers to the projected value (after 2019). The shading indicates whether the rate remained stable (baseline reference), decreased by 1% per year (lower limit), or increased by 1% per year (upper limit). YLDs – years living with disability, BAPC – Bayesian age-period-cohort. (Created by R software, version 4.2.1, R Foundation for Statistical Computing).
 Tables
Table 1. Number and age-standardized rate of osteoarthritis prevalence, incidence, and YLDs in China in 1990, 2005, and 2019.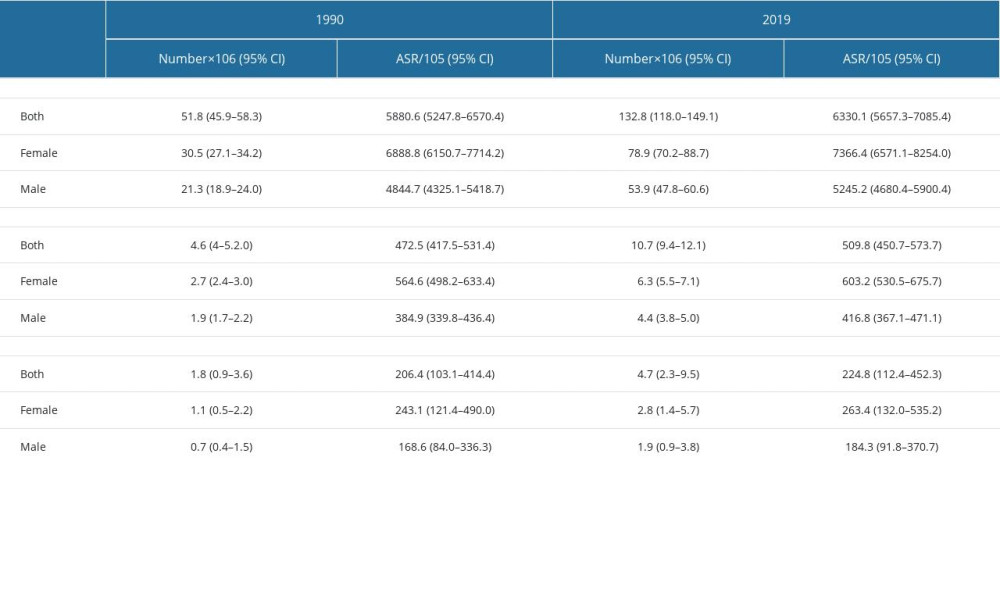 Supplementary Table 1. Socialdemographic index for China from 1990 to 2019.
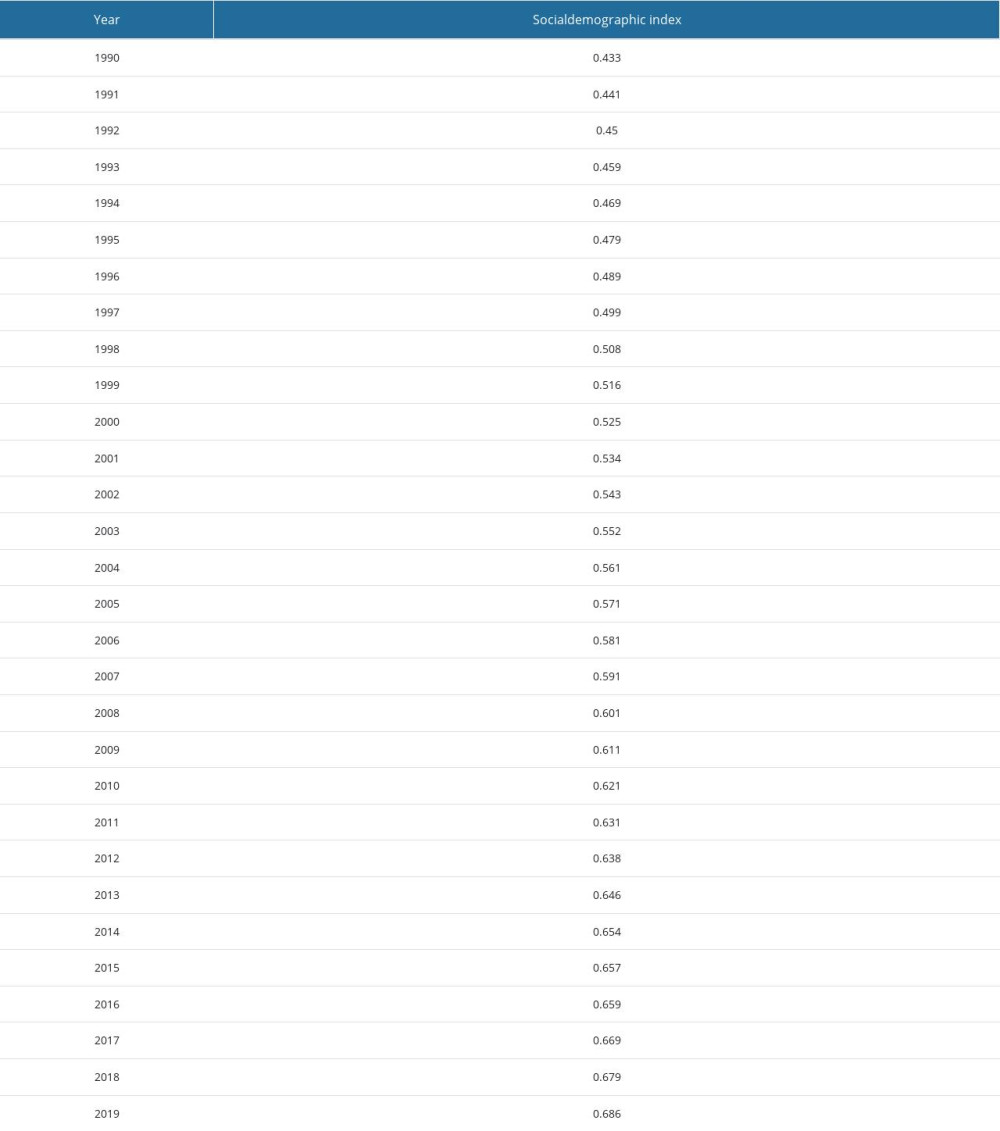 Supplementary Table 2. Annual percent changes (APCs) and average annual percent changes (AAPCs) of osteoarthritis prevalence in China from 1990 to 2019.
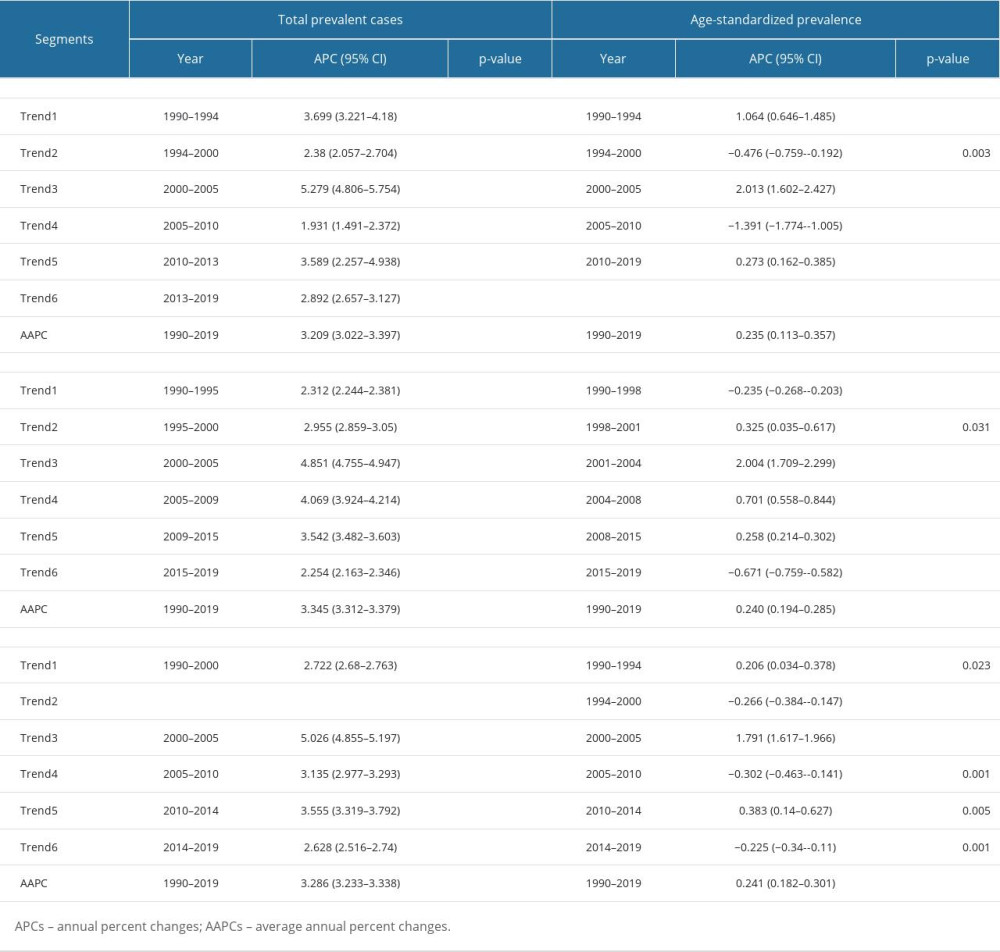 Supplementary Table 3. Annual percent changes (APCs) and average annual percent changes (AAPCs) of osteoarthritis incidence in China from 1990 to 2019.
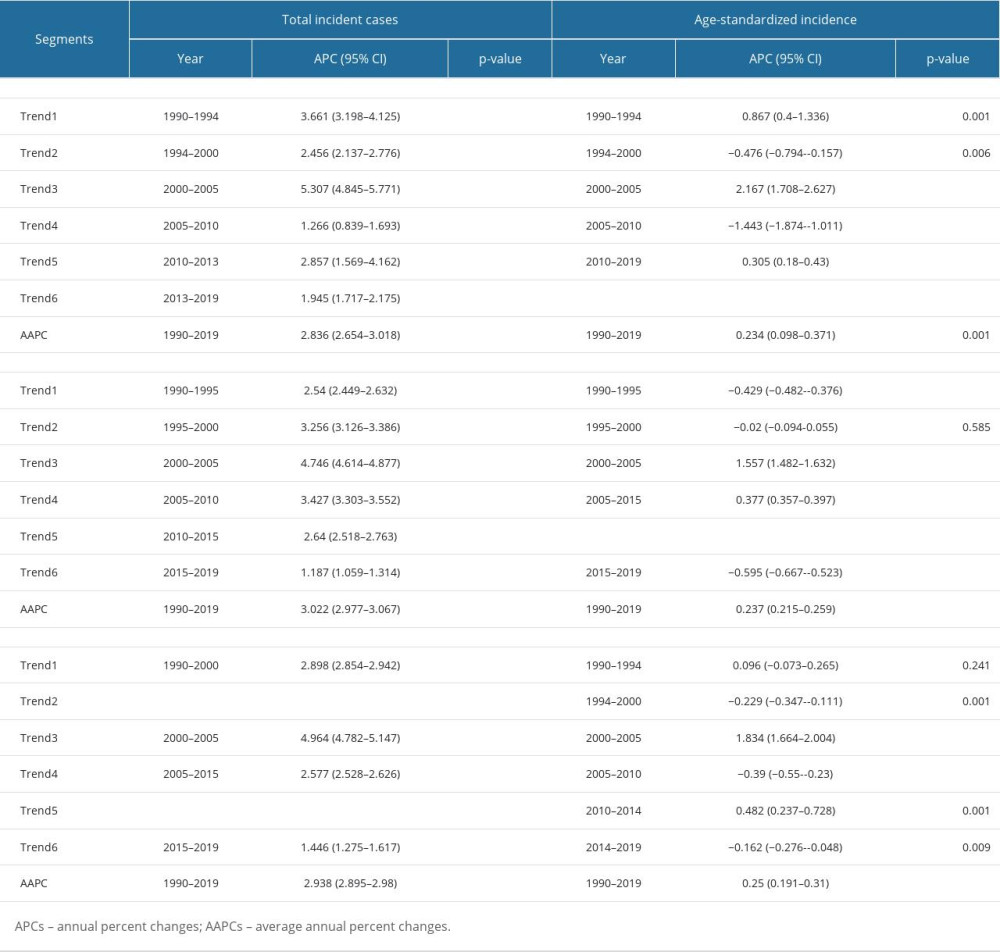 Supplementary Table 4. Annual percent changes (APCs) and average annual percent changes (AAPCs) of osteoarthritis years lived with disability (YLDs) in China from 1990 to 2019.
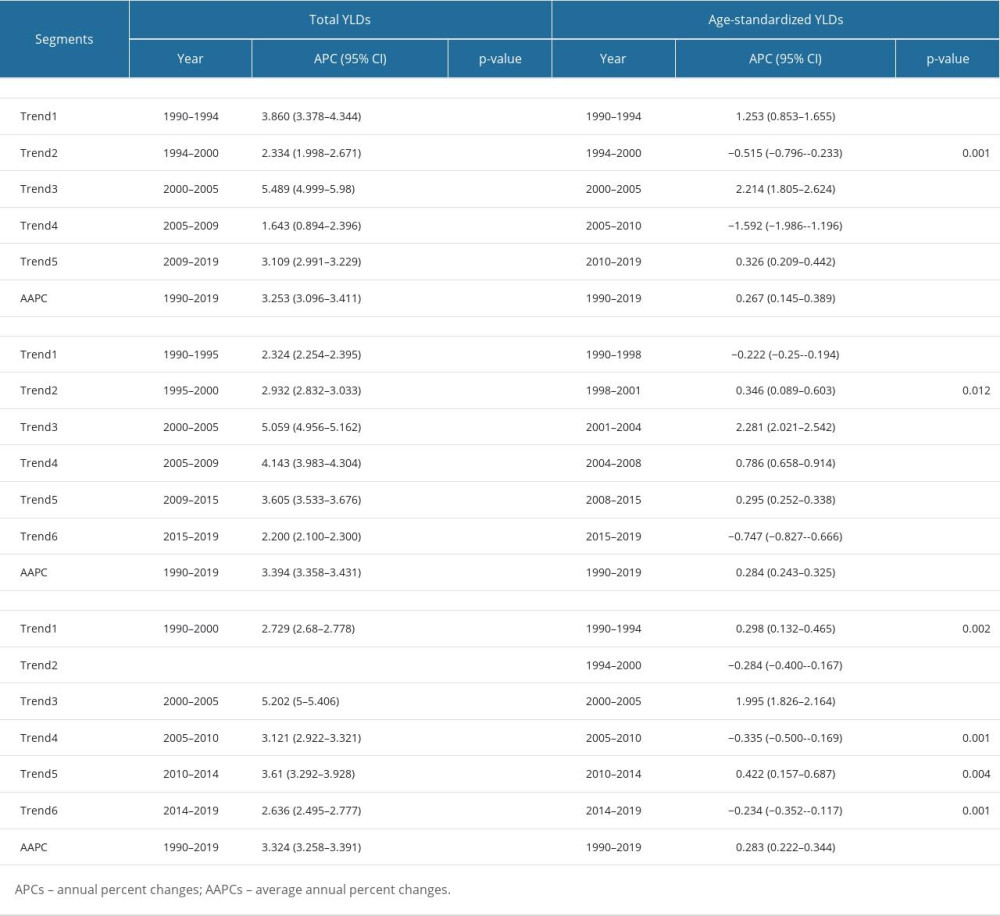
References
1. Allen KD, Thoma LM, Golightly YM, Epidemiology of osteoarthritis: Osteoarthr Cartilage, 2022; 30(2); 184-95
2. Safiri S, Kolahi AA, Smith E, Global, regional and national burden of osteoarthritis 1990–2017: A systematic analysis of the Global Burden of Disease Study 2017: Ann Rheum Dis, 2020; 79(6); 819-28
3. Bortoluzzi A, Furini F, Scirè CA, Osteoarthritis and its management – epidemiology, nutritional aspects and environmental factors: Autoimmun Rev, 2018; 17(11); 1097-104
4. Katz JN, Arant KR, Loeser RF, Diagnosis and treatment of hip and knee osteoarthritis: JAMA, 2021; 325(6); 568-78
5. Sharma L, Solomon CG, Solomon CG, Osteoarthritis of the knee: New England J Med, 2021; 384(1); 51-59
6. Long H, Liu Q, Yin H, Prevalence trends of site-specific osteoarthritis from 1990 to 2019: findings from the Global Burden of Disease Study 2019: Arthritis Rheumatol, 2022; 74(7); 1172-83
7. Hunter DJ, Bierma-Zeinstra S, Osteoarthritis: Lancet, 2019; 393(10182); 1745-59
8. Yang G, Wang Y, Zeng Y, Rapid health transition in China, 1990–2010: Findings from the Global Burden of Disease Study 2010: Lancet, 2013; 381(9882); 1987-2015
9. Zhou M, Wang H, Zhu J, Cause-specific mortality for 240 causes in China during 1990–2013: a systematic subnational analysis for the Global Burden of Disease Study 2013: Lancet, 2016; 387(10015); 251-72
10. Chen L, Wang L, Qian Y, Chen H, Changes and trend disparities in life expectancy and health-adjusted life expectancy attributed to disability and mortality from 1990 to 2019 in China: Front Public Health, 2022; 10; 925114
11. National Bureau of Statistics of China: China statistical yearbook 2021 https://www.stats.gov.cn/sj/ndsj/2021/indexch.htm
12. Sun X, Yan AF, Shi Z, Health consequences of obesity and projected future obesity health burden in China: Obesity, 2022; 30(9); 1724-51
13. Chen H, Wu J, Wang Z, Trends and patterns of knee osteoarthritis in China: A longitudinal study of 17.7 million adults from 2008 to 2017: Int J Environ Res Public Heaelth, 2021; 18(16); 8864
14. Long H, Zeng X, Liu Q, Burden of osteoarthritis in China, 1990–2017: Findings from the Global Burden of Disease Study 2017: Lancet Rheumatol, 2020; 2(3); e164-e72
15. Steinmetz JD, Culbreth GT, Haile LM, Global, regional, and national burden of osteoarthritis, 1990–2020 and projections to 2050: A systematic analysis for the Global Burden of Disease Study 2021: Lancet Rheumatol, 2023; 5(9); e508-e22
16. Institute for Health Metrics and Evaluation: GBD results tool https://vizhub.healthdata.org/gbd-results/
17. Institute for Health Metrics and Evaluation: SDI data source https://ghdx.healthdata.org/record/ihme-data/gbd-2019-socio-demographic-index-sdi-1950-2019
18. GBD 2019 Diseases and Injuries Collaborators, Global burden of 369 diseases and injuries in 204 countries and territories, 1990–2019: A systematic analysis for the Global Burden of Disease Study 2019: Lancet, 2020; 396(10258); 1204-22 published correction appears in Lancet. 2020;396(10262):1562
19. Murray CJL, Lopez AD, Measuring the global burden of disease: New England J Med, 2013; 369(5); 448-57
20. Kellgren JH, Lawrence JS, Radiological assessment of osteo-arthrosis: Ann Rheum Dis, 1957; 16(4); 494-502
21. Singh A, Das S, Chopra A, Burden of osteoarthritis in India and its states, 1990–2019: Findings from the Global Burden of disease study 2019: Osteoarthr Cartilage, 2022; 30(8); 1070-78
22. Institute for Health Metrics and Evaluation: GBD 2019 Data input sources tool http://ghdx.healthdata.org/gbd-2019/data-input-sources
23. Jin X, Ren J, Li R, Global burden of upper respiratory infections in 204 countries and territories, from 1990 to 2019: EClinicalMedicine, 2021; 37; 100986
24. Kim H, Fay MP, Feuer EJ, Midthune DN, Permutation tests for joinpoint regression with applications to cancer rates: Stat Med, 2000; 19(3); 335-51
25. Wu D, Wong P, Guo C, Pattern and trend of five major musculoskeletal disorders in China from 1990 to 2017: Findings from the Global Burden of Disease Study 2017: BMC Med, 2021; 19(1); 34
26. Yue T, Xu M, Cai T, Gender disparity and temporal trend of liver cancer in China from 1990 to 2019 and predictions in a 25-year period: Front Public Health, 2022; 10; 956712
27. Huang J, Li H, Yan H, Li FX, Tang M, Lu DL, The comparative burden of brain and central nervous system cancers from 1990 to 2019 between China and the United States and predicting the future burden: Front Public Health, 2022; 10; 1018836
28. Hu W, Fang L, Zhang H, Ni R, Pan G, Global disease burden of COPD from 1990 to 2019 and prediction of future disease burden trend in China: Public Health, 2022; 208; 89-97
29. Li S, Chen H, Man J, Changing trends in the disease burden of esophageal cancer in China from 1990 to 2017 and its predicted level in 25 years: Cancer Med, 2021; 10(5); 1889-99
30. Institute for Health Metrics and Evaluation: Population data source https://ghdx.healthdata.org/record/ihme-data/global-population-forecasts-2017-2100
31. Wang H, Global age-sex-specific fertility, mortality, healthy life expectancy (HALE), and population estimates in 204 countries and territories, 1950–2019: A comprehensive demographic analysis for the Global Burden of Disease Study 2019: Lancet, 2020; 396(10258); 1160-203
32. Hoveidaei AH, Nakhostin-Ansari A, Chalian M, Burden of knee osteoarthritis in the Middle East and North Africa (MENA): An epidemiological analysis from 1990 to 2019: Arch Orthop Traum Surg, 2023; 143(10); 6323-33
33. Hoveidaei AH, Nakhostin-Ansari A, Hosseini-Asl SH, Increasing burden of hip osteoarthritis in the Middle East and North Africa (MENA): An epidemiological analysis from 1990 to 2019: Arch Orthop Trauma Surg, 2023; 143(6); 3563-73
34. Hoveidaei AH, Nakhostin-Ansari A, Chalian M, Burden of hand osteoarthritis in the Middle East and North Africa (MENA): An epidemiological analysis from 1990 to 2019: J Hand Surg Am, 2023; 48(3); 245-56
35. Ren Y, Hu J, Tan J, Incidence and risk factors of symptomatic knee osteoarthritis among the Chinese population: Analysis from a nationwide longitudinal study: BMC Public Health, 2020; 20(1); 1491
36. Luo W, Xie Y, Economic growth, income inequality and life expectancy in China: Soc Sci Med, 2020; 256; 113046
37. Liu M, Jin F, Yao X, Zhu Z, Disease burden of osteoarthritis of the knee and hip due to a high body mass index in China and the USA: 1990–2019 findings from the global burden of disease study 2019: Bmc Musculoskel Dis, 2022; 23(1); 63
38. Wolf J, França EB, Assunção AÁ, The burden of low back pain, rheumatoid arthritis, osteoarthritis, and gout and their respective attributable risk factors in Brazil: Results of the GBD 2017 study: Rev Soc Bras Med Tro, 2022; 55(Suppl 1); e0285
39. Chen H, Qian Y, Dong Y, Patterns and changes in life expectancy in China, 1990–2016: PLoS One, 2020; 15(4); e0231007
40. Wang MY, Sung HC, Liu JY, Population aging and its impact on human wellbeing in China: Front Public Health, 2022; 10; 883566
41. Cui A, Li H, Wang D, Zhong J, Chen Y, Lu H, Global, regional prevalence, incidence and risk factors of knee osteoarthritis in population-based studies: EClinicalMedicine, 2020; 29–30; 100587
42. Tang X, Wang S, Zhan S, the prevalence of symptomatic knee osteoarthritis in China: Results from the China health and retirement longitudinal study: Arthritis Rheumatol, 2016; 68(3); 648-53
43. Jiang Q, Zhang C, Recent sex ratio at birth in China: BMJ Glob Health, 2021; 6(5); e005438
44. Ragni E, Mangiavini L, Viganò M, Management of osteoarthritis during the COVID-19 pandemic: Clin Pharmacol Ther, 2020; 108(4); 719-29
Figures
Figure 1. Temporal trend of osteoarthritis prevalence in China from 1990 to 2019 for men (A), women (B), and both sexes (C). * Indicates that the annual percent change (APC) is significantly different from zero. (Created by R software, version 4.2.1, R Foundation for Statistical Computing).Figure 2. Temporal trend of age-standardized prevalence of osteoarthritis in China from 1990 to 2019 for men (A), women (B), and both sexes (C). * Indicates that the annual percent change (APC) is significantly different from zero. (Created by R software, version 4.2.1, R Foundation for Statistical Computing).Figure 3. Long-term trends of age-specific variation of osteoarthritis prevalence in China from 1990 to 2019 for men (A), women (B), and both sexes (C). (Created by R software, version 4.2.1, R Foundation for Statistical Computing).Figure 4. Long-term trends of age-specific variation of total prevalent cases of osteoarthritis in China from 1990 to 2019 for men (A), women (B), and both sexes (C). (Created by R software, version 4.2.1, R Foundation for Statistical Computing).Figure 5. Correlation between the burden of osteoarthritis and SDI from 1990 to 2019. Correlation between (A) osteoarthritis prevalence and SDI; and (B) total prevalent cases and SDI. SDI – sociodemographic index of China. (Created by R software, version 4.2.1, R Foundation for Statistical Computing).Figure 6. BAPC projections of osteoarthritis burden by sex in China. Trends for total incident cases (A), total prevalent cases (B), and total YLDs (C). The dotted line refers to the observed value (before 2019) and the solid line refers to the projected value (after 2019). The shading indicates whether the rate remained stable (baseline reference), decreased by 1% per year (lower limit), or increased by 1% per year (upper limit). YLDs – years lived with disability, BAPC – Bayesian age-period-cohort. (Created by R software, version 4.2.1, R Foundation for Statistical Computing).Figure 7. Nordpred projections of osteoarthritis burden by sex in China. Trends for total incident cases (A), total prevalent cases (B), and total YLDs (C). The dotted line refers to the observed value (before 2019) and the solid line refers to the projected value (after 2019). The shading indicates whether the rate remained stable (baseline reference), decreased by 1% per year (lower limit), or increased by 1% per year (upper limit). YLDs – years living with disability, BAPC – Bayesian age-period-cohort. (Created by R software, version 4.2.1, R Foundation for Statistical Computing). Tables
Table 1. Number and age-standardized rate of osteoarthritis prevalence, incidence, and YLDs in China in 1990, 2005, and 2019.Table 1. Number and age-standardized rate of osteoarthritis prevalence, incidence, and YLDs in China in 1990, 2005, and 2019.Supplementary Table 1. Socialdemographic index for China from 1990 to 2019.Supplementary Table 2. Annual percent changes (APCs) and average annual percent changes (AAPCs) of osteoarthritis prevalence in China from 1990 to 2019.Supplementary Table 3. Annual percent changes (APCs) and average annual percent changes (AAPCs) of osteoarthritis incidence in China from 1990 to 2019.Supplementary Table 4. Annual percent changes (APCs) and average annual percent changes (AAPCs) of osteoarthritis years lived with disability (YLDs) in China from 1990 to 2019. In Press
11 Mar 2024 : Clinical Research
Enhancement of Frozen-Thawed Human Sperm Quality with Zinc as a Cryoprotective AdditiveMed Sci Monit In Press; DOI: 10.12659/MSM.942946
12 Mar 2024 : Database Analysis
Risk Factors of Age-Related Macular Degeneration in a Population-Based Study: Results from SHIP-TREND-1 (St...Med Sci Monit In Press; DOI: 10.12659/MSM.943140
12 Mar 2024 : Clinical Research
Preoperative Blood Transfusion Requirements for Hemorrhoidal Severe Anemia: A Retrospective Study of 128 Pa...Med Sci Monit In Press; DOI: 10.12659/MSM.943126
12 Mar 2024 : Clinical Research
Tissue Inhibitors of Metalloproteinase 1 (TIMP-1) and 3 (TIMP-3) as New Markers of Acute Kidney Injury Afte...Med Sci Monit In Press; DOI: 10.12659/MSM.943500
Most Viewed Current Articles
17 Jan 2024 : Review article
Vaccination Guidelines for Pregnant Women: Addressing COVID-19 and the Omicron VariantDOI :10.12659/MSM.942799
Med Sci Monit 2024; 30:e942799
14 Dec 2022 : Clinical Research
Prevalence and Variability of Allergen-Specific Immunoglobulin E in Patients with Elevated Tryptase LevelsDOI :10.12659/MSM.937990
Med Sci Monit 2022; 28:e937990
16 May 2023 : Clinical Research
Electrophysiological Testing for an Auditory Processing Disorder and Reading Performance in 54 School Stude...DOI :10.12659/MSM.940387
Med Sci Monit 2023; 29:e940387
01 Jan 2022 : Editorial
Editorial: Current Status of Oral Antiviral Drug Treatments for SARS-CoV-2 Infection in Non-Hospitalized Pa...DOI :10.12659/MSM.935952
Med Sci Monit 2022; 28:e935952