27 June 2020: Clinical Research
Changes in the Intestinal Microbiota in Patients with Stage 5 Chronic Kidney Disease on a Low-Protein Diet and the Effects of Human to Rat Fecal Microbiota Transplantation
Shuning Jiang1ABE, Bing Wang2BCF, Tingting Sha1DE, Xia Li2ACG*DOI: 10.12659/MSM.921557
Med Sci Monit 2020; 26:e921557


Abstract
BACKGROUND: Dietary protein restriction is recommended for patients with stage 5 chronic kidney disease (CKD), or end-stage renal disease (ESRD). This study aimed to investigate the changes in the intestinal microbiota due to different dietary regimens in patients with stage 5 CKD and the effects of human to rat fecal microbiota transplantation.
MATERIAL AND METHODS: Second-generation high-throughput sequencing was used to analyze the amplifiers in the 16S rRNA V4 region in the intestinal microbiota of patients with stage 5 CKD and healthy individuals. The intestinal microbiota of patients with stage 5 CKD in the low-protein group and the healthy individual group was transferred by human to rat fecal microbiota transplantation using Sprague-Dawley rats. Data underwent meta-analysis using Meta-Stat.
RESULTS: Patients with CKD on a very low-protein diet showed an increase in intestinal Escherichia, Shigella, and Klebsiella, a decrease in Blautia, heat map analysis showed that Christensenellaceae R-7 group rs1 were significantly increased, and MetaStat analysis showed that Bacteroides, Prevotella, and Mitsuokella were significantly increased. Following human to rat fecal microbiota transplantation from patients with stage 5 CKD, the profile of the rat intestinal microbiota became similar to the human donors. The weight of the rats fed a very low-protein diet after fecal microbiota transplantation significantly decreased after six weeks compared with normal rats and rats that received normal fecal microbiota transplantation.
CONCLUSIONS: Patients with stage 5 CKD on a very low-protein diet showed changes in the intestinal microbiota that could be transferred from humans to rats by fecal microbiota transplantation.
Keywords: malnutrition, Renal Insufficiency, Chronic, Adipose Tissue, Bacteroides, Body Weight, Cholesterol, Clostridiales, Creatinine, Diet, Protein-Restricted, Escherichia, Fecal Microbiota Transplantation, Firmicutes, High-Throughput Nucleotide Sequencing, Kidney Failure, Chronic, Klebsiella, Prevotella, Sequence Analysis, RNA, Serum Albumin, Shigella, Triglycerides
Background
Patients with stage 5 chronic kidney disease (CKD), or end-stage renal disease (ESRD), experience internal biochemical changes, particularly in the intestine. These changes can be exacerbated by food, drugs, and other factors during the treatment process, resulting in shifts in the composition of intestinal microorganisms [1]. Previous studies have shown that stage 5 CKD can lead to disorders of the intestinal microbiota [2,3]. Compared with the intestinal microbiota of healthy humans, the quantity of intestinal microbiota in patients with stage 5 CKD is reduced [2,3]. Also, the number of probiotic microorganisms, such as
16S ribosomal RNA (16S rRNA) is one of the most suitable markers to determine bacterial phylogeny and taxonomic identification, and amplicon sequencing has become the most widely used method to study the composition and structure of microbial communities [4–6]. Amplicon sequencing can be used to study the intestinal microbiota of patients with stage 5 CKD with different diets to determine whether common dietary treatments result in differences in intestinal microbiota and whether the composition affects nutritional status.
Fecal microbiota transplantation is the main method to study the relationship between intestinal microbiota and corresponding clinical diseases, but the research is mostly limited to the same species. Cross-species fecal microbiota transplantation has rarely been described [7]. Based on the findings from a previous study [8], we previously reported the effects of compound antibiotics to remove their intestinal microbiota of rats and transplanted the intestinal microbiota from uremic patients [9,10].
Therefore, this study aimed to investigate the changes in the intestinal microbiota due to different dietary regimens in patients with stage 5 CKD and the effects of human to rat fecal microbiota transplantation.
Material and Methods
PATIENT ENROLMENT:
This study included 36 hospitalized patients (15 men and 21 women) with a mean age of 51.70±10.42 years who were diagnosed with stage 5 chronic kidney disease (CKD) between October 2015 to October 2017 in the Department of Nephrology at the Second Affiliated Hospital of Dalian Medical University. The primary cause of CKD included chronic glomerulonephritis (18 cases), benign hypertensive arteriolosclerosis (11 cases), nephrosclerosis (11 cases), polycystic nephropathy (4 cases), chronic pyelonephritis (1 case), gout nephropathy (1 case), and obstructive nephropathy (1 case). The control group included two men and two women with a mean age of 48±11.50 years. This study was approved by the Ethics Committee of the Second Affiliated Hospital of Dalian Medical University. Signed informed consent was obtained from all participants before the start of the study.
Subjects were excluded if they had a clinical infection of the respiratory tract, digestive tract, or urogenital system, liver disease, active autoimmune disease, a malignant tumor, metabolic or gastrointestinal disease, and severe proteinuria during the four weeks before enrolment. Subjects who had been treated with antibiotics or immunosuppressants in the previous three months were also excluded from the study [11].
STUDY GROUPS:
A normal diet was given to the normal control group (protein intake >1.2 g/kg/day). Patients with stage 5 chronic kidney disease (CKD) were assigned to one of three groups according to their dietary status. The RS2 group included patients on a normal diet (protein >1.2 g/kg/day). The RS3 group included patients on a very low-protein diet (protein <0.6 g/kg/day). The RS4 group included patients on a low-protein diet (0.8 g/kg/day > protein >0.6 g/kg/day). A dietitian made the diet plan for patients with stage 5 CKD and assessed their protein intake through diet review and 24-hour urine collection of albumin to guide them to adhere to their dietary therapy.
SPECIMEN COLLECTION:
For the study population, data on gender, age, height, and weight were recorded. All subjects fasted for 10 hours before venous blood sampling from the upper arm. The blood was centrifuged for 10 minutes at 3,000 rpm at room temperature. The supernatant was stored at −80°C for later analysis. Then, 5 gm of feces were collected from the study subjects in the early morning and cryopreserved in a freezer at −80°C for sequencing.
BIOCHEMICAL INDICES:
The malnutrition standard was albumin <3.8 g/dl, a body mass index (BMI) <23 kg/m2, a muscle volume with >10% decrease of upper arm muscle circumference. Blood creatinine and other biochemical indices were measured using the LABOSPECT008 automated biochemical analyzer (Hitachi, Tokyo, Japan).
POLYMERASE CHAIN REACTION (PCR):
Genomic DNA of the fecal samples was extracted by the sodium dodecyl sulfate (SDS) method, according to the instructions provided in the PowerSoil DNA kit (Mobio, Carlsbad, CA, USA). The polymerase chain reaction (PCR) was used to amplify all 40 isolated human fecal microbiome DNA extracts. The primers included 515F (5′-GTG CCA GCM GCC GCGGTA A-3′) and 806R (5′-GGA CTA CHV GGG TWTCTA AT-3′) that were used to amplify the 16S rRNA gene regions for the bacteria.
The PCR reactions were performed in 30 μL volumes with 15 μL of Phusion® High-Fidelity PCR Master Mix (Thermo Fisher Scientific, Waltham, MA, USA). The forward and reverse primers were used at a concentration of 0.2 μM, and template DNA was used at 10 ng. The initial denaturation was performed for 1 minute, and 30 denaturation cycles were performed (10 seconds per cycle) at 98°C. Annealing was performed for 30 seconds at 50°C and extended for 30 seconds at 72°C, and then for a further 5 minutes. Equivalent 1X buffer (SYB green) was mixed with the PCR product and electrophoresis was performed on a 2% agarose gel. Samples were selected with a width of 400–450 base pair (bp) main band for further experiments. The PCR products were mixed at an equal density ratio and purified using a GeneJET Gel Extraction Kit (Thermo Fisher Scientific, Waltham, MA, USA). The Illumina TruSeq DNA PCR-Free Library Preparation Kit was used for the sequencing library (Illumina, San Diego, CA, USA). The library quality was evaluated using the Qubit 2.0 Fluorometer (Thermo Fisher Scientific, Waltham, MA, USA). The library was then sequenced on an Illumina HiSeq platform to obtain 250 bp paired-end sequences.
The barcode sequence and PCR primer sequence were used to separate the sample data from the offline data, and the barcode and primer sequence were removed. Fast Length Adjustment of SHort reads (FLASH) version 1.2.7 software was used (http://ccb.jhu.edu/software/FLASH/) for each sample read for splicing. After strict filter processing, high-quality clean tags data were obtained [12,13]. Two operations were used from the Quantitative Insights into Microbial Ecology (QIIME) high-throughput bioinformatics, interception of tags, and tag length filtering. The interception of tags included the raw tags that were truncated from the low-quality base site where the continuous low-quality value base number (default quality threshold ≤19) reached the set length with a default length value of 3. Tag length filtering included the tag dataset obtained after the interception of the tags that were filtered with a continuous high-quality base length of <75% of the tag length.
The tags were removed and compared using the Genomes OnLine Database (GOLD) reference database to detect and remove the chimeric sequences to obtain the final effective tags. Each sample was read in pairs based on a unique bar code. The Quantitative Insights Into Microbial Ecology (QIIME) bioinformatics platform for microbiome analysis was used for sequence analysis, and internal Perl scripts were used to analyze the alpha in samples and beta diversity between samples, as previously described [14]. To further explore the data of microbial diversity differences between samples, statistical analysis methods were used for significance, including the t-test, MetaStat, Analysis of Similarities (ANOSIM), and the Multiple Response Permutation Procedure (MRPP), as previously described [15,16].
ANIMAL MODEL:
Thirty male Sprague-Dawley rats were housed in the Animal Laboratory of the Central Laboratory of the Second Affiliated Hospital of Dalian Medical University. The rats were housed in cages in groups of five and were supplied with equal portions of normal feed and sterile water. The rats were maintained with a 12-hour light and dark cycle at 19.1±1°C and 55% humidity.
After one week of adaptation, the rats were randomly and equally assigned into one of three groups: a control group, an experimental group 1 (EG1), and an experimental group 2 (EG2). All rats were given the same diet, but the control group was given sterile water, and the experimental groups were given drinking water with compound antibiotics (vancomycin 500 mg/L, metronidazole 1g/L, neomycin 1g/L, and ampicillin 1 g/L) for three weeks, as previously described [8,17]. Fecal samples from healthy humans and patients with stage 5 CKD in the low-protein diet group were transplanted into the intestines of the EG1 and EG2 rats, respectively.
The experimental protocol was approved by the Animal Ethics Committee of Dalian Medical University and was in accordance with the Principles of Laboratory Animal Care and Use in Research (Ministry of Health, Beijing, China).
RAT FECAL SAMPLE COLLECTION:
Fecal samples from the rats in the normal control group, the rats fed compound antibiotics for three weeks, and the rats transplanted with the intestinal microbiota of the patients with CKD for two weeks were collected and stored at −80°C for analysis. After two weeks of enemas, rats in the control and experimental groups were given 10% chloral hydrate and injected intraperitoneally with 400 mg/kg for five minutes before anesthesia. Then, between 5 and 6 mL of blood were taken from the abdominal aorta. All rats were then euthanized by cervical dislocation, their epididymis and peripheral kidney fat were removed, weighed, and stored at −80°C degrees for later analysis.
The rats were weighed one week and four weeks after compound antibiotic feeding and six weeks after intestinal microbiota transplantation. After the rats were euthanized, the fat around the peritoneal epididymis and kidney was compared with their body weight (g/100 g) to obtain the body fat ratio. The differences between the groups were analyzed using the t-test [18,19]. Blood creatinine and other biochemical indices were measured using the LABOSPECT008 automatic biochemical analyzer (Hitachi, Tokyo, Japan).
STATISTICAL ANALYSIS:
Numerical data were presented as the mean±standard deviation (SD). Statistical analysis was performed using SPSS version 19.0 (IBM Inc., Chicago, IL, USA). Scores, weights, and assay values were analyzed using one-way, two-way, or repeated analysis of variance (ANOVA). A Bonferroni correction post hoc test was used with the ANOVA results to identify significant differences between the groups. A P-value <0.05 was considered to be statistically significant.
Results
GENERAL DATA ON THE INTESTINAL MICROBIOTA IN PATIENTS WITH STAGE 5 CHRONIC KIDNEY DISEASE (CKD):
Patients with stage 5 CKD were randomly assigned to one of three groups according to their diet, and the clinical and biochemical indices of each group were compared (Table 1).
At the level of the phylum, the abundance of Bacteroides in the intestinal microbiota of patients with stage 5 CKD was reduced (RS1: 22.98%; RS2: 14.64%; RS3: 15.09%; and RS4: 16.89%). (Figure 1A, 1D) The relative abundance of Firmicutes increased in the RS2 group (76.43%) and decreased in the RS3 group (61.79%). The difference between the two groups was significant (P=0.014) (Figure 1B).
At the genus level, the relative abundance of Escherichia and Shigella in the intestinal microbiota increased (RS1: 0.65%, RS2: 2.40%, RS3: 10.22%, and RS4: 5.56%). The relative abundance of z Blautia decreased in the RS3 group (7.17%) and RS4 group (7.59%), and Klebsiella was RS1: 0.67%, RS2: 0.88%, RS3: 2.8%, and RS4: 3.6%. The between-group differences were significant (P=0.027) (Figure 1C).
ANALYSIS OF SPECIES ABUNDANCE CLUSTERING IN THE HEAT MAP:
In the RS1 group, Firmicutes were concentrated in the genus Coprococcus and Lachnospiraceae ucg-005, and Prevotella was dominant in the Bacteroidetes. The RS2 group was dominated by Streptococcus and Holdemanella from Firmicutes. In the RS3 group, there are Christensenellaceae_r-7_grouprs1 of Firmicutes and Escherichia and Shigella of proteobacteria in large quantities. The RS4 group was dominated by Rumen coccus 2, Faecalibacterium, and Aeromonas in the Firmicutes (Figure 2).
SEQUENCING AND IDENTIFICATION OF THE RAT INTESTINAL MICROBIOTA:
At the phylum level, the intestinal microbiota of rats (group drug) changed significantly after they were fed compound antibiotics. Proteobacteria accounted for most intestinal microbiota in rats (96%) (Figure 3A). Firmicutes and Bacteroidetes dominated the intestinal microbiota of rats in the normal control group (group Y), and the intestinal microbiota of rats in the experiment group (group X) after the fecal microbiota transplantation from patients with stage 5 CKD was similar to that of the donor microbiota (Figure 3B).
Heat map analysis showed that the intestinal proteobacterium of rats after administration was mainly composed of alkali-producing bacilli, E coli and Shigella (Figure 4). After the transplantation of microbiota, the level of Firmophyta in rats was also different from that in the control group, and the enrichment of Christensenellaceae_r-7_group rs1 was also observed in patients with stage 5 CKD on a very low-protein diet (Figure 5).
COMPARISON OF BODY WEIGHT AND BODY FAT RATIO IN THE RAT GROUPS:
There was no significant difference in body weight between the three groups at week one (Table 2). At the beginning of the second week, compound antibiotics were given to the EG1 and EG2 groups, and the weight of the rats in each group changed significantly. The experimental group was significantly smaller than the control group. At week four, the weight of rats in the experimental group was significantly lower than in the control group, and the difference was significant (P<0.05). There was no significant difference in weight between the two experimental groups. Three rats in the EG1 group died within two weeks after intestinal microbiota transplantation, and one in the EG2 group died during an anesthesia operation. All rats in the control group survived. At week six, the weight difference between the experimental groups and the control group was still significant. The average weight of the EG1 group was lower than that of the EG2 group (Figure 6).
COMPARISON OF BIOCHEMICAL INDICES:
Fecal microbiota transplantation in patients with stage 5 CKD was performed in EG1, and microbiota transplantation from healthy individuals was performed in EG2. Two weeks after fecal microbiota transplantation, there was no significant difference in renal function or triglyceride levels between the three groups. The cholesterol level of EG1 (1.96±0.39 mg/dL) was significantly lower than that of the control group (2.37±0.42 mg/dL) and EG2 (2.54±0.73 mg/dL) (P<0.05). Plasma albumin was the highest in the control group and the lowest in EG1, with significant differences (Table 3).
Discussion
The present study included 36 patients with stage 5 chronic kidney disease (CKD) who were given one of three different diets. Their stool samples were then collected to test the composition of their intestinal microbiota, which were significantly different from those of healthy individuals. The difference was mainly reflected in the significant reduction ion the levels of Bacteroidetes, consistent with previous reports. The relative number of Firmicutes increased in the normal diet group, while Proteobacteria increased and Firmicutes decreased in the low-protein diet group.
Previous studies have suggested that high-calorie diets can lead to an increase in Firmicutes and Bacteroides, a change that increases the ability of the microbial community to harvest energy [20–22]. This change shows that the energy gained by microorganisms also prompts the host to increase its energy intake, seeming to confirm the Matthew effect, especially in obese people [21,23]. The digestive products of proteins are mainly amino acids and small peptides, about 95% of which are digested and absorbed by the stomach and small intestines.
After the intestinal microbiota of patients with stage 5 CKD rich in Christensenellaceae r-7 were transplanted into rats, we observed changes related to malnutrition (e.g., low body weight), suggesting that the bacteria may harm the energy absorption and use of the host. Prevotella has a weak ability to use amino acids and a medium glycolysis ability that can promote the nutrient absorption of the host and has a positive correlation with obesity. It has been reported that its abundance in vegetarians is higher than in meat-eaters. This finding may be related to the compensatory increase of this bacterium in the low-energy intestinal environment of people with low-protein diets. Whether this indicates that short-term dietary factors greatly influence the bacterium needs further study.
Mitsuokella has a strong ability to ferment carbohydrates. The increasing abundance of such bacteria in the intestinal tract of patients on a very low-protein diet may be an adaptive change to increase the host’s energy intake. These findings provide part of the rationale for a low-protein diet with adequate caloric intake in CKD patients. However, the effect of the microbiota on host nutrient metabolism is complex. In the low-protein diet group, there were more rumen bacteria and Faecalis bacteria, which can help the host digest and absorb energy and provide some intestinal protection. A reasonable diet with moderate protein control and adequate caloric intake can help improve the intestine disorders in patients with stage 5 CKD and may reduce complications associated with treatment [28,29].
Fecal microbiota transplantation is a favorable method to observe the relationship between intestinal microbiota and individuals [30]. In the present study, fecal microbiota transplantation was conducted from humans to Sprague-Dawley rats to observe the resulting changes. The findings showed that after the rats consumed compound antibiotics for three weeks, their composition and abundance of intestinal microbiota significantly changed, which is consistent with previous studies. The drugs led to the single dominant strain of proteobacteria in the rat intestinal tract. Proteobacteria are the largest group of bacteria. There are also free-living species and include many bacteria that can fix nitrogen. The drug-altered intestinal microbiome environment was more receptive to the transplanted foreign microbiota. The sequencing results of rat intestinal microbiota after transplantation also confirmed the feasibility of xenotransplantation.
The relative abundance and composition of rat intestinal microbiota two weeks after fecal microbiota transplantation was very similar to that of the transplant donor. Combined with the body weight, body fat ratio, plasma albumin, cholesterol, and other indices of the rats, the experimental group’s nutritional status was significantly worse than that of the control group. However, in the two experimental groups, the nutritional status of the intestinal microbiota of the transplanted uremic patients was worse than that of the normal group, suggesting that under the same dietary conditions, the intestinal microbiota of patients with stage 5 CKD on the simple low-protein diet also risk causing malnutrition. There could be many specific mechanisms, including the direct impact on the absorption of nutrients and indirect factors caused by systemic inflammation) [31–33]. Recently, Wu et al. found that the composition and function of the intestinal microbiota are related to the severity of the disease and the level of circulating renal toxins in patients with chronic kidney disease. Specific gut microbes can be used as potential biomarkers for early diagnosis and prognostic monitoring and as candidate therapeutic targets [34]. The topic of changes in the intestinal microbiota in patients with CKD is large and complex. The number of patients included in this study is limited, and the intestinal microbiota of patients with chronic renal insufficiency with different diets has been rarely studied. On this basis, the relationship between different nutritional status and intestinal microbiota of patients with chronic renal insufficiency under the same diet should be further studied, and the relevant bacteria should be further identified.
Conclusions
This study aimed to investigate the changes in the intestinal microbiota due to different dietary regimens in patients with stage 5 chronic kidney disease (CKD) and the effects of human to rat fecal microbiota transplantation. Patients with stage 5 CKD on a very low-protein diet showed changes in the intestinal microbiota that could be transferred from humans to rats by fecal microbiota transplantation.
Figures
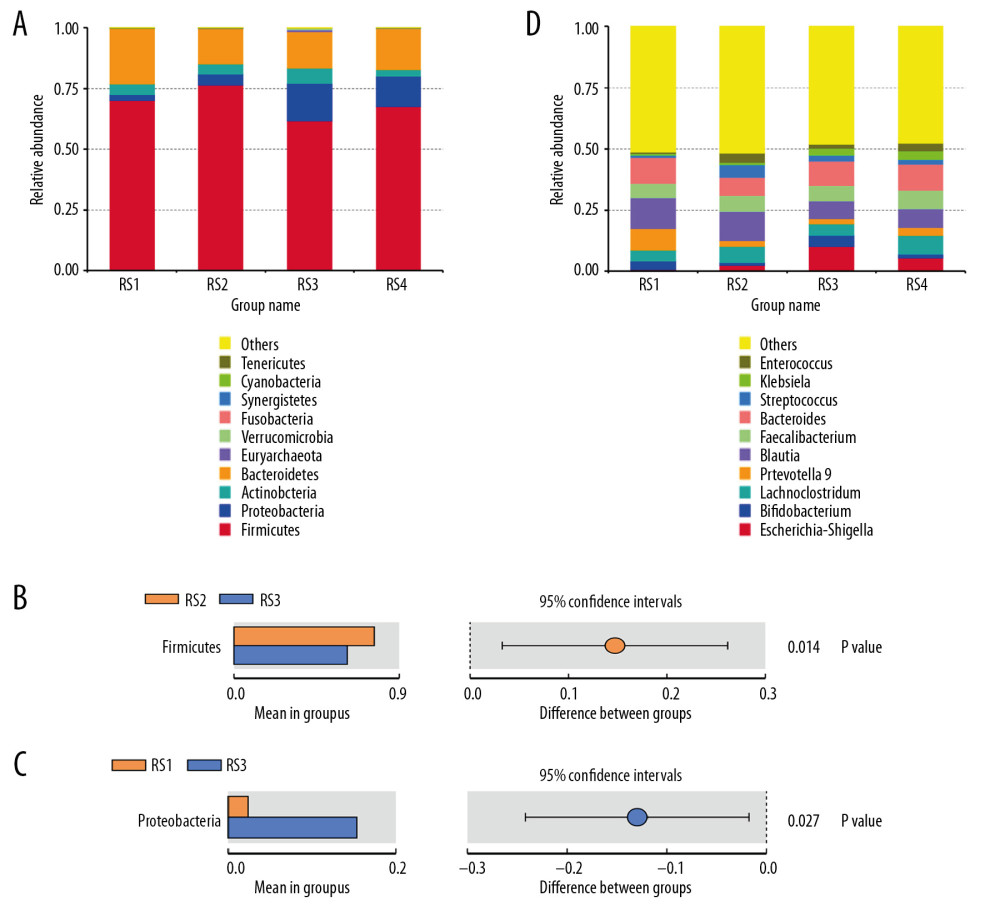 Figure 1. Bar charts of the relative abundance of the fecal microbiota species at the phylum level. According to the annotation results of the microbial species, the most abundant species of each group at the phylum level are selected to generate the bar chart of the relative abundance of species. The x coordinate represents the name of the groups. The y coordinate represents the relative abundance. (A) RS1: the healthy control group; RS2: the stage 5 chronic kidney disease (CKD) normal diet group; RS3: the stage 5 CKD very low-protein diet group; RS4: the stage 5 CKD low-protein diet group. (B) The t-test analysis chart of the species difference between the groups. There are significantly fewer Firmicutes in the RS3 group than in the RS2 group. (C) The t-test analysis chart of the species difference between the groups. There are significantly more Proteobacteria in the RS3 group than in the RS1 group. (D) Bar chart showing the relative abundance of the species at the genus level.
 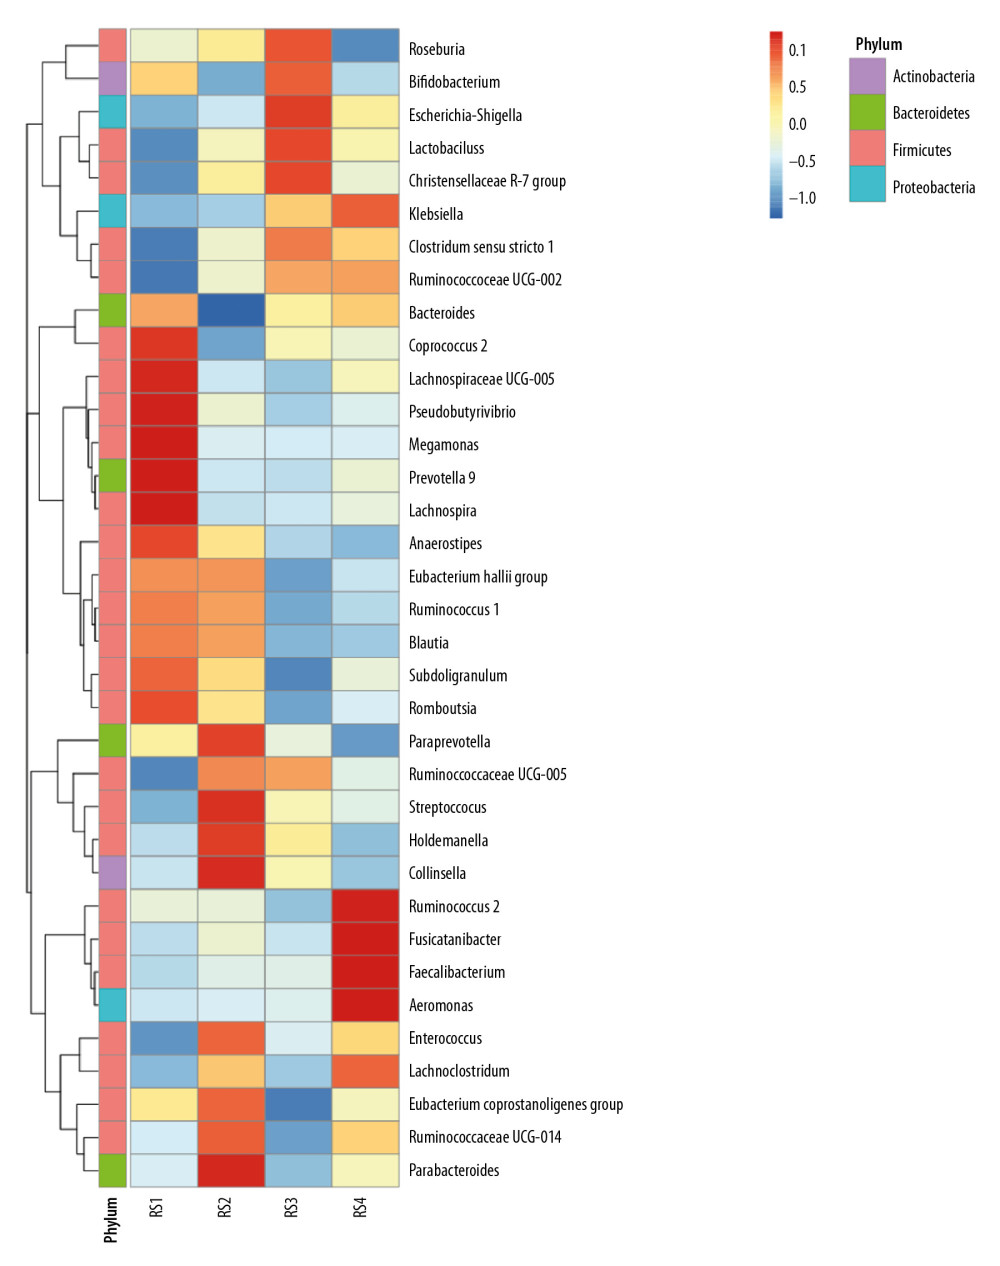 Figure 2. Analysis of species abundance clustering in the heat map. The longitudinal axis shows the sample information, the transverse axis represents the species annotation information, and the clustering tree on the left of the figure is a species clustering tree. The cluster tree above is the cluster tree between the sample groups. The value corresponding to the intermediate heat map is the z-value obtained after standardization treatment for the relative abundance of species in each row. The z-value of a sample in a certain classification is the value obtained by dividing the difference between the relative abundance of samples in that classification and the average relative abundance of all samples in that classification by the standard deviation (SD) of all samples in that classification.
 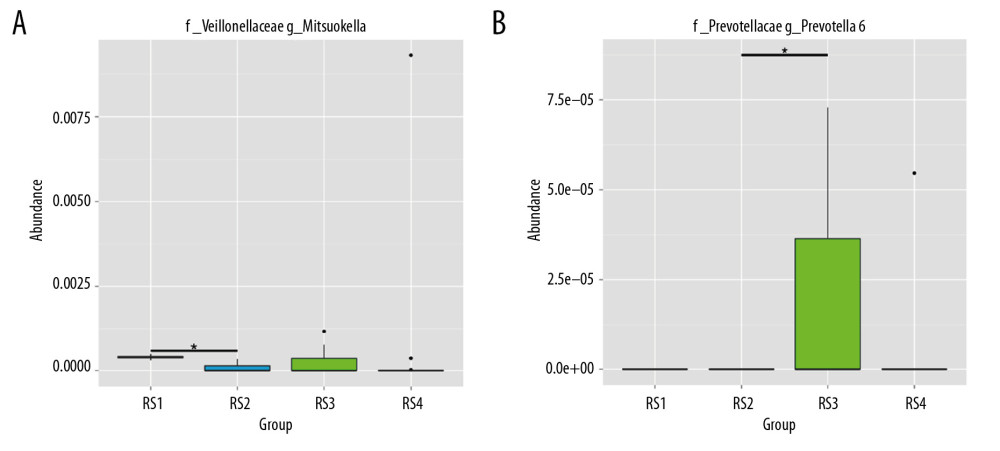 Figure 3. Sequencing and identification of the rat intestinal microbiota. The sample group is shown on the x-axis. The relative abundance of the corresponding species is shown on the y-axis. * Indicates a significant difference between the two groups (P<0.05), and ** indicates a significant difference between the two groups (P<0.01). (A) At the genus level, the Mitsuokella content was highest in the RS3 group. (B) The content of Prevotella was highest in the RS3 group.
 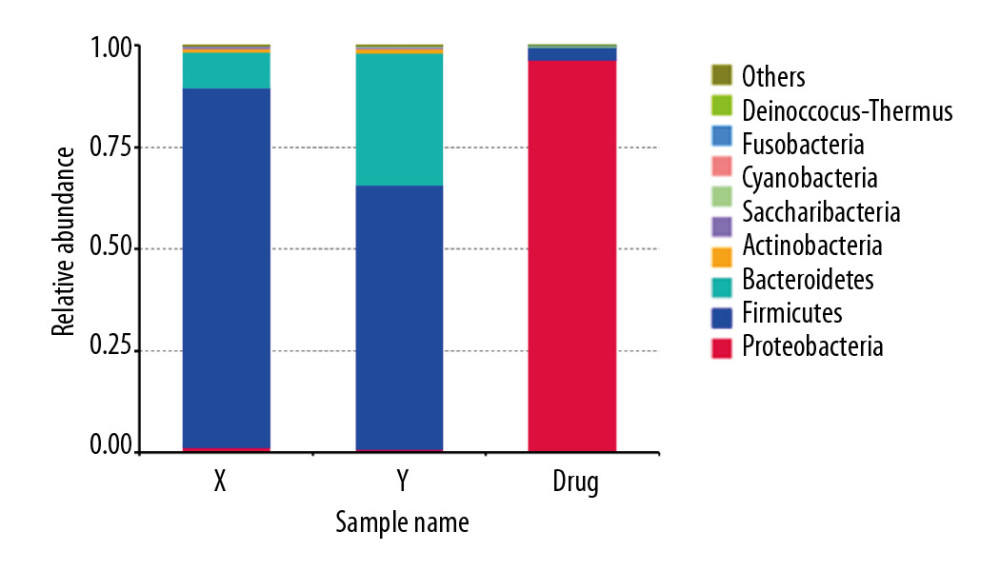 Figure 4. Human to rat fecal microbiota transplantation and the relative abundance of the top 10 species at the phylum level in the rat three groups. (X) Rats received fecal microbiota transplantation from patients with stage 5 chronic kidney disease (CKD). (Y) The normal control group. (Drug) Rats were given compound antibiotics and without fecal microbiota transplantation.
 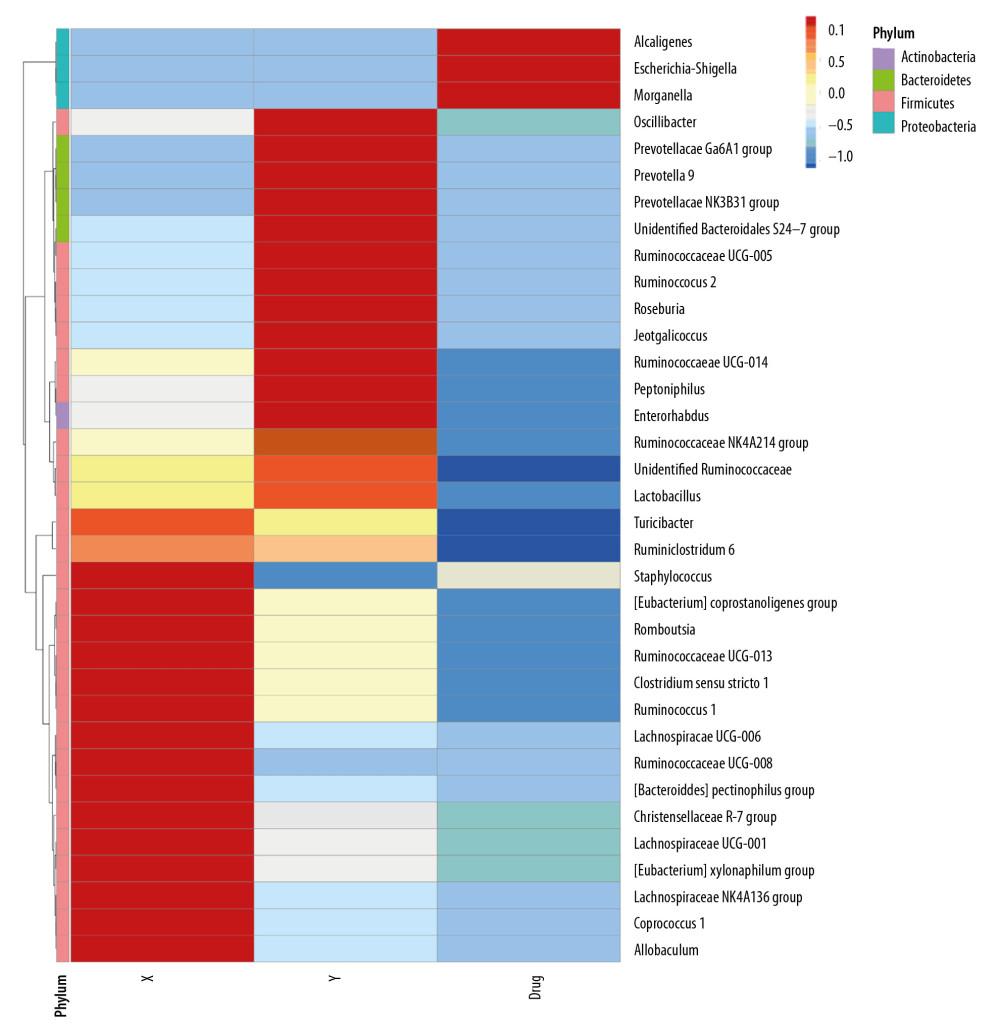 Figure 5. Heat map of the distribution of intestinal bacterial microbiota following human to rat fecal microbiota transplantation in the three rat groups. (X) Rats received fecal microbiota transplantation from patients with stage 5 chronic kidney disease (CKD). (Y) The normal control group. (Drug) Rats were given compound antibiotics and without fecal microbiota transplantation.
  Figure 6. Comparisons of the weight in the three rat groups following human to rat fecal microbiota transplantation. The three rat groups were compared, the control group (CG), the uremia patient fecal microbiota transplantation group (EG1), and the normal human fecal microbiota transplantation group (EG2).
 References
1. Arora P, Vasa P, Brenner D, Prevalence estimates of chronic kidney disease in Canada: Results of a nationally representative survey: CMAJ, 2013; 185; E417-23
2. Gambaro G, Yabarek T, Graziani MS, Prevalence of CKD in northeastern Italy: Results of the INCIPE study and comparison with NHANES: Clin J Am Soc Nephrol, 2010; 5; 1946-53
3. Di Daniele N, Petramala L, Di Renzo L, Body composition changes and cardiometabolic benefits of a balanced Italian Mediterranean Diet in obese patients with metabolic syndrome: Acta Diabetol, 2013; 50; 409-16
4. Hess M, Sczyrba A, Egan R, Metagenomic discovery of biomass-degrading genes and genomes from cow rumen: Science, 2011; 331; 463-67
5. DeSantis TJ, Hugenholtz P, Keller K, NAST: A multiple sequence alignment server for comparative analysis of 16S rRNA genes: Nucleic Acids Res, 2006; 34; W394-99
6. Bulgarelli D, Garrido-Oter R, Munch PC, Structure and function of the bacterial root microbiota in wild and domesticated barley: Cell Host Microbe, 2015; 17; 392-403
7. Ridaura VK, Faith JJ, Rey FE, Gut microbiota from twins discordant for obesity modulate metabolism in mice: Science, 2013; 341; 1241214
8. Seki E, De Minicis S, Osterreicher CH, TLR4 enhances TGF-beta signaling and hepatic fibrosis: Nat Med, 2007; 13; 1324-32
9. Brandt LJ, Aroniadis OC, An overview of fecal microbiota transplantation: Techniques, indications, and outcomes: Gastrointest Endosc, 2013; 78; 240-49
10. Borody TJ, Khoruts A, Fecal microbiota transplantation and emerging applications: Nat Rev Gastroenterol Hepatol, 2011; 9; 88-96
11. Smits LP, Bouter KE, de Vos WM, Borody TJ, Nieuwdorp M, Therapeutic potential of fecal microbiota transplantation: Gastroenterology, 2013; 145; 946-53
12. Haas BJ, Gevers D, Earl AM, Chimeric 16S rRNA sequence formation and detection in Sanger and 454-pyrosequenced PCR amplicons: Genome Res, 2011; 21; 494-504
13. Li B, Zhang X, Guo F, Characterization of tetracycline resistant bacterial community in saline activated sludge using batch stress incubation with high-throughput sequencing analysis: Water Res, 2013; 47; 4207-16
14. Yang K, Yue Q, Kong J, Microbial diversity in combined UAF–UBAF system with novel sludge and coal cinder ceramic fillers for tetracycline wastewater treatment: Chemical Engineering Journal, 2016; 285; 319-30
15. Magoc T, Salzberg SL, FLASH: Fast length adjustment of short reads to improve genome assemblies: Bioinformatics, 2011; 27; 2957-63
16. Caporaso JG, Kuczynski J, Stombaugh J, QIIME allows analysis of high-throughput community sequencing data: Nat Methods, 2010; 7; 335-36
17. Wang Q, Garrity GM, Tiedje JM, Cole JR, Naive Bayesian classifier for rapid assignment of rRNA sequences into the new bacterial taxonomy: Appl Environ Microbiol, 2007; 73; 5261-67
18. Bjorkbacka H, Kunjathoor VV, Moore KJ, Reduced atherosclerosis in MyD88-null mice links elevated serum cholesterol levels to activation of innate immunity signaling pathways: Nat Med, 2004; 10; 416-21
19. Backhed F, Ding H, Wang T, The gut microbiota as an environmental factor that regulates fat storage: Proc Natl Acad Sci USA, 2004; 101; 15718-23
20. Manco M, Putignani L, Bottazzo GF, Gut microbiota, lipopolysaccharides, and innate immunity in the pathogenesis of obesity and cardiovascular risk: Endocr Rev, 2010; 31; 817-44
21. Knight J, Jiang J, Assimos DG, Holmes RP, Hydroxyproline ingestion and urinary oxalate and glycolate excretion: Kidney Int, 2006; 70; 1929-34
22. Bosscher D, Breynaert A, Pieters L, Hermans N, Food-based strategies to modulate the composition of the intestinal microbiota and their associated health effects: J Physiol Pharmacol, 2009; 60(Suppl 6); 5-11
23. Siener R, Schade N, Nicolay C, The efficacy of dietary intervention on urinary risk factors for stone formation in recurrent calcium oxalate stone patients: J Urol, 2005; 173; 1601-5
24. Dethlefsen L, Eckburg PB, Bik EM, Relman DA, Assembly of the human intestinal microbiota: Trends Ecol Evol, 2006; 21; 517-23
25. Stecher B, Hardt WD, The role of microbiota in infectious disease: Trends Microbiol, 2008; 16; 107-14
26. Zimmer J, Lange B, Frick JS, A vegan or vegetarian diet substantially alters the human colonic faecal microbiota: Eur J Clin Nutr, 2012; 66; 53-60
27. Goodrich JK, Davenport ER, Beaumont M, Genetic determinants of the gut microbiome in UK twins: Cell Host Microbe, 2016; 19; 731-43
28. Ndongo S, Khelaifia S, Fournier PE, Raoult D, Christensenella massiliensis, a new bacterial species isolated from the human gut: New Microbes New Infect, 2016; 12; 69-70
29. Rahimvand L, Niakan M, Naderi NJ: Iran J Microbiol, 2018; 10; 254-57
30. Hiranmayi KV, Sirisha K, Ramoji RM, Sudhakar P, Novel pathogens in periodontal microbiology: J Pharm Bioallied Sci, 2017; 9; 155-63
31. Ridaura VK, Faith JJ, Rey FE, Gut microbiota from twins discordant for obesity modulate metabolism in mice: Science, 2013; 341; 1241214
32. Di Daniele N, Petramala L, Di Renzo L, Body composition changes and cardiometabolic benefits of a balanced Italian Mediterranean Diet in obese patients with metabolic syndrome: Acta Diabetol, 2013; 50; 409-16
33. Johns N, Stephens NA, Fearon KC, Muscle wasting in cancer: Int J Biochem Cell Biol, 2013; 45; 2215-29
34. Wu IW, Lin CY, Chang LC, Gut microbiota as diagnostic tools for mirroring disease progression and circulating nephrotoxin levels in chronic kidney disease: Discovery and validation study: Int J Biol Sci, 2020; 16; 420-34
Figures
Figure 1. Bar charts of the relative abundance of the fecal microbiota species at the phylum level. According to the annotation results of the microbial species, the most abundant species of each group at the phylum level are selected to generate the bar chart of the relative abundance of species. The x coordinate represents the name of the groups. The y coordinate represents the relative abundance. (A) RS1: the healthy control group; RS2: the stage 5 chronic kidney disease (CKD) normal diet group; RS3: the stage 5 CKD very low-protein diet group; RS4: the stage 5 CKD low-protein diet group. (B) The t-test analysis chart of the species difference between the groups. There are significantly fewer Firmicutes in the RS3 group than in the RS2 group. (C) The t-test analysis chart of the species difference between the groups. There are significantly more Proteobacteria in the RS3 group than in the RS1 group. (D) Bar chart showing the relative abundance of the species at the genus level.Figure 2. Analysis of species abundance clustering in the heat map. The longitudinal axis shows the sample information, the transverse axis represents the species annotation information, and the clustering tree on the left of the figure is a species clustering tree. The cluster tree above is the cluster tree between the sample groups. The value corresponding to the intermediate heat map is the z-value obtained after standardization treatment for the relative abundance of species in each row. The z-value of a sample in a certain classification is the value obtained by dividing the difference between the relative abundance of samples in that classification and the average relative abundance of all samples in that classification by the standard deviation (SD) of all samples in that classification.Figure 3. Sequencing and identification of the rat intestinal microbiota. The sample group is shown on the x-axis. The relative abundance of the corresponding species is shown on the y-axis. * Indicates a significant difference between the two groups (P<0.05), and ** indicates a significant difference between the two groups (P<0.01). (A) At the genus level, the Mitsuokella content was highest in the RS3 group. (B) The content of Prevotella was highest in the RS3 group.Figure 4. Human to rat fecal microbiota transplantation and the relative abundance of the top 10 species at the phylum level in the rat three groups. (X) Rats received fecal microbiota transplantation from patients with stage 5 chronic kidney disease (CKD). (Y) The normal control group. (Drug) Rats were given compound antibiotics and without fecal microbiota transplantation.Figure 5. Heat map of the distribution of intestinal bacterial microbiota following human to rat fecal microbiota transplantation in the three rat groups. (X) Rats received fecal microbiota transplantation from patients with stage 5 chronic kidney disease (CKD). (Y) The normal control group. (Drug) Rats were given compound antibiotics and without fecal microbiota transplantation.Figure 6. Comparisons of the weight in the three rat groups following human to rat fecal microbiota transplantation. The three rat groups were compared, the control group (CG), the uremia patient fecal microbiota transplantation group (EG1), and the normal human fecal microbiota transplantation group (EG2). Tables
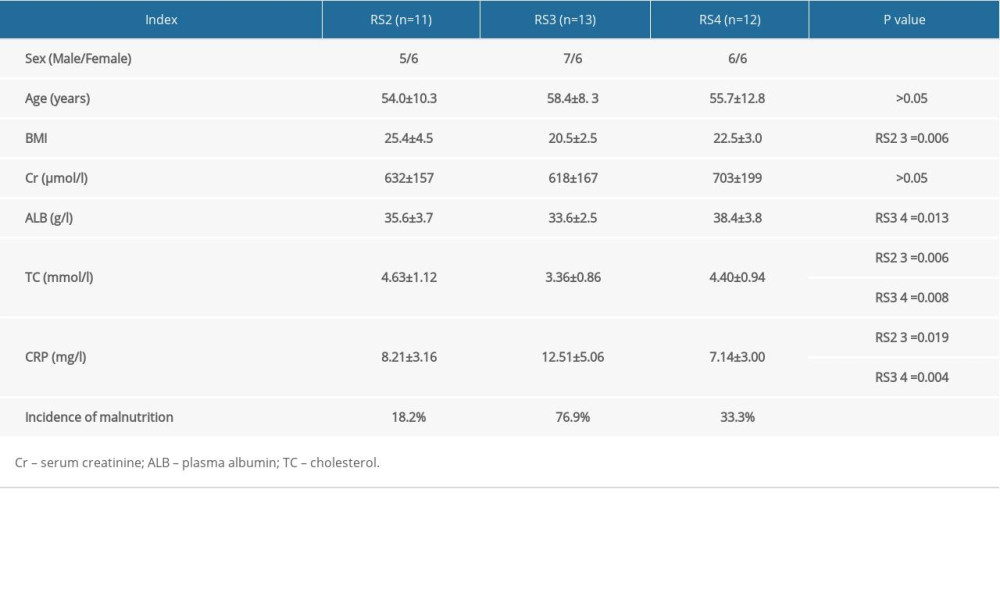 Table 1. Comparison of general data of three groups of patients with different diets.
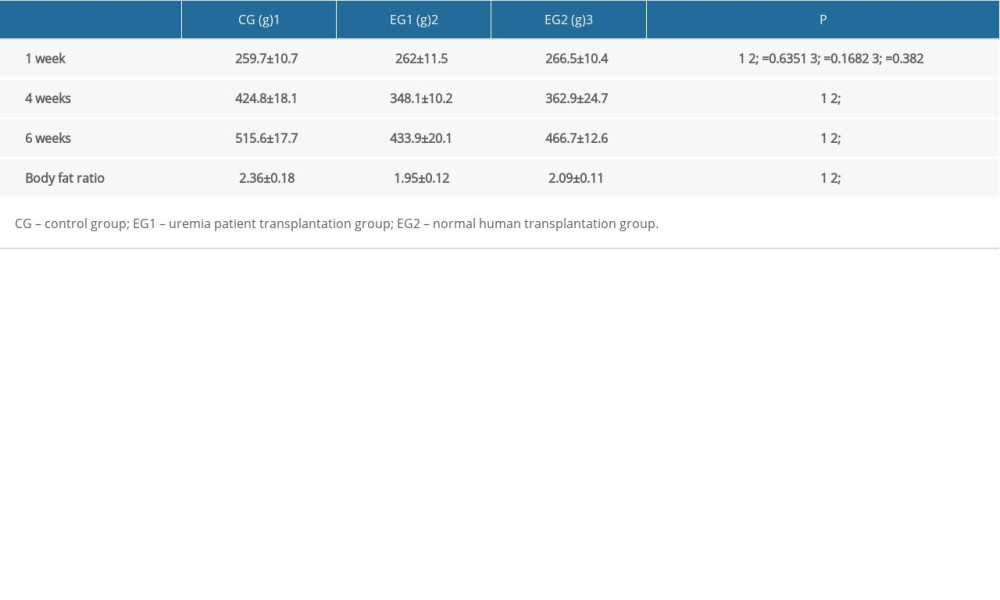 Table 2. Body weight and body fat ratio of rats in three groups.
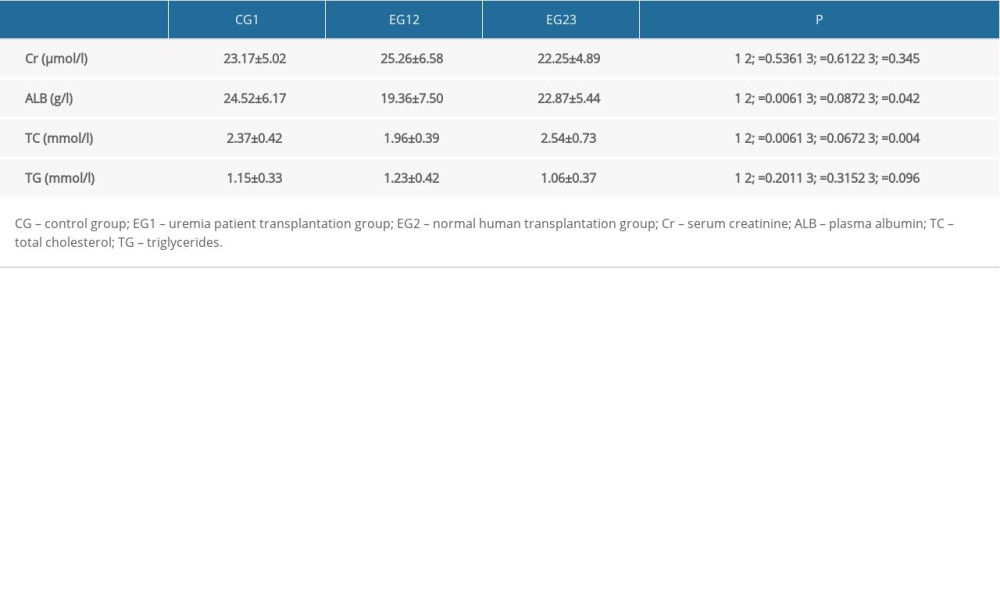 Table 3. Comparison of biochemical indexes in three experimental rat groups.Table 1. Comparison of general data of three groups of patients with different diets.Table 2. Body weight and body fat ratio of rats in three groups.Table 3. Comparison of biochemical indexes in three experimental rat groups.
 In Press
Clinical Research
Body Weight and Insulin Resistance Indicators Among ChildrenMed Sci Monit In Press; DOI: 10.12659/MSM.951434
Clinical Research
Comparison of Radiographic Cervical Sagittal Alignment Parameters in Patients With Nonspecific Neck Pain, D...Med Sci Monit In Press; DOI: 10.12659/MSM.952950
Clinical Research
Combined Fibrinogen and Urinary α1-Microglobulin as Predictors of Respiratory Tract Infection in Children w...Med Sci Monit In Press; DOI: 10.12659/MSM.951066
Database Analysis
Evaluation of Salivary Total Oxidant Status (TOS) and Total Antioxidant Status (TAS) in Orthodontic Patient...Med Sci Monit In Press; DOI: 10.12659/MSM.952052
Most Viewed Current Articles
17 Jan 2024 : Review article 14,175,576
Vaccination Guidelines for Pregnant Women: Addressing COVID-19 and the Omicron VariantDOI :10.12659/MSM.942799
Med Sci Monit 2024; 30:e942799
13 Nov 2021 : Clinical Research 3,756,620
Acceptance of COVID-19 Vaccination and Its Associated Factors Among Cancer Patients Attending the Oncology ...DOI :10.12659/MSM.932788
Med Sci Monit 2021; 27:e932788
14 Dec 2022 : Clinical Research 2,465,966
Prevalence and Variability of Allergen-Specific Immunoglobulin E in Patients with Elevated Tryptase LevelsDOI :10.12659/MSM.937990
Med Sci Monit 2022; 28:e937990
16 May 2023 : Clinical Research 708,651
Electrophysiological Testing for an Auditory Processing Disorder and Reading Performance in 54 School Stude...DOI :10.12659/MSM.940387
Med Sci Monit 2023; 29:e940387