19 October 2020: Clinical Research
Roles of Morris Index on Poor Outcomes in Patients with Non-ST Segment Elevation Acute Coronary Syndrome
Huizhong Lin1AE, Tao Lin2BC, Lan Lin1DF, Mingfang Ye1AG*DOI: 10.12659/MSM.924418
Med Sci Monit 2020; 26:e924418


Abstract
BACKGROUND: This study aimed to assess the roles of the Morris index in predicting poor outcomes in patients with non-ST segment elevation acute coronary syndrome (NSTE-ACS).
MATERIAL AND METHODS: This study included 905 patients with newly diagnosed NSTE-ACS. The Morris index, also known as P wave terminal force in lead V1 (PTFV1), was recorded at admission and discharge. PTVF1 (+) was defined as an absolute value >0.04 mm·s, while PTFV1 (–) was defined as an absolute value <0.04 mm·s. Based on their PTFV1 values at admission/discharge, patients were divided into 4 groups: PTFV1 (–)/(–), PTFV1 (+)/(–), PTFV1 (–)/(+), and PTFV1 (+)/(+). Univariate and multivariate regression analyses were utilized to identify the variables that could contribute to NSTE-ACS risk.
RESULTS: Compared with the PTFV1 (–)/(–) group, the incidence of poor outcomes was significantly higher in the PTFV1 (–)/(+) (hazard ratio [HR], 3.548; 95% confidence interval [95% CI], 2.024–6.219) and PTFV1 (+)/(+) (HR, 2.133; 95% CI, 1.141–3.986) groups, but not statistically different in the PTFV1 (+)/(–) group (risk ratio, 0.983; 95% CI, 0.424–2.277).
CONCLUSIONS: Primary PTFV1 (+) at discharge and PTFV1 (+) during hospitalization were independent risk factors for poor outcomes, which may provide useful prognostic information for patients with NSTE-ACS.
Keywords: acute coronary syndrome, Cardiology, Electrocardiography, Cohort Studies, Non-ST Elevated Myocardial Infarction, Risk Factors
Background
Non-ST segment elevation acute coronary syndrome (NSTE-ACS) is a dangerous clinical manifestation of acute coronary syndrome (ACS), with an incidence that is approximately as high as 70%. It leads to high morbidity, including unstable angina pectoris and non-ST elevation myocardial infarction, and mortality worldwide [1–3]. The pathophysiological characteristics of NSTE-ACS are severe coronary artery stenosis and/or acute thrombosis caused by rupture or erosion of vulnerable plaques, with or without vasoconstriction and microvascular embolization, resulting in decreased coronary blood flow and myocardial ischemia [4]. Although the pathophysiology of NSTE-ACS is clearly understood, effective diagnosis and therapies remain clinically challenging. Thus, clinicians need to explore early auxiliary examinations and the diagnostic parameters of NSTE-ACS.
An electrocardiogram (ECG) represents one of the most common noninvasive examinations for the diagnosis of myocardial ischemia. It records the electrical activity of cardiac cycles and plays a critical role in early risk stratification [5–8]. The parameters of ECG, including heart rate, P wave, ORS wave, ST segment, and T wave, are used to detect cardiac dysfunctions, including arrhythmia, cardiac hypertrophy, and myocardial infarction. P wave terminal force in lead V1 (PTFV1), referred to as the Morris index, is a product of the amplitude (mm) and time (s) of a terminal negative P wave when P waves are positive and negative in both directions, as first proposed by Morris et al. [9] in 1964. Research has shown that abnormal PTFV1 values are related to left ventricular diastolic dysfunction, atrial fibrillation, congestive heart failure, stroke, and death, and they could indicate the severity of cardiac disease [10–15].
PTFV1 plays important roles in the diagnosis, treatment, and prognosis of heart failure, cardiomyopathy, myocardial ischemia, and myocardial infarction. To the best of our knowledge, however, the association between PTFV1 and prognostic outcomes of NSTE-ACS has rarely been reported. Herein, we investigated the role of PTFV1 at admission and at discharge in predicting poor outcomes in patients with NSTE-ACS.
Material and Methods
PARTICIPANTS:
The study was conducted at Fujian Medical University Union Hospital between August 2015 and March 2017. A total of 905 patients with newly diagnosed NSTE-ACS were divided into 4 groups based on their PTFV1 values at admission and at discharge. This research was approved by the Institutional Review Board (IRB) of Fujian Medical University Union Hospital (Approval number: 2016KY025).
The inclusion criteria were (1) the patient was 18–80 years old, and (2) a precise diagnosis of NSTE-ACS had been made based on the 2015 American College of Cardiology/American Heart Association guidelines for the management of patients with NSTE-ACS [16].
The exclusion criteria were (1) a history of arrhythmia including atrial fibrillation, atrial flutter, auricular tachycardia, ventricular fibrillation, ventricular flutter, ventricular tachycardia, or borderline ventricular tachycardia; (2) heart valve disease, congenital heart disease, or cardiomyopathy; and (3) incomplete or missing data.
GROUPS:
The clinical data including sex, age, smoking, history of diseases, blood pressure, heart rate, Global Registry of Acute Coronary Event (GRACE) risk score, radiography, biochemical indicators, ultrasound cardiogram, and drug therapies were noted. ECG was collected at admission and at discharge for all patients. The PTFV1 values were detected using a photoelectric 1250P electrocardiogram machine with the 12-lead ECG (speed: 25 mm/s, amplitude: 1 mV/10 mm) and classified as follows: PTFV1 (−) (absolute value <0.04 mm·s) and PTFV1 (+) (absolute value >0.04 mm·s). On the basis their PTFV1 values at admission and discharge, patients with NSTE-ACS were divided into 4 groups: PTFV1 (−)/(−), PTFV1 (−)/(+), PTFV1 (+)/(−), and PTFV1 (+)/(+). After the ECG was collected for the first time, the position of the V1-lead on the chest wall was marked to ensure consistent placement for subsequent ECGs.
FOLLOW-UP:
All cases were traced mainly by clinical and telephone follow-ups within 1 to 38 months, with an average follow-up period of 19.1 months. The follow-up endpoints included major adverse cardiovascular events (MACEs) (cardiac death, heart failure that required hospitalization, malignant arrhythmia, nonfatal myocardial infarction, and repeat angioplasty), cerebral ischemic stroke, and death due to other causes. Follow-up occurred at 6 months, 1 year, and 2 years after discharge.
STATISTICAL ANALYSIS:
Statistical analysis was performed using SPSS 24.0 (SPSS, Inc., Chicago, IL). Continuous data are presented as the mean±standard deviation (χ̄+SD) or [M(Q25, Q75)] and were analyzed by Kruskal-Wallis test. Categorical data are presented as values (percentages) and were analyzed using χ2 or Kruskal-Wallis tests. One-way analysis of variance (ANOVA) with least significant difference post hoc test was used to compare the groups. Multivariable Cox regression analysis was used to identify the variables that Kaplan-Meier testing indicated as contributing to NSTE-ACS risk. A statistically significant difference was defined by
Results
CHARACTERISTICS OF PATIENTS WITH NSTE-ACS:
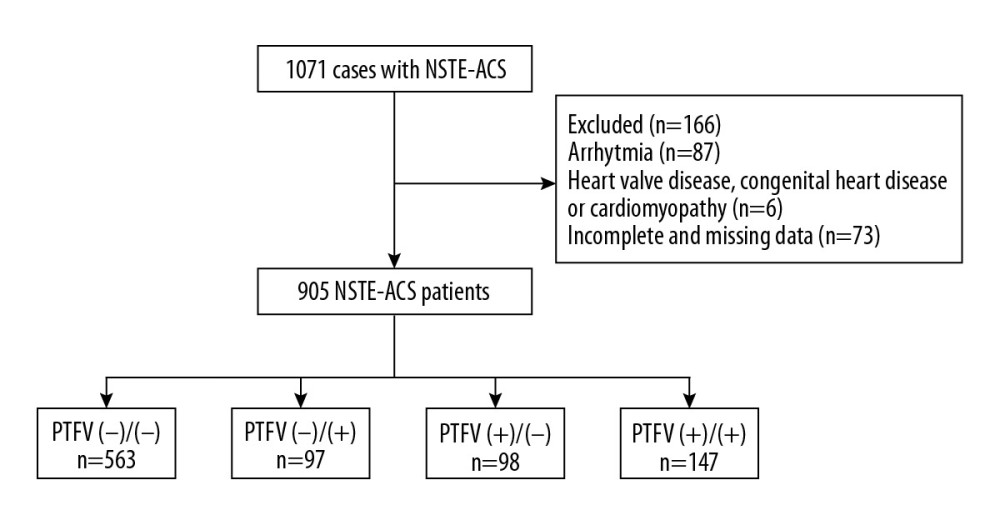
A total of 1071 patients with newly diagnosed NSTE-ACS were identified. After exclusion of subjects with arrhythmia, complications, and incomplete or missing data, the remaining 905 patients were separated into 4 groups based on their PTFV1 values at admission and discharge (Figure 1). Among these patients, 563 were in the PTFV1 (−)/(−) group, which had an average age of 67.25 ±10.16 years; 97 were in the PTFV1 (−)/(+) group, which had an average age of 68.93±9.28 years; 98 were in the PTFV1 (+)/(−) group, which had an average age of 69.83±10.36 years; and 147 were in the PTFV1 (+)/(+) group, which had an average age of 68.39±10.50 years. The primary characteristics of the patients are shown in Table 1. Significant differences were found for a history of diabetes, GRACE score at admission and discharge, ejection fraction (left atrium), total poor outcomes, and MACEs among the 4 groups (all P<0.05).
UNIVARIATE AND MULTIVARIATE REGRESSION ANALYSES FOR POOR NSTE-ACS OUTCOMES:
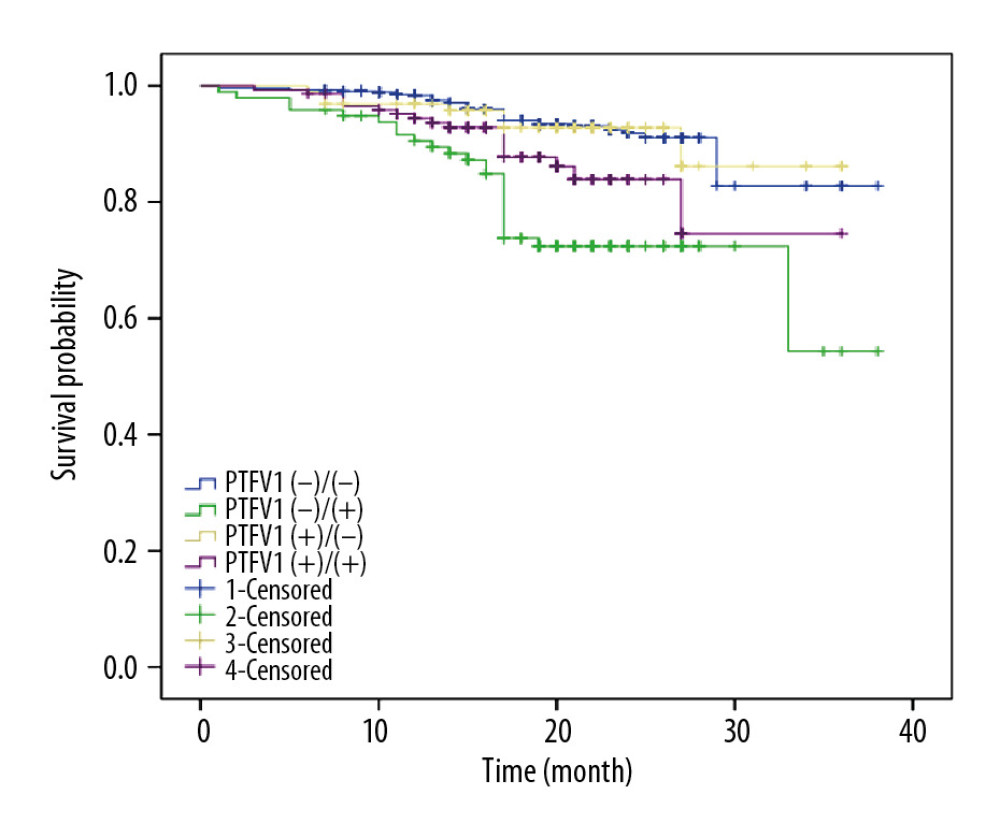
The results of the univariate regression analysis (Table 2) showed a significantly higher incidence (P<0.05) of total poor outcomes in the PTFV1 (−)/(+) group (risk ratio [RR], 5.238; 95% confidence interval [95% CI], 2.965–9.255) and the PTFV1 (+)/(+) group (RR, 2.105; 95% CI, 1.155–3.836), compared with the PTFV1 (−)/(−) group. The findings were further analyzed using the multivariate Cox regression analysis. The PTFV1 (+)/(−) group was not statistically different from the PTFV1 (−)/(−) group (RR, 0.983; 95% CI, 0.424–2.277). The blood supply of the atrium was recovered in patients in the PTFV1 (+/−) group after treatments, which indicated that changes in PVTF could be associated with revascularization or drug treatments that alter the atrial volume and pressure load. The incidence of adverse outcomes in the PTFV1 (−)/(+) (95% CI, 2.024–6.219) and PTFV1 (+)/(+) (95% CI, 1.141–3.986) groups was 3.548 and 2.334 times that in the PTFV1 (−)/(−) group, respectively. The survival curve of patients with NSTE-ACS is presented in Figure 2.
Discussion
We conducted a prospective observational study to assess the role of PTFV1 values at admission and at discharge in predicting poor outcomes in patients with NSTE-ACS. Our findings showed that PTFV1 (−)/(+) and PTFV1 (+)/(+) were associated with the incidence of adverse events. We also found that the primary PTFV1 (+) at discharge and PTFV1 (+) during hospitalization were independent risk factors for MACEs in patients with NSTE-ACS.
P wave parameters derived from ECG are quantitative measures of atrial electrical function, including the duration, dispersion, area, and axis of P waves and PTFV1 [17]. Compared with other P wave parameters, PTFV1 is easily visualized on ECG without complex calculations. Several studies have indicated that an absolute value of PTFV1 > 0.04 mm·s is abnormal [18], so we defined a value of <0.04 mm·s as a normal parameter in our study. Two mechanisms can explain an abnormal PTFV1. First, when an increase of the left atrial load due to fibrosis, hypertrophy, or ischemia occurs, the left atrium depolarizes and its depolarized vector increases. Second, an elevated amplitude and prolonged duration of the P wave deflection at the negative terminal can be caused by an increased right atrial load, hypertrophy, and extended interatrial bundle conduction. Early studies showed that an abnormal PTFV1 value was connected with left atrial structural abnormalities, left ventricular dysfunction, pulmonary emphysema, and so forth [12,19–22], which also could predict the risk of MACEs [18]. PTFV1 has since had a certain significance for the clinical diagnosis of diseases.
Studies have shown that an abnormal PTFV1 value can be associated with left ventricular diastolic dysfunction caused by infarcted myocardia, prior to heart failure symptoms and left ventricular systolic dysfunction [12,23]. Burak et al. [23] noted an association between PTFV1 and left ventricular end-diastolic pressure (LVEDP). In addition, increased pressure in the left atrium was found to lead to extended inter- or intra-atrial conduction time, with remodeling occurring because of the high pressure in the left atrium, thereby causing dilatation and fibrosis [24,25]. Some researchers found that the P wave peak time in ECG was associated with the severity of coronary artery disease among patients with non-ST segment elevation myocardial infarction [26]. The occurrence of coronary artery disease has been suggested to lead to ischemia or scarring of the atrium, and systolic and diastolic dysfunction caused by ischemia in the left ventricle may cause the LVEDP to increase [27–29]. As the left atrial pressure/volume loading rises, the depolarization duration of atrium may be prolonged [30]. Furthermore, Ren et al. [11] discovered that PTFV1 could predict the diagnosis of tuberculous constrictive pericarditis, while a meta-analysis indicated that PTFV1 is a good predictor of atrial fibrillation occurrence in populations with or without cardiovascular diseases [10]. In the present study, we found that the incidence of poor outcomes including MACEs was obviously increased in patients with NSTE-ACS who manifested primary PTFV1 (+) at discharge and PTFV1 (+) during hospitalization, based on long-term follow-up. The normal ECG indicators of patients with primary PTFV1 (−) at discharge and PTFV1 (−) during hospitalization appeared to indicate a reduced risk of poor outcomes. A previous study reported that the electrocardiographic deep terminal negativity of PTFV1 was independently related to death risk caused by cardiovascular disease [31], supporting the results of our research. Consequently, PTFV1 at admission and at discharge has important clinical significance in predicting the long-term prognosis of patients with NSTE-ACS.
This prospective observational study reported how changes in PTFV1 values at admission and at discharge could predict the risk of adverse events in patients with NSTE-ACS. The incidence of poor outcomes was significantly different between the 4 groups. However, some limitations warrant caution in interpreting the data. In the current study, the sample size in each cohort could reduce the statistical power, and the follow-up time was relatively short (1–38 months).
Conclusions
In summary, we investigated changes in PTFV1 values at admission and at discharge with regard to poor outcomes among patients with NSTE-ACS. We found that primary PTFV1 (+) at discharge and PTFV1 (+) during the hospital stay were independent risk factors for poor outcomes, which may provide useful prognostic information for patients with NSTE-ACS.
References
1. Go AS, Mozaffarian D, Roger VL, Heart disease and stroke statistics – 2013 update a report from the American Heart Association: Circulation, 2013; 127(1); E6-245
2. Subherwal S, Bach RG, Chen AY, Baseline risk of major bleeding in non-ST-segment-elevation myocardial infarction The CRUSADE (Can Rapid risk stratification of Unstable angina patients Suppress ADverse outcomes with Early implementation of the ACC/AHA guidelines) Bleeding Score: Circulation, 2009; 119(14); 1873-82
3. Fox KAA, Clayton TC, Damman P, Long-term outcome of a routine versus selective invasive strategy in patients with non-ST-segment elevation acute coronary syndrome a meta-analysis of individual patient data: J Am Coll Cardiol, 2010; 55(22); 2435-45
4. Hedayati T, Yadav N, Khanagavi J, Non-ST-segment acute coronary syndromes: Cardiol Clin, 2018; 36(1); 37-52
5. Chandraratna PA, Hodges M, Electrocardiographic evidence of left atrial hypertension in acute myocardial infarction: Circulation, 1973; 47(3); 493-98
6. Siltanen P, Pohjola-Sintonen S, Haapakoski J, The mortality predictive power of discharge electrocardiogram after first acute myocardial infarction: Am Heart J, 1985; 109(6); 1231-37
7. German DM, Kabir MM, Dewland TA, Atrial fibrillation predictors: Importance of the electrocardiogram: Ann Noninvasive Electrocardiol, 2016; 21(1); 20-29
8. Maron BJ, Friedman RA, Kligfield P, Assessment of the 12-lead electrocardiogram as a screening test for detection of cardiovascular disease in healthy general populations of young people (12–25 years of age): A scientific statement from the American Heart Association and the American College of Cardiology: J Am Coll Cardiol, 2014; 64(14); 1479-514
9. Morris JJ, McIntosh HD, Whalen RE, P-wave analysis in valvular heart disease: Circulation, 1964; 29(2); 242-52
10. Huang ZH, Zheng ZD, Wu BY, Predictive value of P wave terminal force in lead V1 for atrial fibrillation: A meta-analysis: Ann Noninvasive Electrocardiol, 2020; 25(4); e12739
11. Ren Y, Qiu J, Li Z, Li C, P-wave terminal force in lead V1 is a predictive indicator for the diagnosis of tuberculous constrictive pericarditis: Heart Lung, 2019; 48(2); 155-58
12. Liu G, Tamura A, Torigoe K, Abnormal P-wave terminal force in lead V1 is associated with cardiac death or hospitalization for heart failure in prior myocardial infarction: Heart Vessels, 2013; 28(6); 690-95
13. Goyal SB, Spodick DH, Electromechanical dysfunction of the left atrium associated with interatrial block: Am Heart J, 2001; 142(5); 823-27
14. Proietti R, Mafrici A, Spodick DH, Dynamic variations of P-wave duration in a patient with acute decompensated congestive heart failure: Cardiol J, 2012; 19(1); 95-97
15. Zhang H, Hu L, Wei X, Prognostic value of left ventricular hypertrophy in hypertensive patients: A meta-analysis of electrocardiographic studies: J Clin Hypertens (Greenwich), 2020; 22(2); 254-60
16. Roffi M, Patrono C, Collet JP, 2015 ESC Guidelines for the management of acute coronary syndromes in patients presenting without persistent ST-segment elevation: Task Force for the Management of Acute Coronary Syndromes in Patients Presenting without Persistent ST-Segment Elevation of the European Society of Cardiology (ESC): Eur Heart J, 2016; 37(3); 267-315
17. Magnani JW, Williamson MA, Ellinor PT, P wave indices current status and future directions in epidemiology, clinical, and research applications: Circ Arrhythm Electrophysiol, 2009; 2(1); 72-79
18. Eranti A, Aro AL, Kerola T, Prevalence and prognostic significance of abnormal P terminal force in lead V1 of the ECG in the general population: Circ Arrhythm Electrophysiol, 2014; 7(6); 1116-21
19. Win TT, Venkatesh BA, Volpe GJ, Associations of electrocardiographic P-wave characteristics with left atrial function, and diffuse left ventricular fibrosis defined by cardiac magnetic resonance: The PRIMERI Study: Heart Rhythm, 2015; 12(1); 155-62
20. Chhabra L, Chaubey VK, Kothagundla C, P-wave indices in patients with pulmonary emphysema: Do P-terminal force and interatrial block have confounding effects?: Int J Chron Obstruct Pulmon Dis, 2013; 8; 245-50
21. Junell A, Thomas J, Hawkins L, Screening entire healthcare system ECG database: association of deep terminal negativity of P wave in lead V1 and ECG referral with mortality: Int J Cardiol, 2017; 228; 219-24
22. Hsieh BP, Pham MX, Froelicher VF, Prognostic value of electrocardiographic criteria for left ventricular hypertrophy: Am Heart J, 2005; 150(1); 161-67
23. Burak C, Çağdaş M, Rencüzoğulları I, Association of P wave peak time with left ventricular end-diastolic pressure in patients with hypertension: J Clin Hypertens (Greenwich), 2019; 21(5); 608-15
24. Eijsbouts SC, Majidi M, van Zandvoort M, Effects of acute atrial dilation on heterogeneity in conduction in the isolated rabbit heart: J Cardiovasc Electrophysiol, 2003; 14(3); 269-78
25. Coronel R, Langerveld J, Boersma LV, Left atrial pressure reduction for mitral stenosis reverses left atrial direction-dependent conduction abnormalities: Cardiovasc Res, 2010; 85(4); 711-18
26. Burak C, Yesin M, Tanık VO, Prolonged P wave peak time is associated with the severity of coronary artery disease in patients with non-ST segment elevation myocardial infarction: J Electrocardiol, 2019; 55; 138-43
27. Yilmaz R, Demirbag R, P-wave dispersion in patients with stable coronary artery disease and its relationship with severity of the disease: J Electrocardiol, 2005; 38(3); 279-84
28. Dunbar CC, Saul BI, Kassotis J, Usefulness of P-wave morphology during submaximal treadmill exercise to predict coronary artery disease: Am J Cardiol, 2005; 96(6); 781-83
29. Maganis JC, Gupta B, Gamie SH, Usefulness of p-wave duration to identify myocardial ischemia during exercise testing: Am J Cardiol, 2010; 105(10); 1365-70
30. Alexander B, MacHaalany J, Lam B, Comparison of the extent of coronary artery disease in patients with versus without interatrial block and implications for new-onset atrial fibrillation: Am J Cardiol, 2017; 119(8); 1162-65
31. Tereshchenko LG, Shah AJ, Li YB, Soliman EZ, Electrocardiographic deep terminal negativity of the P wave in V1 and risk of mortality: The National Health and Nutrition Examination Survey III: J Cardiovasc Electrophysiol, 2014; 25(11); 1242-48
Figures
Tables
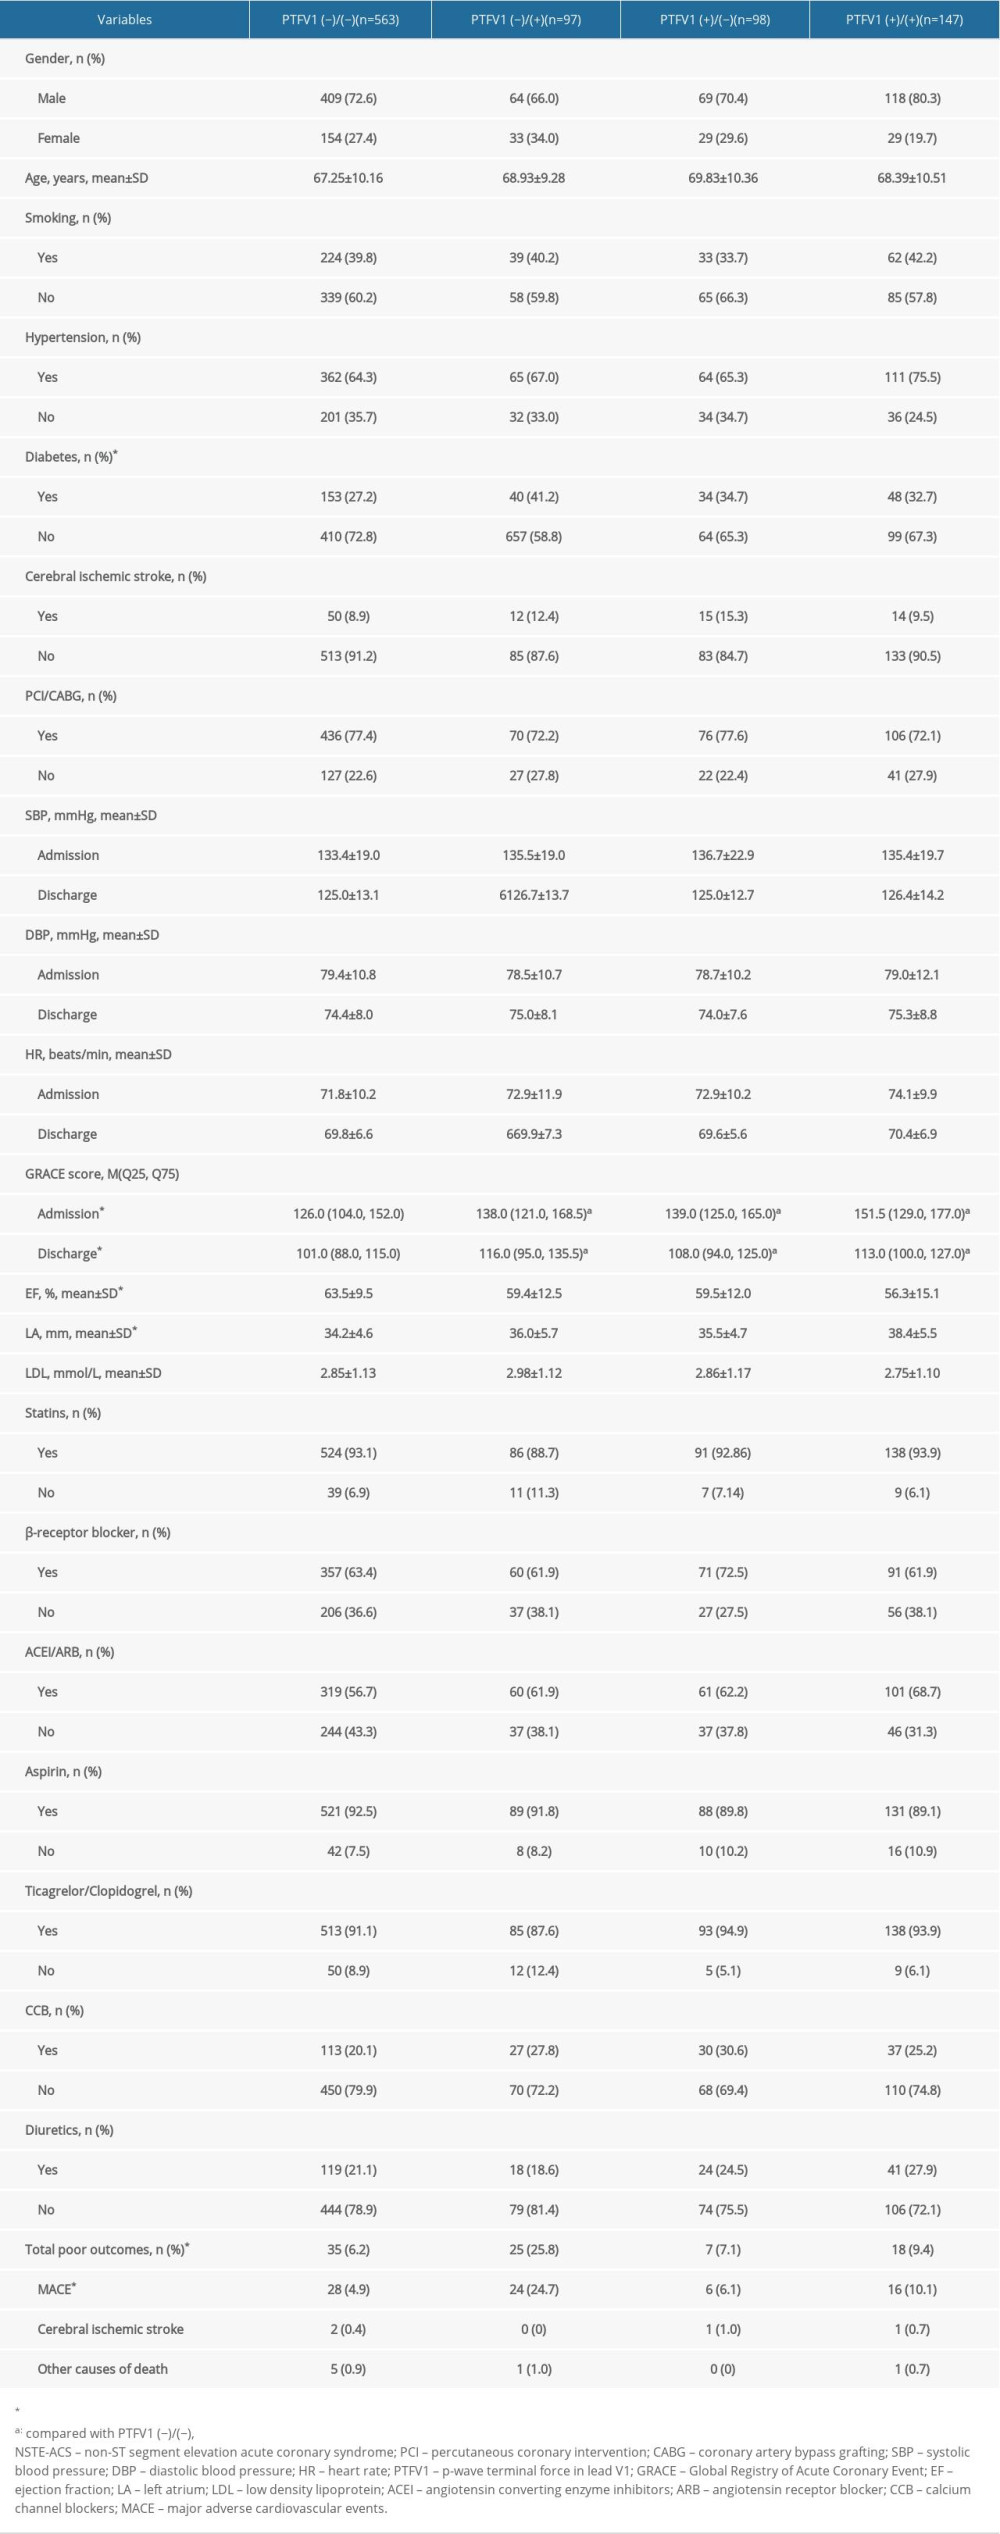 Table 1. The characteristics of NSTE-ACS patients in the four groups.
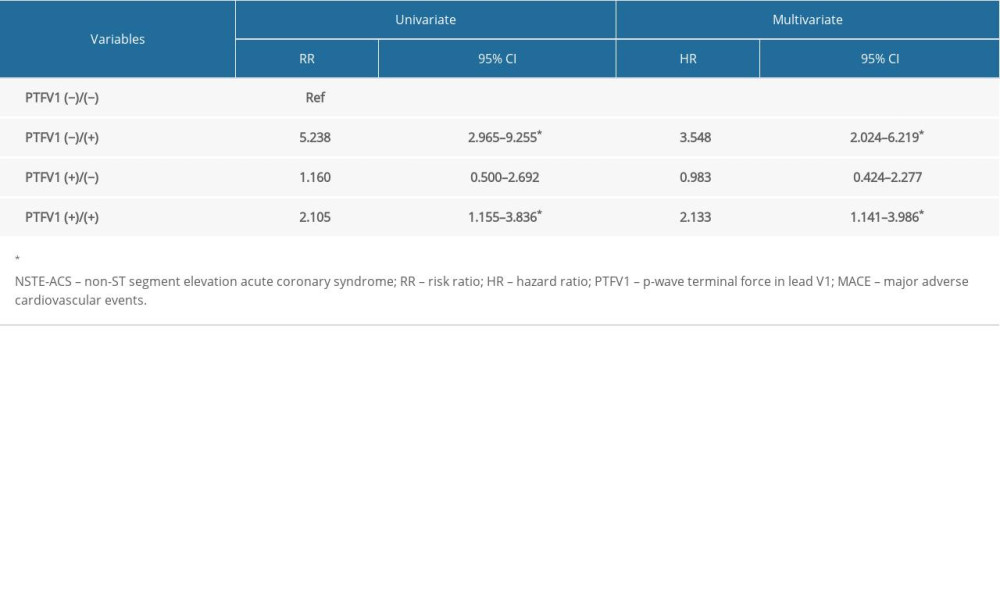 Table 2. Univariate and multivariate regression analysis for patients with NSTE-ACS.Table 1. The characteristics of NSTE-ACS patients in the four groups.Table 2. Univariate and multivariate regression analysis for patients with NSTE-ACS.
 In Press
Clinical Research
Body Weight and Insulin Resistance Indicators Among ChildrenMed Sci Monit In Press; DOI: 10.12659/MSM.951434
Clinical Research
Comparison of Radiographic Cervical Sagittal Alignment Parameters in Patients With Nonspecific Neck Pain, D...Med Sci Monit In Press; DOI: 10.12659/MSM.952950
Clinical Research
Combined Fibrinogen and Urinary α1-Microglobulin as Predictors of Respiratory Tract Infection in Children w...Med Sci Monit In Press; DOI: 10.12659/MSM.951066
Database Analysis
Evaluation of Salivary Total Oxidant Status (TOS) and Total Antioxidant Status (TAS) in Orthodontic Patient...Med Sci Monit In Press; DOI: 10.12659/MSM.952052
Most Viewed Current Articles
17 Jan 2024 : Review article 14,175,576
Vaccination Guidelines for Pregnant Women: Addressing COVID-19 and the Omicron VariantDOI :10.12659/MSM.942799
Med Sci Monit 2024; 30:e942799
13 Nov 2021 : Clinical Research 3,756,620
Acceptance of COVID-19 Vaccination and Its Associated Factors Among Cancer Patients Attending the Oncology ...DOI :10.12659/MSM.932788
Med Sci Monit 2021; 27:e932788
14 Dec 2022 : Clinical Research 2,465,966
Prevalence and Variability of Allergen-Specific Immunoglobulin E in Patients with Elevated Tryptase LevelsDOI :10.12659/MSM.937990
Med Sci Monit 2022; 28:e937990
16 May 2023 : Clinical Research 708,651
Electrophysiological Testing for an Auditory Processing Disorder and Reading Performance in 54 School Stude...DOI :10.12659/MSM.940387
Med Sci Monit 2023; 29:e940387