29 September 2020: Animal Study
Chiropractic Therapy Modulated Gut Microbiota and Attenuated Allergic Airway Inflammation in an Immature Rat Model
Yan Zhu1DEF, Ying Xiong2ADFG*, Yun Gu3BF, Qain Li3BF, Yu Liu4BCDOI: 10.12659/MSM.926039
Med Sci Monit 2020; 26:e926039
Abstract
BACKGROUND: As a type of traditional Chinese massage, chiropractic therapy is applied to prevent and treat children with asthma in China. However, its mechanism of action is unclear. Allergic airway inflammation plays a key role in the occurrence and development of asthma, in which changes in gut microbiota are involved. The present study investigated the influence of chiropractic therapy on allergic airway inflammation (AAI) and gut microbiota in an immature rat model.
MATERIAL AND METHODS: Three-week-old male Sprague-Dawley rats were divided randomly into control (CN), AAI, and chiropractic (CP) groups. AAI and CP groups were sensitized and challenged with ovalbumin (OVA) to induce AAI. The CP group received chiropractic therapy during AAI modelling. AAI was assessed by cell counts in bronchoalveolar lavage fluid and HE staining of lung tissues. Plasma OVA-sIgE, IFN-γ, IL-4, and IL-10 levels were detected by ELISA. DNA extraction from feces samples was used for 16S rRNA gene sequencing and analyzed for gut microbiota by Quantitative Insights Into Microbial Ecology (QIIME).
RESULTS: AAI group had significantly lower richness and diversity of gut microbiota along with Th2 response and allergic airway inflammation. Moreover, the AAI group had lower abundance of butyrate-producing bacterial taxa with more Lactobacillus. Chiropractic therapy significantly increased the richness and diversity of gut microbiota and increased butyrate-producing bacterial taxa and decreased Lactobacillus, along with attenuating Th2 response and allergic airway inflammation during AAI modelling.
CONCLUSIONS: Chiropractic therapy attenuated allergic airway inflammation and optimized gut microbiota in an immature rat model, which might promote the development of adult-like butyrogenic milieu, immunotolerance, and inflammation attenuation.
Keywords: Asthma, Massage, Manipulation, Chiropractic
Background
Asthma is recognized as a chronic inflammatory airway disease, ranking among the top 20 conditions worldwide for disability-adjusted life years in children [1]. Allergic airway inflammation plays a critical role in the development and progression of asthma [2]. T helper 2 cell (Th2) response, characterized by activation of Th2 cytokines and increased production of immunoglobulin (Ig) E, is closely related with the initiation of allergic airway inflammation in asthma [2]. Interleukin-4 (IL-4) is the key effector in Th2 response and is indispensable to induce Th2 cell development and IgE production [3].
The host immune system coordinates the balance of effector and regulatory immune cells, as well as anti- and pro-inflammatory cytokines, through interaction with microbiota in a physical condition [4]. Mounting evidence links the development of asthma to the dysbiosis of gut microbiota [5,6]. A loss of microbial diversity induces skewed Th2 response and promotes asthma development [7,8]. The diversity of gut microbiota is essential to functional redundancy and diversity for consistent establishment of a healthy signature of short-chain fatty acids (SCFAs) [9,10]. Microbe-producing SCFAs can increase IL-10+ T cells, promote naïve T-cell differentiation into interferon (IFN)-γ-producing Th1, and provide protection against inflammatory response [11–13]. IFN-γ, as a key Th1 cytokine, can inhibit IL-4 production and regulate the differentiation and aggregation of eosinophils [14]. IL-10, produced by various T cells, can block Th2 response, induce and maintain immunotolerance, and inhibit inflammation [15,16]. Therefore, regulation of gut microbiota is an important strategy in the primary prevention of allergic diseases [17]. However, so far, the evidence that supports probiotics administration for reducing the risk of children asthma is insufficient [18].
Massage therapy is a traditional healing method and has long been applied to prevent and treat children with asthma in China and in Western countries [19]. A systemic review indicated that massage can significantly enhance the effect of current conventional therapies for children with asthma [19]. However, the underlying mechanism is still unclear. Chiropractic therapy (Nie Ji therapy in Chinese, literally means pinching-along-the-spine therapy) is an important and popular traditional Chinese massage for children [20,21]. Our previous clinical trials showed that chiropractic therapy attenuated the symptoms of allergic diseases, along with possible modulation of gut microbiota [22,23]. Ovalbumin (OVA) sensitization and aerosol challenge are widely used to induce allergic airway inflammation [24]. Therefore, we designed this study to investigate the influence of chiropractic therapy on gut microbiota and OVA-induced allergic airway inflammation (AAI) in an immature rat model.
Material and Methods
ANIMALS:
Male specific pathogen-free (SPF) Sprague-Dawley rats (aged 3 weeks, weight: 47.92±4.38 g, provided by Qinglongshan, Nanjing, China) were kept in Plexiglas cages in the animal experimental laboratory, and were provided with food and water ad libitum under a standard 12/12 h light/dark cycle. The animal protocol was approved by the Animal Care and Use Committee of Nanjing University of Chinese Medicine (No 201805A005). The experiment was conducted in accordance with the National Institutes of Health Guidelines for the Care and Use of Laboratory Animals.
ALLERGIC AIRWAY INFLAMMATION (AAI) MODEL AND GROUP TREATMENTS:
After 4-day acclimatization, all rats were divided randomly into a control group (CN, n=6), an AAI group (n=8), and a chiropractic group (CP, n=8). The AAI model was induced in the AAI group and CP group, in which rats were sensitized on day 9 and day 16 with intraperitoneal (i.p.) injections of 1 mg OVA (OVA, Grade V, Sigma, No A5503) mixed into 1.5 mL 4% Al(OH)3 gel (BF040, Xi’an Heart company, China). From day 23 to day 26, the rats were challenged with 1% OVA aerosol (OVA, Grade V, Sigma, No A5503) for 30 min once a day in a plastic chamber connected to an atomizer (402AI type, Jiangsu Yuwell Medical Instruments Co., Ltd., Jiangsu, China) set at its highest volume. The CN group was treated in the same way, but was sensitized and challenged with saline. Chiropractic therapy was performed in the CP group once a day from day 5 to day 26 before and during OVA-induced modelling (Figure 1). No rats died before sacrifice.
The procedure of chiropractic therapy was performed as follows: The manipulator, who had been trained before the study, put on a disposal mask and gloves, and then held a rat gently in the left palm. First, he stroked the rat’s back slowly with the right hand from the neck to the bottom 20 times (stroking speed: ~5 cm/s, pressure: ~5 N detected by FingerTPS system, Pressure Profile System, Inc, USA). Second, he pinched the back skin with the fingers of right hand and pushed continuously from the bottom to the neck 25 repeats (~10 s/repeat, pressure: ~12 N) from day 5 to day 14 and for 30 repeats from day 15 to day 26 to avoid manipulation adaptation. Finally, he stroked the back up and down 3 times. The manipulating force was moderate to keep rats relatively calm without obvious discomfort or screaming during the whole procedure. The rats in the CN group and AAI group were only housed individually in clean cages for the same duration as the intervention of chiropractic therapy.
On day 27, all rats were anaesthetized with i.p. injections of 5 mL/kg 25% Urethane (No. U2500, Sigma USA). Blood was collected from the abdominal aorta into tubes with ethylene diamine tetraacetic acid. Plasma was isolated by centrifugation at 3000 rpm for 20 min at 4.0°C. The supernatant was collected and stored at −80°C. Bronchoalveolar lavage fluid (BALF) was collected immediately after blood collection. The trachea was punctured with a 12-gauge gavage needle and 3 ml PBS was slowly injected into the left lung, and then withdrawn and injected again 5 times to collect BALF. The middle lobe of the right lung was collected and put into a flasket containing 4% buffered formalin solution for hematoxylin-eosin (HE) staining. Two fresh fecal pellets from the colon were collected from rats and frozen immediately in liquid nitrogen and stored at −80°C for gut microbiota analysis.
INFLAMMATORY CELL COUNTS IN BALF:
Total inflammatory cells were counted by automatic cell counter (Countstar IC1000, Shanghai China). The collected BALF was centrifuged at 5000 rpm for 10 min at 4°C and the remaining cell pellets were made into cell smears. Different types of inflammatory cells were observed by Wright-Giemsa staining following the manufacturer’s instructions (G1020, Solarbio, Beijing China). Cells were differentially counted under light microscopy (DP71/BX60, Olympus Corp., Tokyo, Japan).
HISTOPATHOLOGICAL OBSERVATION OF THE LUNG BY HE STAINING:
The samples were dehydrated, embedded in paraffin, and cut into 4-μm sections for routine HE staining (agents provided by Sinopharm Beijing, China; Baso, Zhuhai, China). Images were obtained under light microscopy (DP71/BX60, Olympus Corp., Tokyo, Japan).
MEASUREMENT OF PLASMA OVA-SIGE, IFN-γ, IL-4, AND IL-10 LEVELS BY ENZYME-LINKED IMMUNOSORBENT ASSAY (ELISA):
The plasma levels of OVA-sIgE, IFN-γ, IL-4, and IL-10 were measured by ELISA according to the manufacturer’s protocol (JEB-15429, JEB-13737, JEB-13730, JEB-13734 JinYibai, Nanjing, China). Every sample was duplicated to mitigate biases.
DNA EXTRACTION AND 16S RRNA GENE SEQUENCING FOR GUT MICROBIOTA:
Fecal pellets were homogenized using a beadbeating method (FastPrep bead matrix E, MP Biomedicals, Santa Ana, CA), and total DNA was extracted with the E.Z.N.A., R Stool DNA Kit (SKU: D4015-02 Omega Bio-tek, Norcross, GA) following the manual. Purity and quality of the genomic DNA were checked on 0.8% agarose gels. The V3–4 hypervariable region of bacterial 16S rRNA gene were amplified as previously described [25]. PCR products were purified with a QIAquick Gel Extraction Kit (28704, QIAGEN, Germany), quantified by RT-PCR, and sequenced at Allwegene, China. Every sample were processed in triplicate to mitigate reaction-level PCR biases. Deep sequencing was performed on the Miseq platform.
STATISTICAL ANALYSES:
For gut microbiota sequencing, the dataset was analyzed by VSEARCH. The sequences were clustered into operational taxonomic units (OTUs) at 97% similarity level [25]. Alpha diversity indices were calculated at OTUs in Quantitative Insights Into Microbial Ecology (QIIME), including observed species, Chao1 richness index, and Shannon diversity index [26]. To compare differences in bacterial composition between the groups, the analysis of similarities (ANOSIM) was performed on unweighted UniFrac distance matrixes and presented as principal coordinate analysis (PCoA) [27,28]. Linear discriminant analysis effect size (LEfSe) was used to detect typical abundant taxa among groups [29]. Based on LEfSe, the comparison of the relative abundance of bacterial taxa between groups was analyzed by Metastats [30].
Data are expressed as mean±standard deviation (SD). Except for the analysis of gut microbiota mentioned above, the differences of other data among groups were analyzed by one-way analysis of variance (ANOVA) and differences between 2 groups were analyzed by two-tailed
Results
CHIROPRACTIC THERAPY ATTENUATED ALLERGIC AIRWAY INFLAMMATION (AAI):
Compared with the CN group, OVA sensitization and challenge significantly increased the total numbers of inflammatory cells and eosinophils in the AAI group (P<0.001, P<0.001; Figure 2), and increased the numbers of lymphocytes and neutrophils (P<0.001, P<0.01; Figure 2). To further investigate the inflammation status, the histopathological changes of the lungs were assessed by HE staining. The AAI group showed obvious infiltration of inflammatory cells around the bronchioles and arteries and in the lungs. Moreover, the AAI group showed constricted bronchioles and thicker walls (Figure 3). These results indicated that OVA sensitization and challenge induced AAI in immature rats. Compared with the AAI group, chiropractic therapy remarkably decreased the counts of total inflammatory cells, eosinophils, lymphocytes, and neutrophils (P<0.01, P<0.01, P<0.01, P<0.05; Figure 2), along with less infiltration of inflammatory cells and without obviously thicker walls of bronchioles (Figure 3).
CHIROPRACTIC THERAPY INCREASED THE PRODUCTION OF IFN-γ AND IL-10 AND ATTENUATED TH2 RESPONSE:
Compared with the CN group, the AAI group showed significantly increased levels of OVA-sIgE and IL-4 (P<0.01, P<0.001; Figure 4A, 4B), along with significantly lower levels of IFN-γ (P<0.05; Figure 4C). IL-10 levels in the AAI group decreased but not significantly compared with the CN group (P>0.05; Figure 4D). Chiropractic therapy significantly decreased the production of OVA-sIgE and IL-4 (P<0.05, P<0.05; Figure 4A, 4B) and significantly enhanced the production of IFN-γ and IL-10 (P<0.05, P <0.05; Figure 4C, 4D) during AAI modelling compared with the AAI group.
CHIROPRACTIC THERAPY INCREASED THE RICHNESS AND DIVERSITY OF GUT MICROBIOTA:
A total of 12 phyla and 137 genera were identified among groups. Compared with the CN group, the number of observed species as shown by Chao 1 and Shannon indices were decreased significantly in the AAI group (P<0.05, P<0.05, P<0.01; Figure 5A–5C). Therefore, OVA-induced AAI led to significant loss of the richness and abundance of gut microbiota in immature rats. Chiropractic therapy significantly increased the number of observed species, Chao 1 and Shannon indices compared with the AAI group (P<0.05, P<0.05, P<0.001; Figure 5A–5C), indicating that chiropractic therapy attenuated the loss of richness and diversity of gut microbiota during AAI modelling.
TAXONOMIC CHARACTERIZATION OF THE GUT MICROBIAL PROFILE AMONG GROUPS:
To characterize the general differences in gut microbial communities among groups, PCoA was performed on unweighted UniFrac distances (Figure 6). The PCoA plots demonstrated significant separation between the CN and AAI groups (P<0.05) as well as between CP and AAI groups (P<0.01) and no significant separation between the CP and CN group (P>0.05). LEfSe was performed to determine typical abundant bacterial taxa as respective biomarkers among groups. The following were over-represented in the AAI group as Phylum Firmicutes, class Bacilli, family Lactobacillaceae, genus Lactobacillus, species Lactobacillus_vaginalis and Lactobacillus_gasseri, whereas order NB1_n and genus Ruminiclostridium_1 and Ruminococcaceae_UCG_014 were over-represented in the CN group. The higher abundance of Lactobacillus explained the higher abundance of phylum Firmicutes in AAI immature rats (Figure 7A, 7B). In the CP group, Phyla Bacteroidetes and Proteobacteria, class Bacteroidia, families Bacteroidales_S24_7_group, Prevotellaceae, Ruminococcaceae and Staphylococcaceae were over-represented (all LDA score >2, P<0.05; Figure 7A, 7B).
CHIROPRACTIC THERAPY MODULATED BACTERIAL TAXONOMIC COMPOSITION:
To know more about the differential taxonomic composition among groups, the comparison of relative abundance of selected bacterial taxa at phylum, family, genus, and species levels were performed in detail based on LEfSe results. At the phylum level, gut microbiota was mainly composed of Firmicutes, Bacteroidetes, Proteobacteria, Actinobacteria, and Saccharibacteria among the groups. In the AAI group, the relative abundance of Bacteroidetes, Proteobacteria, and Saccharibacteria significantly decreased (P<0.05, P<0.01, P<0.01; Figure 8A, 8B) and the relative abundance of Firmicutes increased (P<0.01; Figure 8A, 8B) compared with the CN group. Compared with the AAI group, the CP group showed significantly decreased abundance of Firmicutes (P<0.05; Figure 8A, 8B) and increased abundance of Bacteroidetes, Proteobacteria, and Saccharibacteria (P<0.01, P <0.01, P<0.01; Figure 8A, 8B). At the family level, the AAI group had significantly lower abundance of Ruminococcaceae and Bacteroidales_S24_7_group (P<0.01, P<0.01; Figure 9A) as well as higher abundance of Lactobacillaceae, but without a significant difference (P=0.056 >0.05; Figure 9A). Compared with the AAI group, the CP group had higher abundance of Ruminococcaceae, Bacteroidales_S24_7_group and Prevotellaceae (P<0.01, P<0.01, P<0.001; Figure 9A), as well as lower Lactobacillaceae (P<0.01; Figure 9A). At the genus level, the AAI group had lower abundance of several genera such as Roseburia, Ruminococcus_1, Ruminococcaceae _UCG-014 compared with the CN group (P<0.05, P<0.05, P<0.01; Figure 10A, 10B). The CP group had higher Roseburia, Ruminococcus_1 (P<0.01, P<0.05; Figure 10A, 10B) and decreased Lactobacillus (P<0.05; Figure 10A, 10B) compared with the AAI group. At the species level, the AAI group had higher abundance of Lactobacillus_vaginalis and Lactobacillus_gasseri compared with the CN group (P<0.01, P<0.05; Figure 9B). The CP group had lower abundance of Lactobacillus_vaginalis and Lactobacillus_gasseri compared with the AAI group (P<0.01, P<0.01; Figure 9B).
Discussion
We found that OVA sensitization and challenge caused skewed Th2 response and allergic airway inflammation in immature rats. Moreover, OVA sensitization and challenge caused loss of gut microbiota richness and diversity, which is consistent with the results of a previous OVA-induced asthmatic animal study [31]. Meanwhile, except for the extreme high abundance of phylum Firmicutes, the abundances of other major phyla were generally lower in AAI immature rats.
Unexpectedly, AAI immature rats had a higher abundance of
In our study, AAI rats had less butyrate-producing bacteria such as
Massage is reported to improve the immunity [39] and have good effects on improving asthma [19,40]. As a Chinese traditional massage, chiropractic therapy was initially applied for indigestion among children by pinching the skin along the spine, and it demonstrates very good clinical effects in the treatment of various digestive problems among children [20,21]. It has now become a popular therapy for prevention and treatment of allergic diseases in pediatric massage departments. Clinical studies showed that chiropractic therapy significantly decreased nighttime symptom scores and acute attack times and enhanced clinical therapeutic effect among children with asthma [41,42]. However, its mechanism is still unclear. Our previous study indicated that chiropractic therapy protected intestinal epithelium barrier and helped with anti-inflammation via promoting the production of specialized proresolving mediators in an animal experiment [43] and helped with the improvement of allergic diseases in clinical studies [22,23].
The present study revealed that chiropractic therapy significantly increased the richness and diversity of gut microbiota during AAI modelling. Moreover, chiropractic therapy increased the main butyrate-producing bacterial taxa such as families
Animal experiments demonstrated that chiropractic therapy can improve the gastrointestinal dysfunction by regulating abnormal levels of brain-gut peptides (BGPs), including cholecystokinin-8 (CCK-8), ghrelin, vasoactive intestinal peptide (VIP), and substance P (SP), either in plasma, in the colon, or in the hypothalamus [47–49]. BGPs are critical neurotransmitters, which not only modulate gastrointestinal function [50,51] but also participate in the interaction between gut microbiota and brain-gut axis [52]. It is well known that the brain can also influence gut microbiota indirectly by regulating gastrointestinal motility and secretion, or directly by releasing signaling molecules [52]. Results of the present study and previous studies indicate that chiropractic therapy can optimize gut microbiota, partially via regulating BGPs production and the brain-gut axis.
However, there is certain limitation in our study. Firstly, our study did not evaluate the production of SCFAs; therefore, there is no direct evidence for a causal relationship between SCFAs and allergic airway inflammation. Secondly, our study did not test BGPs level since previous studies have already focused on it. Thirdly, the sample size of animals was small in our study and thus limited the statistical power. Further investigations are warranted based on this preliminary study.
Conclusions
To the best of our knowledge, this is the first study to assess the effect of massage on gut microbiota. In brief, our study indicated that AAI coexisted with dysbiosis of gut microbiota in immature rats and chiropractic therapy attenuated allergic airway inflammation and significantly modulated the gut microbiota. Chiropractic therapy might facilitate the development of a more adult-like butyrogenic environment, which can promote immunotolerance and inflammation attenuation. Our study supports chiropractic therapy as a good adjunct therapy for children with asthma and other allergic diseases.
Figures
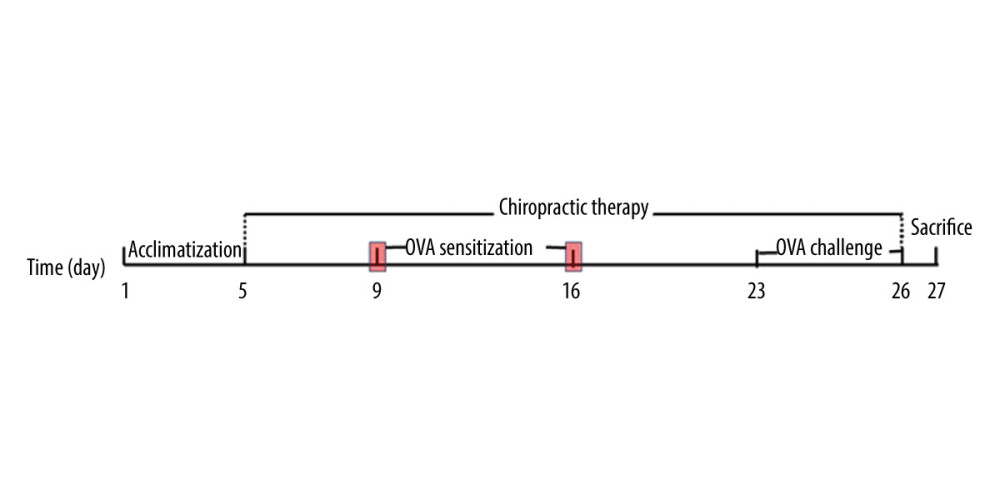 Figure 1. Experiment protocol.
 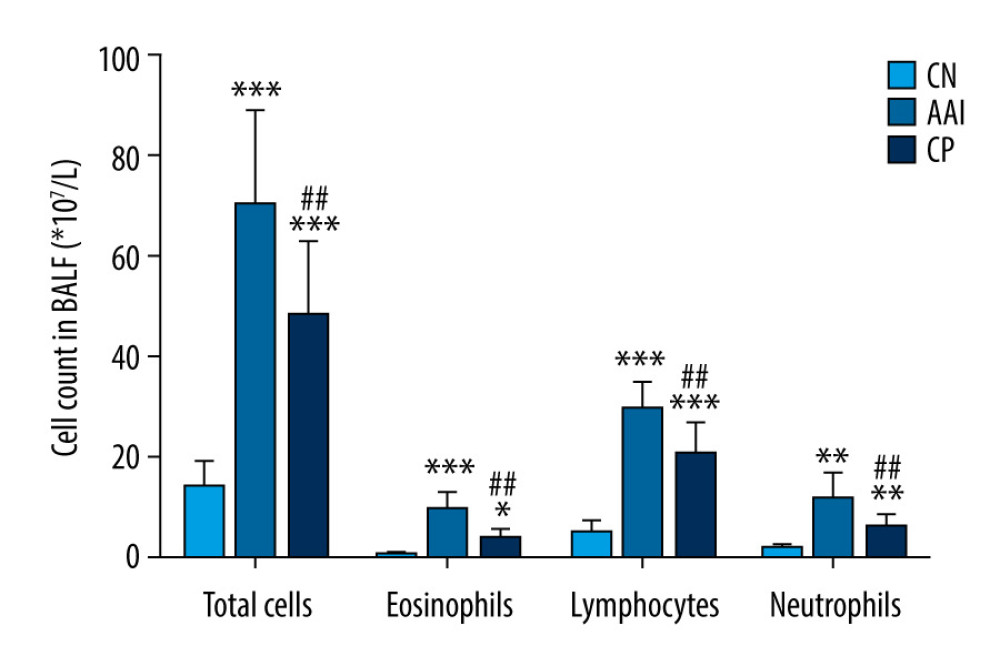 Figure 2. Cell count in BALF. Total cells in BALF were counted by automatic cell counter. Different types of inflammatory cells were counted by Wright-Giemsa staining. n=6~8, * P<0.05, ** P<0.01, *** P<0.001 vs. CN group; # P<0.05, ## P<0.01 vs. AAI group.
  Figure 3. Hematoxylin-eosin staining of lung tissues. Compared with the CN group, the AAI group showed much more infiltration of inflammatory cells around the bronchioles, arteries, and in the lungs (as the black arrows directed) along with constricted bronchioles and thicker walls. The CP group showed less infiltration of inflammatory cells without obviously thicker walls of bronchioles compared with the AAI group.
 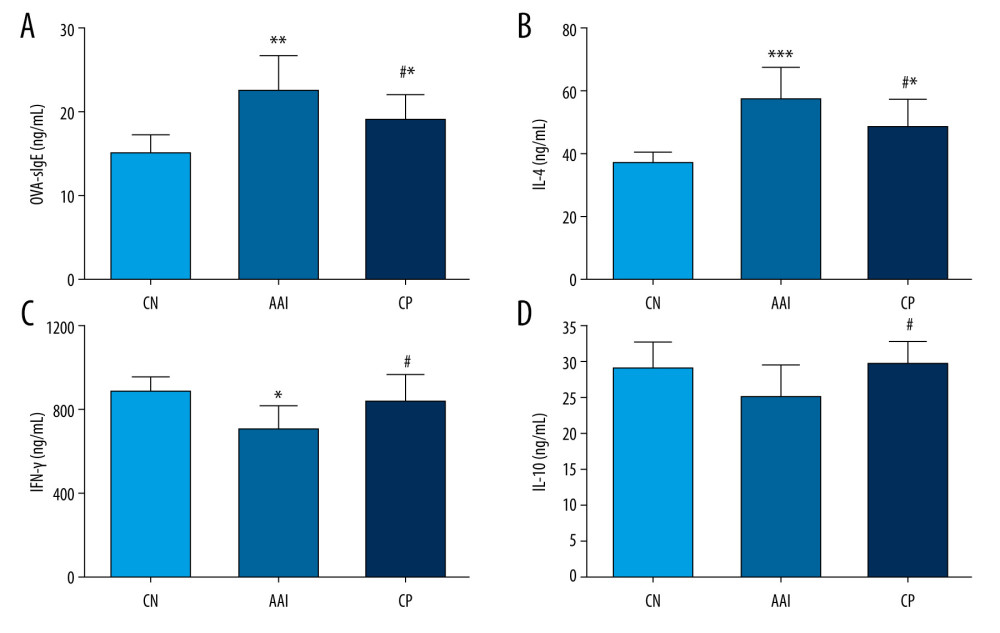 Figure 4. Plasma levels of OVA-sIgE, IL-4, IFN-, and IL-10. (A–D) All these indexes were measured in duplicate by ELISA (n=6~8). * P<0.05, ** P<0.01, *** P<0.001 vs. CN group; # P<0.05 vs. AAI group.
  Figure 5. The altered richness and diversity of gut microbiota represented by observed species, Chao1, and Shannon indexes. (A–C) These analyses were based on 16S rRNA gene sequencing. Every sample was processed in triplicate (n=5). * P<0.05, ** P<0.01 vs. CN group; # P<0.05, ### P<0.001 vs. AAI group.
 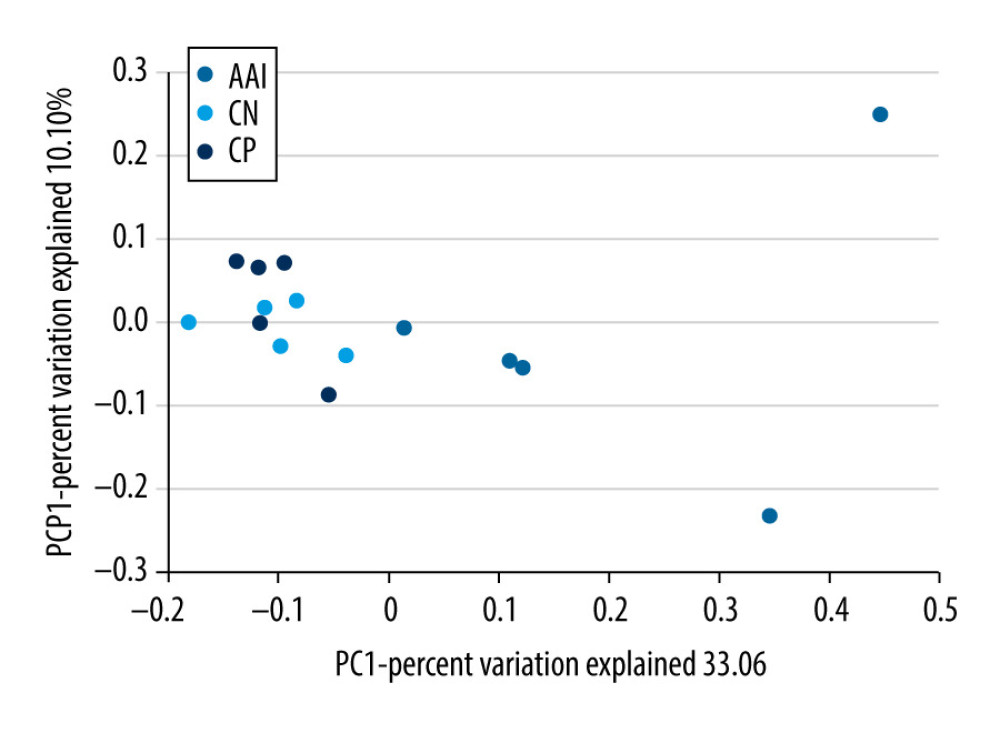 Figure 6. PCoA of unweighted UniFrac distances among groups (PCoA plots with Principal Coordinates (PC) 1 and PC 2). Each dot stands for a sample. ANOSIM reveals significant separation between the CN and AAI groups (P<0.05) as well as between the CP and AAI groups (P<0.01) and no significant separation between the CP and CN groups (P>0.05).
 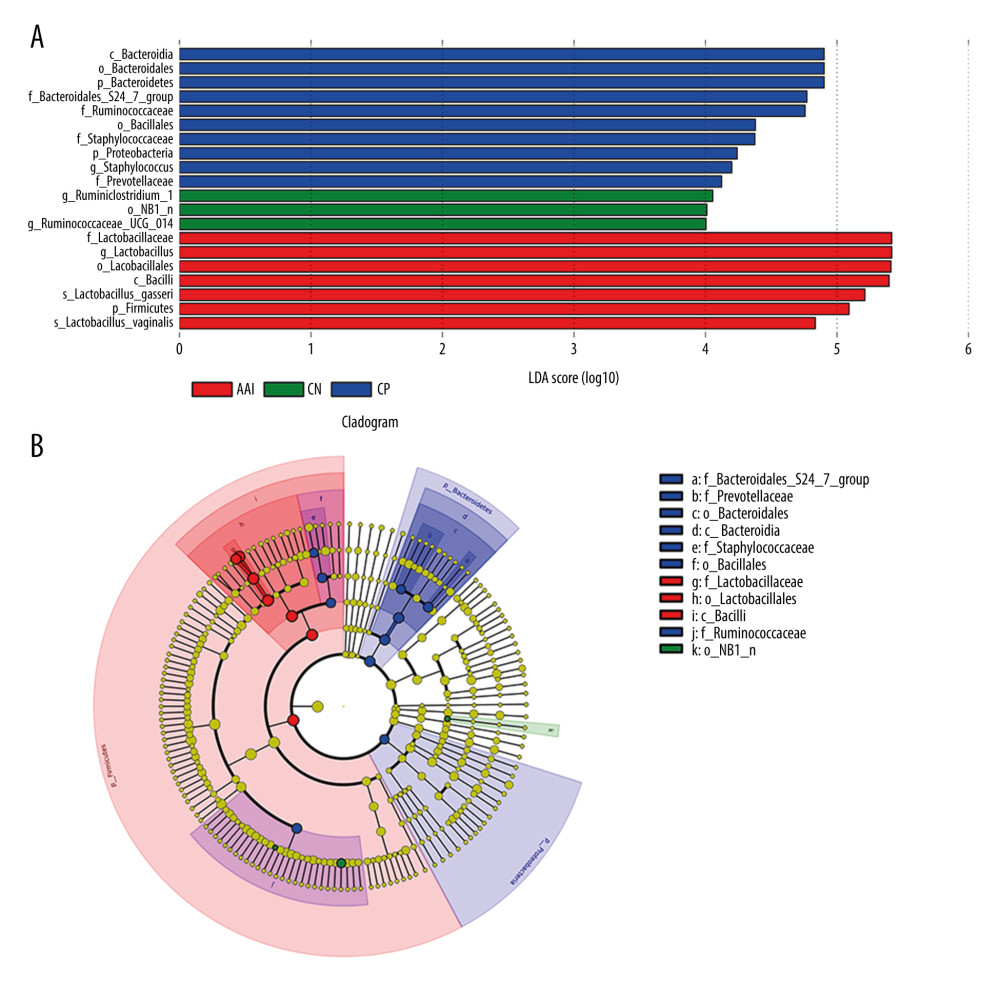 Figure 7. LEfSe based on 16 S rRNA gene sequences. (A) Histogram of the LDA scores demonstrates differentially abundant bacterial taxa among 3 groups (P<0.05, LDA score >2.0). (B) Cladogram shows the taxonomic distribution of differentially abundant bacterial taxa from phylum to family among 3 groups.
 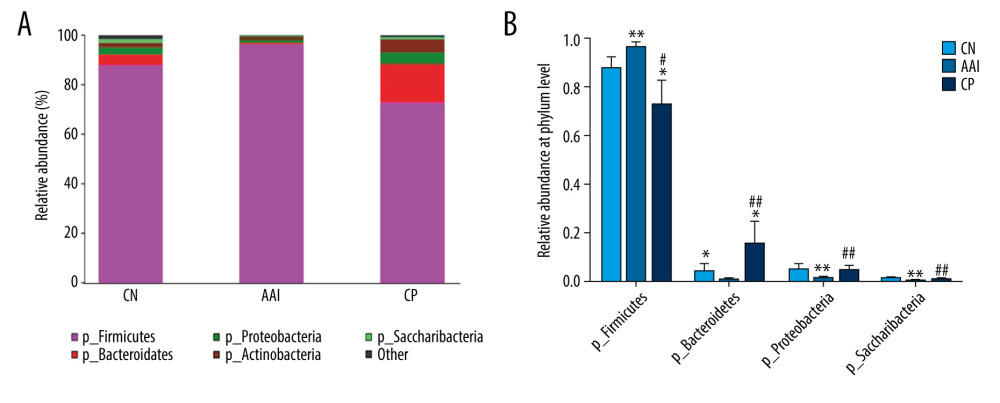 Figure 8. Relative abundance comparison of major phyla of gut microbiota among groups. (A) Bacterial composition and relative abundances at the phylum level among groups. (B) Relative abundance comparison of major phyla among groups. * P<0.05, ** P<0.01 vs. CN group; # P <0.05, ## P<0.01 vs. AAI group.
 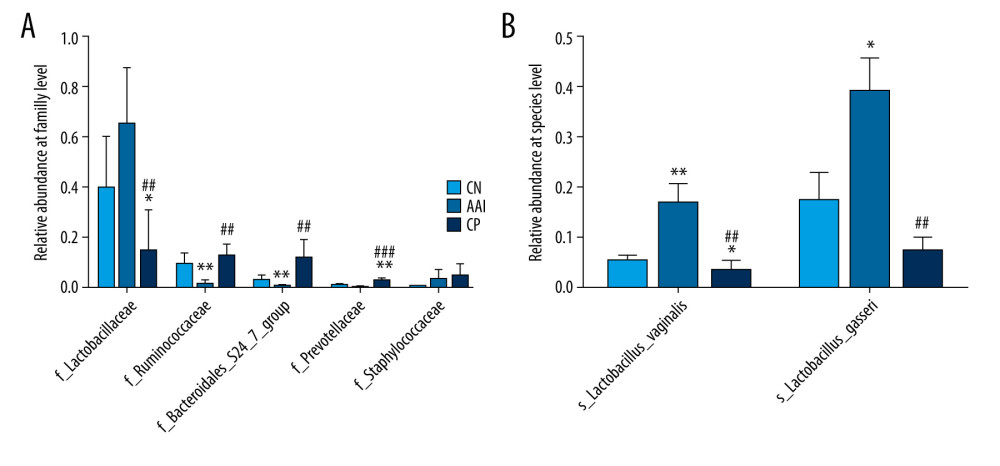 Figure 9. Relative abundance comparison of biomarker families and species of gut microbiota among groups. (A, B) * P<0.05, ** P<0.01, *** P<0.001 vs. CN group; ## P<0.01, ### P<0.001 vs. AAI group.
 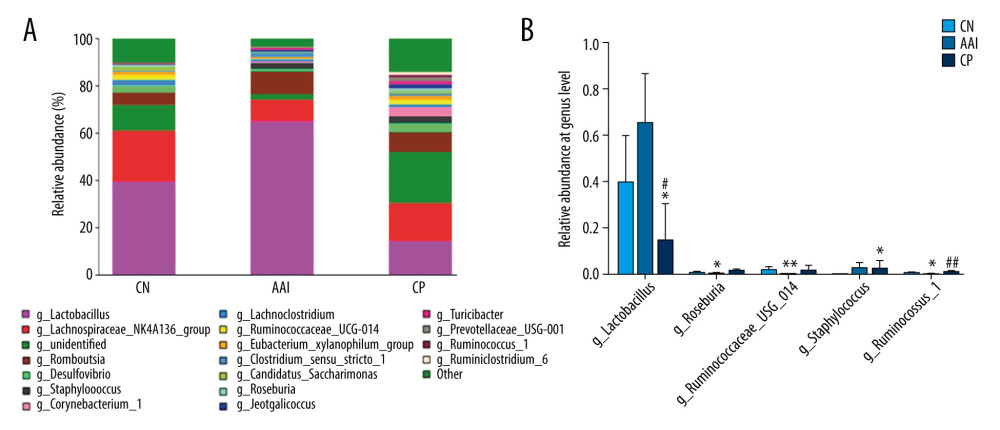 Figure 10. Relative abundance comparison of major genera of gut microbiota among groups. (A) Bacterial composition and relative abundances at the genus level among groups. (B) Relative abundance comparison of major genera among groups. * P<0.05, ** P<0.01 vs. CN group; # P<0.05, ## P <0.01 vs. AAI group.
 References
1. Vos T, Flaxman AD, Naghavi M, Years lived with disability (YLDs) for 1160 sequelae of 289 diseases and injuries 1990–2010: A systematic analysis for the Global Burden of Disease Study 2010: Lancet, 2012; 380(9859); 2163-96
2. Foster PS, Maltby S, Rosenberg HF, Modeling TH2 responses and airway inflammation to understand fundamental mechanisms regulating the pathogenesis of asthma: Immunol Rev, 2017; 278(1); 20-40
3. Patel TR, Sur S, IgE and eosinophils as therapeutic targets in asthma: Curr Opin Allergy Clin Immunol, 2017; 17(1); 42-49
4. Macia L, Thorburn AN, Binge LC, Microbial influences on epithelial integrity and immune function as a basis for inflammatory diseases: Immunol Rev, 2012; 245(1); 164-76
5. Stiemsma LT, Turvey SE, Asthma and the microbiome: Defining the critical window in early life: Allergy Asthma Clin Immunol, 2017; 13; 3
6. Zimmermann P, Messina N, Mohn WW, Association between the intestinal microbiota and allergic sensitization, eczema, and asthma: A systematic review: J Allergy Clin Immunol, 2019; 143; 467-85
7. Patrick DM, Sbihi H, Dai DLY, Decreasing antibiotic use, the gut microbiota, and asthma incidence in children-evidence from population-based and prospective cohort studies: Lancet Respir Med, 2020 [Online ahead of print]
8. Russell SL, Gold MJ, Hartmann M, Early life antibiotic-driven changes in microbiota enhance susceptibility to allergic asthma: EMBO Rep, 2012; 13; 440-47
9. Cummings JH, Pomare EW, Branch WJ, Short chain fatty acids in human large intestine, portal, hepatic and venous blood: Gut, 1987; 28; 1221-27
10. Bauer E, Thiele I, From metagenomic data to personalized in silico microbiotas-predicting dietary supplements for Crohn’s disease: NPJ Syst Biol Appl, 2018; 4; 27
11. Park J, Kim M, Kang SG, Short-chain fatty acids induce both effector and regulatory T cells by suppression of histone deacetylases and regulation of the mTOR-S6K pathway: Mucosal Immunol, 2015; 8; 80-93
12. Sun MM, Wu W, Chen L, Microbiota-derived short-chain fatty acids promote Th1 Cell IL-10 production to maintain intestinal homeostasis: Nat Commun, 2018; 9(1); 3555
13. Vinolo MA, Rodrigues HG, Nachbar RT, Curi R, Regulation of inflammation by short chain fatty acids: Nutrients, 2011; 3(12); 858-76
14. Larche M, Robinson DS, Kay AB, The role of T lymphocytes in the pathogenesis of asthma: J Allergy Clin Immunol, 2003; 111(3); 450-63 quiz 464
15. Enk AH, Saloga J, Becker D: J Exp Med, 1994; 179; 1397-402
16. Groux H, O’Garra A, Bigler M, A CD4+T-cell subset inhibits antigen-specific T cell responses and prevents colitis: Nature, 1997; 389; 737-42
17. West CE, Dzidic M, Prescott SL, Jenmalm MC, Bugging allergy; Role of pre-, pro- and synbiotics in allergy prevention: Allergol Int, 2017; 66(4); 529-38
18. Elazab N, Mendy A, Gasana J, Probiotic administration in early life, atopy, and asthma – a meta-analysis of clinical trials: Pediatrics, 2013; 132(3); e666-76
19. Wu J, Yang XW, Zhang M, Massage therapy in children with asthma: A systematic review and meta-analysis: Evid Based Complement Alternat Med, 2017; 2017 5620568
20. Li JX, Li MY, Wang HApplication status and manipulation analysis of chiropractic therapy in the treatment of pediatric diseases: CJTCMP, 2018; 33(1); 325-28 [in Chinese]
21. Ezzat R, Shen Y, Yu TYFormation and development of chiropractic therapy: CJTCMP, 2019; 34(6); 2784-86 [in Chinese]
22. Liu Y, Gu YH, Xiong Y, Wrist-ankle acupuncture combined with pinching along the spine for children allergic rhinitis: A randomized controlled trial: World Journal of Acupuncture – Moxibustion, 2019; 29; 259-63
23. Xiong Y, Noraas AU, Yang XYThe effect of chiropractic manipulation on the atopic symptoms and gut microbes in atopic children: Lishizhen Medicine and Materia Medica Research, 2017; 28(10); 2440-42 [in Chinese]
24. Wang W, Luo X, Zhang Q, Bifidobacterium infantis relieves allergic asthma in mice by regulating Th1-Th2: Med Sci Monit, 2020; 26; e920583
25. Wang C, Li W, Wang H, Saccharomyces boulardii alleviates ulcerative colitis carcinogenesis in mice by reducing TNF-α and IL-6 levels and functions and by rebalancing intestinal microbiota: BMC Microbiol, 2019; 19(1); 246
26. Caporaso JG, Kuczynski J, Stombaugh J, QIIME allows analysis of high-throughput community sequencing data: Nat Methods, 2010; 7; 335-36
27. Lozupone CA, Hamady M, Kelley ST, Quantitative and qualitative beta diversity measures lead to different insights into factors that structure microbial communities: Appl Environ Microbiol, 2007; 73; 1576-85
28. Ramette A, Multivariate analyses in microbial ecology: FEMS Microbiol Ecol, 2007; 62; 142-60
29. Segata N, Izard J, Waldron L, Metagenomic biomarker discovery and explanation: Genome Biol, 2011; 12; R60
30. White JR, Nagarajan N, Pop M, Statistical methods for detecting differentially abundant features in clinical metagenomic samples: PLoS Comput Biol, 2009; 5(4); 1000352
31. Kong YH, Shi Q, Han N, Structural modulation of gut microbiota in rats with allergic bronchial asthma treated with recuperating lung decoction: Biomed Environ Sci, 2016; 29(8); 574-83
32. Ilinskaya ON, Ulyanova VV, Yarullina DR, Gataullin IG, Secretome of intestinal Bacilli: A natural guard against pathologies: Front Microbiol, 2017; 8; 1666
33. Wopereis H, Sim K, Shaw A, Intestinal microbiota in infants at high risk for allergy: Effects of prebiotics and role in eczema development: J Allergy Clin Immunol, 2018; 141(4); 1334-42
34. Wopereis H, Oozeer R, Knipping K, The first thousand days-intestinal microbiology of early life: Establishing a symbiosis: Pediatr Allergy Immunol, 2014; 25; 428-38
35. Calderón-Pérez L, Gosalbes MJ, Yuste S, Gut metagenomic and short chain fatty acids signature in hypertension: A cross-sectional study: Sci Rep, 2020; 10(1); 6436
36. Wang W, Chen L, Zhou R, Increased proportions of Bifidobacterium and the Lactobacillus group and loss of butyrate-producing bacteria in inflammatory bowel disease: J Clin Microbiol, 2014; 5(2); 398-406
37. Han MM, Zhu XY, Peng YF, The alterations of gut microbiota in mice with chronic pancreatitis: Ann Transl Med, 2019; 7(18); 464
38. Evans CC, LePard KJ, Kwak JW, Exercise prevents weight gain and alters the gut microbiota in a mouse model of high fat diet-induced obesity: PLoS One, 2014; 9; e92193
39. Major B, Rattazzi L, Brod S, Massage-like stroking boosts the immune system in mice: Sci Rep, 2015; 5; 10913
40. Field T, Henteleff T, Hernandez-Reif M, Children with asthma have improved pulmonary function after massage therapy: J Pediatr, 1998; 132; 854-58
41. Li JX, Zeng YY, Shen XClinical observation on the therapeutic effect of chiropractic therapy in the treatment of asthma in children: Chinese Modern Distance Education of China, 2016; 14(13); 106-7 [in Chinese]
42. Chen OY, Li Y, Zhong J, Shuai YF, Clinical effects of chiropractic therapy on pediatric asthma during the remission stage: Journal of TCM University of Hunan, 2013; 33(3); 76-84 [in Chinese]
43. Xiong Y, Song ZX, Gu Y, Effect of chiropractic manipulation on disrupted epithelium barrier and its mechanism of specialized pro-resolving mediators in a spleen-deficiency murine model: J Tradit Chin Med, 2019; 39(5); 678-84
44. Chassard C, Bernalier-Donadille A, H2 and acetate transfers during xylan fermentation between a butyrate-producing xylanolytic species and hydrogenotrophic microorganisms from the human gut: FEMS Microbiol Lett, 2006; 254; 116-22
45. Zhu L, Liao R, Tu W, Pyrodextrin enhances intestinal function through changing the intestinal microbiota composition and metabolism in early weaned piglets: Appl Microbiol Biotechnol, 2020; 104(9); 4141-54
46. Noma T, Sugawara Y, Ogawa N, Dermatophagoides-induced interleukin-10 production by peripheral blood lymphocytes from patients with asthma in remission: Pediatr Allergy Immunol, 2004; 15(5); 459-68
47. Li XC, Liu YC, Li MY, Wang H, Influence of chiropractic therapy on contents of ghrelin and vasoactive intestinal peptide in rabbit with bradygastria: CJTCMP, 2016; 31(2); 637-39 [in Chinese]
48. Li SD, Wang XG, Wu GXEffect of chiropractic therapy on gastrointestinal motility and SP in immature rats with spleen deficiency: Journal of Guiyang University of Chinese Medicine, 2017; 39(1); 20-23 [in Chinese]
49. Wu GX, Cui J, Xiang KW, Huang D, The influence of chiropractic therapy on plasma CCK-8 and β-EP in rats with dyspepsia: Jiangsu TCM, 2008; 42(2); 79-80 [in Chinese]
50. , Food intake, satiety and peptide hormones of the brain–gut axis: Nutr Rev, 1983; 41(1); 20-22
51. Murthy SN, Ganiban G, Effect of the secretin family of peptides on gastric emptying and small intestinal transit in rats: Peptides, 1988; 9(3); 583-88
52. Rhee SH, Pothoulakis C, Mayer EA, Principles and clinical implications of the brain-gut-enteric microbiota axis: Nat Rev Gastroenterol Hepatol, 2009; 6(5); 306-14
Figures
 Figure 1. Experiment protocol.
 Figure 2. Cell count in BALF. Total cells in BALF were counted by automatic cell counter. Different types of inflammatory cells were counted by Wright-Giemsa staining. n=6~8, * P<0.05, ** P<0.01, *** P<0.001 vs. CN group; # P<0.05, ## P<0.01 vs. AAI group.
 Figure 3. Hematoxylin-eosin staining of lung tissues. Compared with the CN group, the AAI group showed much more infiltration of inflammatory cells around the bronchioles, arteries, and in the lungs (as the black arrows directed) along with constricted bronchioles and thicker walls. The CP group showed less infiltration of inflammatory cells without obviously thicker walls of bronchioles compared with the AAI group.
 Figure 4. Plasma levels of OVA-sIgE, IL-4, IFN-, and IL-10. (A–D) All these indexes were measured in duplicate by ELISA (n=6~8). * P<0.05, ** P<0.01, *** P<0.001 vs. CN group; # P<0.05 vs. AAI group.
 Figure 5. The altered richness and diversity of gut microbiota represented by observed species, Chao1, and Shannon indexes. (A–C) These analyses were based on 16S rRNA gene sequencing. Every sample was processed in triplicate (n=5). * P<0.05, ** P<0.01 vs. CN group; # P<0.05, ### P<0.001 vs. AAI group.
 Figure 6. PCoA of unweighted UniFrac distances among groups (PCoA plots with Principal Coordinates (PC) 1 and PC 2). Each dot stands for a sample. ANOSIM reveals significant separation between the CN and AAI groups (P<0.05) as well as between the CP and AAI groups (P<0.01) and no significant separation between the CP and CN groups (P>0.05).
 Figure 7. LEfSe based on 16 S rRNA gene sequences. (A) Histogram of the LDA scores demonstrates differentially abundant bacterial taxa among 3 groups (P<0.05, LDA score >2.0). (B) Cladogram shows the taxonomic distribution of differentially abundant bacterial taxa from phylum to family among 3 groups.
 Figure 8. Relative abundance comparison of major phyla of gut microbiota among groups. (A) Bacterial composition and relative abundances at the phylum level among groups. (B) Relative abundance comparison of major phyla among groups. * P<0.05, ** P<0.01 vs. CN group; # P <0.05, ## P<0.01 vs. AAI group.
 Figure 9. Relative abundance comparison of biomarker families and species of gut microbiota among groups. (A, B) * P<0.05, ** P<0.01, *** P<0.001 vs. CN group; ## P<0.01, ### P<0.001 vs. AAI group.
 Figure 10. Relative abundance comparison of major genera of gut microbiota among groups. (A) Bacterial composition and relative abundances at the genus level among groups. (B) Relative abundance comparison of major genera among groups. * P<0.05, ** P<0.01 vs. CN group; # P<0.05, ## P <0.01 vs. AAI group.
 In Press
12 Mar 2024 : Clinical Research
Preoperative Blood Transfusion Requirements for Hemorrhoidal Severe Anemia: A Retrospective Study of 128 Pa...Med Sci Monit In Press; DOI: 10.12659/MSM.943126
12 Mar 2024 : Clinical Research
Tissue Inhibitors of Metalloproteinase 1 (TIMP-1) and 3 (TIMP-3) as New Markers of Acute Kidney Injury Afte...Med Sci Monit In Press; DOI: 10.12659/MSM.943500
12 Mar 2024 : Review article
Optimizing Behçet Uveitis Management: A Review of Personalized Immunosuppressive StrategiesMed Sci Monit In Press; DOI: 10.12659/MSM.943240
12 Mar 2024 : Clinical Research
Metabolomic Alterations in Methotrexate Treatment of Moderate-to-Severe PsoriasisMed Sci Monit In Press; DOI: 10.12659/MSM.943360
Most Viewed Current Articles
17 Jan 2024 : Review article
Vaccination Guidelines for Pregnant Women: Addressing COVID-19 and the Omicron VariantDOI :10.12659/MSM.942799
Med Sci Monit 2024; 30:e942799
14 Dec 2022 : Clinical Research
Prevalence and Variability of Allergen-Specific Immunoglobulin E in Patients with Elevated Tryptase LevelsDOI :10.12659/MSM.937990
Med Sci Monit 2022; 28:e937990
16 May 2023 : Clinical Research
Electrophysiological Testing for an Auditory Processing Disorder and Reading Performance in 54 School Stude...DOI :10.12659/MSM.940387
Med Sci Monit 2023; 29:e940387
01 Jan 2022 : Editorial
Editorial: Current Status of Oral Antiviral Drug Treatments for SARS-CoV-2 Infection in Non-Hospitalized Pa...DOI :10.12659/MSM.935952
Med Sci Monit 2022; 28:e935952


