05 May 2021: Clinical Research
Chest Computed Tomography (CT) Severity Scales in COVID-19 Disease: A Validation Study
Bartosz Mruk12ABCDEF*, Dominika Plucińska2BC, Jerzy Walecki32AD, Gabriela Półtorak-Szymczak2EF, Katarzyna Sklinda32ADEFGDOI: 10.12659/MSM.931283
Med Sci Monit 2021; 27:e931283


Abstract
BACKGROUND: Imaging-based quantitative assessment of lung lesions plays a key role in patient triage and therapeutic decision-making processes. The aim of our study was to validate the Total Severity Score (TSS), Chest Computed Tomography Score (CT-S), and Chest CT Severity Score (CT-SS) scales, which were used to assess the extent of lung inflammation in patients with SARS-CoV-2 infection in terms of interobserver agreement and the correlation of scores with patient clinical condition on the day of the study.
MATERIAL AND METHODS: A total of 77 chest CT scans collected from 77 consecutive patients hospitalized because of SARS-CoV-2 were included. The scans were assessed independently by 2 radiologists aware of the patients’ positive results of RT-PCR tests. Each chest CT was assessed according to the 3 scales. To assess the interobserver agreement of CT scan assessments, Cohen’s k and intraclass correlation coefficient (ICC) were calculated.
RESULTS: For the overall assessment, the k was 0.944 and the ICC was 0.948 for the TSS; the κ was 0.909 and the ICC was 0.919 for the CT-S; and the k was 0.888 and the ICC was 0.899 for the CT-SS. The CT-SS (r=0.627 for Radiologist 1 and r=0.653 for Radiologist 2) revealed the strongest positive correlation with the patient clinical condition as expressed using the Modified Early Warning Score.
CONCLUSIONS: The interobserver agreement for the 3 evaluated scales was very good. The CT-SS was found to have the strongest positive relationship with the Modified Early Warning Score.
Keywords: COVID-19, Diagnostic Imaging, multidetector computed tomography, COVID-19, Image Processing, Computer-Assisted, Observer Variation, Radiography, Thoracic, Reproducibility of Results, SARS-CoV-2, Severity of Illness Index, Tomography, X-Ray Computed
Background
The computed tomography (CT) scan of the chest is the primary imaging modality used in the evaluation of patients with SARS-CoV-2 infection [1–18]. Several studies have shown a relationship between the extent of inflammatory lung changes seen in a chest CT scan and the clinical course of a disease and prognosis [19–22]. The quantitative assessment of lung lesions plays a key role in patient triage and therapeutic decision-making processes [19–22]. To date, no standardized and widely used method has been established for the quantitative assessment of pulmonary lesions in COVID-19. During a pandemic, automatic segmentation methods facilitating precise assessment of the volume of inflammatory lesions are not always available. Therefore, studies assessing the prognostic value of CT scans have been mostly based on the use of dedicated scoring scales [19–21].
Kunwei et al [20] first presented the Total Severity Score, which the authors used to assess each of the 5 lobes of both lungs for the presence of inflammatory abnormalities such as mixed ground-glass opacities, ground-glass opacities, and consolidations. Using the Total Severity Score, each lobe is assessed using a range of 0 to 4 points, depending on the percentage of lobe involvement: 0 indicates 0% involvement; 1 indicates 1% to 25%; 2 indicates 26% to 50%; 3 indicates 51% to 75%; and 4 indicates 76% to 100%. The Total Severity Score is then obtained by summing the points of the 5 lobes (range 0 to 20 points).
The Chest CT Score was introduced by Li et al [21]. In their study, both lungs were divided into 5 lobes, with each lobe being assessed individually. Each lobe is assigned a score of 0 to 5, depending on the percentage of lobe involvement: 0 indicates 0% involvement; 1 indicates less than 5%; 2 indicates 5% to 25%; 3 indicates 26% to 49%; 4 indicates 50% to 75%; and 5 indicates more than 75% involvement.
The Chest CT Severity Score was proposed by Yang et al [19]]. The score is an adaptation of a method used in 2005 during the SARS epidemic. The scale makes use of lung opacification as the marker for the extent of lung involvement. Using the Chest CT Severity Score, the 18 segments of both lungs are divided into 20 regions with the posterior apical segment of the left upper lobe being subdivided into posterior and apical segmental regions, and the anteromedial basal segment of the left lower lobe being subdivided into basal and anterior segmental regions. Next, in those 20 lung regions, lung opacities are subjectively evaluated using a chest CT. Each of the regions could be assigned a score of 0 for 0% parenchymal opacification involvement; 1 point for 1% to 50% involvement; and 2 points for 51% to 100% involvement. The overall score is determined by the summing the points of the 20 lung segment regions, with a total score ranging from 0 to 40 points.
The objective of our study was to validate the 3 aforementioned scales, which we used to assess the extent of lung inflammation in patients with SARS-CoV-2 infection, in terms of interobserver agreement and the correlation of scores with the clinical condition of the patient on the day of the study.
Material and Methods
A total of 77 chest CT scans collected from 77 consecutive patients hospitalized with SARS-CoV-2 infection at the Central Clinical Hospital of the Ministry of the Interior in Warsaw were analyzed in this study. CT scans were performed on a 16-detector CT scanner, with patients in the supine position during a single inspiratory breath-hold, with the scanning range from the apex of the lungs in the costophrenic angle. The CT scan parameters were as follows: 80 to 120 KVp, 100 mAs; slice thickness of 1.2 mm; and pitch of 1.2. The CT scans were reviewed for lung parenchyma using a working station equipped with OsiriX MD v.8.0.2 software at a window width of 1500 HU and a level of −600 HU.
Two radiologists (B.M. and D.P.) assessed the scans independently. Each of them had 7 years of professional experience. The radiologists were informed on the positive results of the RT-PCR tests for SARS-CoV-2, while having no access to the results of other laboratory tests, clinical data, or previous imaging scans.
Three scales were applied to assess chest CT scans: the Total Severity Score, ranging from 0 to 4 points for each of the 5 lung lobes (total score of 0 to 20 points); the Chest CT Score, ranging from 0 to 5 points for each of the 5 lung lobes (total score of 0 to 25 points); and the Chest CT Severity Score, ranging from 0 to 2 points for each of the 20 lung segments (total score of 0 to 40 points).
To assess the interobserver agreement of CT scan assessments, the Cohen’s κ and intraclass correlation coefficient (ICC) were calculated. Owing to the ordinal nature of the scales, the weighted Cohen’s κ coefficient was applied. The weights were selected using the Fleiss-Cohen method [23]. The ICC (3, k) coefficients were calculated relative to absolute agreement. The weighted κ values were interpreted according to the method of McHugh [24], while the ICCs were interpreted according to the method of Koo and Li [25]. Agreement was defined as moderate (κ >0.4–0.6), good (κ >0.6–0.8), or very good (κ >0.8–1.0).
To analyze correlations between the patient clinical condition on the day of the scan and the extent of pulmonary lesions seen in the chest CT scan, all patients whose tests were included in the study were evaluated using the Modified Early Warning Score, which covers measurements of systolic blood pressure, heart rate, respiratory rate, body temperature, and level of consciousness [26] (Table 1). The Pearson linear correlation coefficient was used for the analysis of the correlation between the extent of inflammatory lesions and the clinical condition of the patient. The correlation coefficient was defined as low (
This study was approved by the Bioethics Committee of the Central Clinical Hospital of the Ministry of the Interior in Warsaw.
Results
The interobserver agreement for Total Severity Score assessment was very good. For the overall assessment, the κ was 0.944 (95% confidence interval [CI] 0.948–0.941) and the ICC was 0.948 (95% CI 0.949–0.947). There were no significant differences between the interobserver agreement within the 5 individual lung lobes: the upper-right lobe, κ=0.938 and ICC = 0.944; the middle-right lobe, κ=0.945 and ICC=0.947; the lower-right lobe, κ=0.937 and ICC=0.944; the upper-left lobe, κ=0.937 and ICC=0.944; and the lower-left lobe, κ=0.938 and ICC=0.944 (Table 2).
For the overall assessment using the Chest CT Score, the κ was 0.909 (95% CI 0.914–0.904) and the ICC was 0.919 (95% CI 0.919–0.918). The interobserver agreement of assessments within the 5 individual lung lobes was similar: the upper-right lobe, κ=0.910 and ICC=0.915; the middle-right lobe, κ=0.914 and ICC=0.917; the lower-right lobe, κ=0.907 and ICC=0.913; the upper-left lobe, κ=0.913 and ICC=0.917; and the lower-left lobe, κ=0.907 and ICC=0.914 (Table 3).
The 40-point Chest CT Severity Score was characterized by very good rater-to-rater agreement. For the overall assessment, the κ was 0.888 (95% CI 0.895–0.886) and the ICC was 0.899 (95% CI 0.899–0.898). Comparable agreement was obtained for the assessments of the right lung (κ=0.888, 95% CI 0.895–0.886 and ICC=0.898, 95% CI 0.899–0.898) and the left lung (κ=0.891, 95% CI 0.892–0.884 and ICC=0.899, 95% CI 0.899–0.898) (Table 4).
Of the 3 scales used to assess the extent of lung lesions in the course of SARS-CoV-2 infection, the strongest positive correlation with patient clinical condition as expressed using the Modified Early Warning Score was observed for the Chest CT Severity Score (
Discussion
The 3 analyzed scales had very good interobserver agreement. The slight differences observed in the conformity of the assessments might have been due to the complexity of the scales. The highest level of agreement was obtained for the Total Severity Score (0–20 total points; 0–4 points for each lung lobe; κ=0.944 and ICC=0.948). For the Chest CT Score (0–25 total points; 0–5 points for each lobe), the κ was 0.909 and the ICC was 0.919. For the most complex scale, the Chest CT Severity Score (0–40 total points; 0–2 points for each segment), the κ was 0.888 and the ICC was 0.899. The agreement levels for the Total Severity Score and the Chest CT Severity Score scales were similar to those reported by other authors (ICC of 0.976 and 0.925, respectively) [19,20]. The Chest CT Score had not yet been validated for interobserver agreement in COVID-19 patients.
The analysis of correlations between the clinical condition of the patient expressed using the Modified Early Warning Score and the extent of inflammatory lesions observed on CT scan revealed a strong positive correlation for each of the 3 scales analyzed. We observed a relationship between the detail of the scale and the level of correlation with a patient’s clinical condition. The strongest positive relationship was observed for the Chest CT Severity Score (r=0.627 and 0.653). For the Chest CT Score, Pearson’s
Conclusions
The analysis of the conformity of the assessments of pulmonary lesions developed over the course of COVID-19 by the same 2 independent radiologists was characterized by very good agreement of the assessments using each of the 3 analyzed scales. The highest interobserver agreement was achieved with the Total Severity Score. However, the Chest CT Severity Score was distinguishable from among the 3 scales in terms of correlation with patient clinical condition. Further tests are required to validate these scales in the context of disease course prediction and prognosis. The apparent relationship between the detail of the scale and the level of correlation with patient clinical condition highlights the value of accurate and quantitative assessments of pulmonary lesions in patients with SARS-CoV-2 infection. Our findings point to the need for and the importance of the wide availability of automated image segmentation methods and the capability for volumetric assessments of disease-involved and unremarkable pulmonary parenchyma.
Tables
Table 1. The Modified Early Warning Score.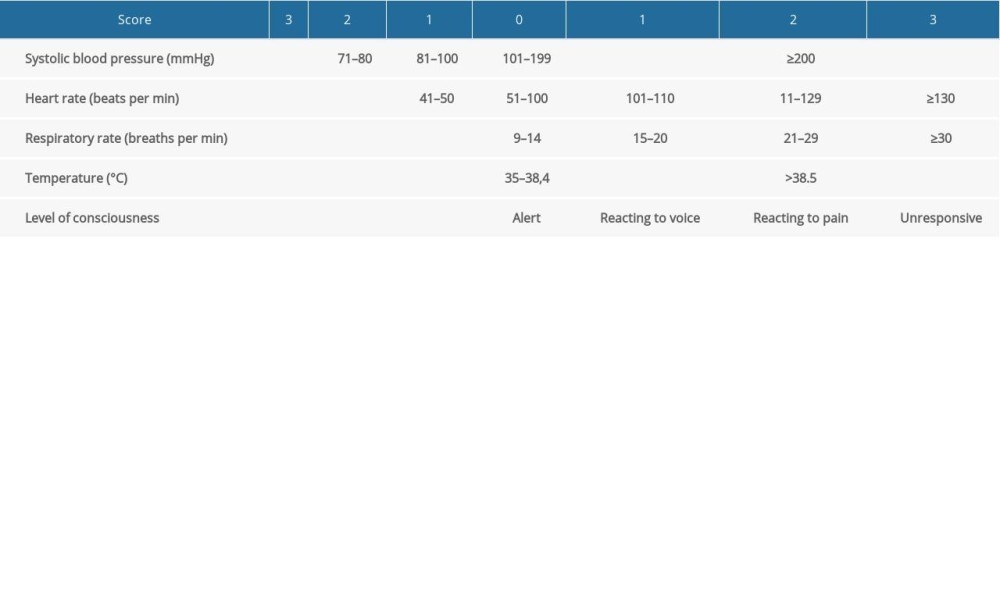 Table 2. Analysis of the interobserver agreement of Total Severity Score-based assessments of chest computed tomography scans. The table presents the κ and intraclass correlation coefficient values for the overall assessment as well as for the assessments of individual lung lobes.
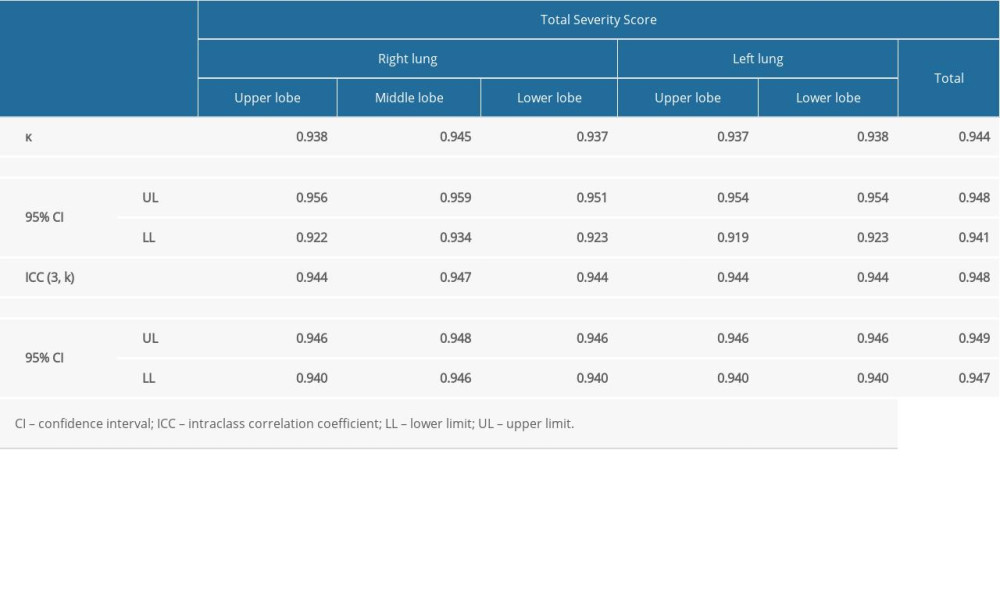 Table 3. Analysis of the interobserver agreement of Chest Computed Tomography (CT) Score-based assessments of CT scans. The table presents the κ and intraclass correlation coefficient values for the overall assessment as well as for the assessments of individual lung lobes.
 Table 4. Analysis of the interobserver agreement of Chest Computed Tomography (CT) Severity Score-based assessments of CT scans. The table presents the κ and intraclass correlation coefficient values for the overall assessment as well as for the assessments of the right and the left lung.
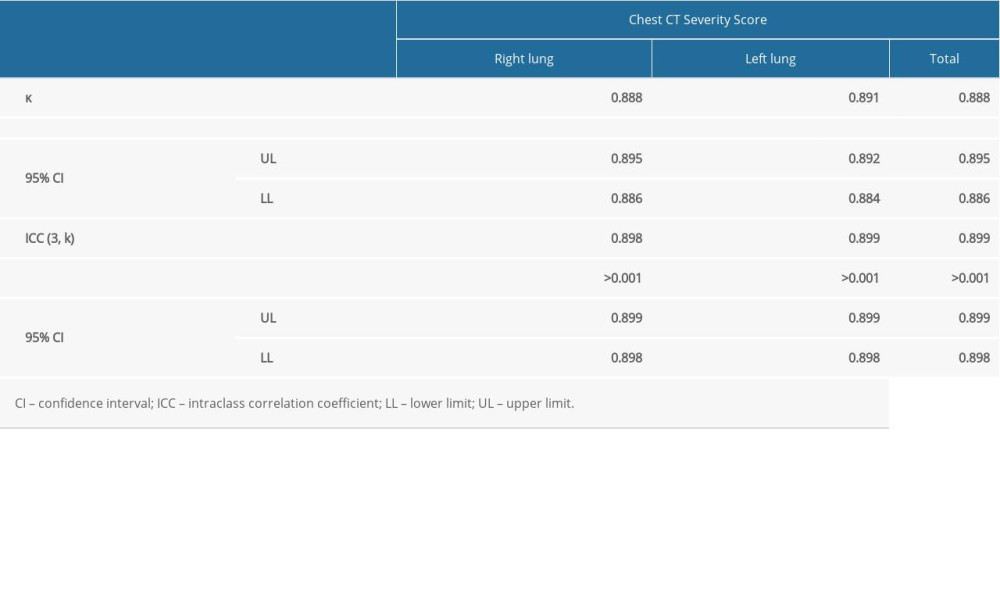 Table 5. Analysis of correlations between the extent of lung lesions as assessed using the Total Severity Score, Chest Computed Tomography (CT) Score, and Chest CT Severity Score and patient clinical condition as assessed using the Modified Early Warning Score on the day of the scan.
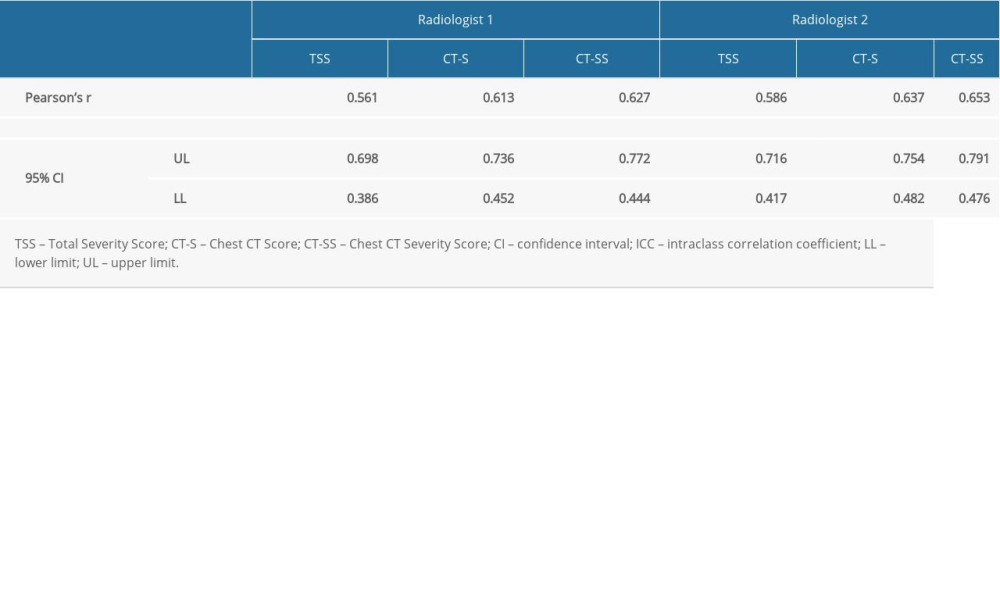
References
1. Lei J, Li J, Li X, Qi X, CT imaging of the 2019 novel coronavirus (2019-nCoV) pneumonia: Radiology, 2020; 295(1); 18
2. Wang J, Xu Z, Wang J, CT characteristics of patients infected with 2019 novel coronavirus: Association with clinical type: Clin Radiol, 2020; 75(6); 408-14
3. Zhou S, Wang Y, Zhu T, Xia L, CT features of coronavirus disease 2019 (COVID-19) pneumonia in 62 patients in Wuhan, China: Am J Roentgenol, 2020; 214(6); 1287-94
4. Steinberger S, Lin B, Bernheim A, CT features of coronavirus disease (COVID-19) in 30 pediatric patients: Am J Roentgenol, 2020; 215(6); 1303-11
5. Li M, Peng W, Chen M, CT imaging features and image evolution characteristics of coronavirus disease 2019: Zhong Nan Da Xue Xue Bao Yi Xue Ban, 2020; 45(3); 243-49
6. Ojha V, Mani A, Pandey NN, CT in coronavirus disease 2019 (COVID-19): A systematic review of chest CT findings in 4410 adult patients: Eur Radiol, 2020; 30(11); 6129-38
7. Wan S, Li M, Ye Z, CT manifestations and clinical characteristics of 1115 patients with coronavirus disease 2019 (COVID-19): A systematic review and meta-analysis: Acad Radiol, 2020; 27(7); 910-21
8. Wei J, Lei P, Yang H, Analysis of thin-section CT in patients with coronavirus disease (COVID-19) after hospital discharge: Clin Imaging, 2020; 28(3); 383-89
9. Luo Z, Wang N, Liu P, Association between chest CT features and clinical course of Coronavirus Disease 2019: Respir Med, 2020; 168; 105989
10. Liu Z, Jin C, Wu CC, Association between initial chest CT or clinical features and clinical course in patients with coronavirus disease 2019 pneumonia: Korean J Radiol, 2020; 21(6); 736-45
11. Li Y, Yang Z, Ai T, Association of “initial CT” findings with mortality in older patients with coronavirus disease 2019 (COVID-19): Eur Radiol, 2020; 30(11); 6186-93
12. Fang X, Zhao M, Li S, Changes of CT findings in a 2019 novel coronavirus (2019-nCoV) pneumonia patient: QJM, 2020; 113(4); 271-72
13. Wang H, Wei R, Rao G, Zhu J, Song B, Characteristic CT findings distinguishing 2019 novel coronavirus disease (COVID-19) from influenza pneumonia: Eur Radiol, 2020; 30(9); 4910-17
14. Zhao X, Liu B, Yu Y, The characteristics and clinical value of chest CT images of novel coronavirus pneumonia: Clin Radiol, 2020; 75(5); 335-40
15. Carotti M, Salaffi F, Sarzi-Puttini P, Chest CT features of coronavirus disease 2019 (COVID-19) pneumonia: key points for radiologists: Radiol Med, 2020; 125; 636-46
16. Bernheim A, Mei X, Huang M, Chest CT findings in coronavirus disease-19 (COVID-19): Relationship to duration of infection: Radiology, 2020; 295(3); 200463
17. Wu J, Wu X, Zeng W, Chest CT findings in patients with coronavirus disease 2019 and its relationship with clinical features: Invest Radiol, 2020; 55(5); 257-61
18. Jedrusik P, Gaciong Z, Sklinda K, Diagnostic role of chest computed tomography in coronavirus disease 2019: Pol Arch Intern Med, 2020; 130(6); 520-28
19. Yang R, Li X, Liu H, Chest CT Severity Score: An imaging tool for assessing severe COVID-19: Radiol Cardiothorac Imag, 2020; 2(2); e200047
20. Li K, Fang Y, Li W, CT image visual quantitative evaluation and clinical classification of coronavirus disease (COVID-19): Eur Radiol, 2020; 30(8); 4407-16
21. Li K, Wu J, Wu F, The clinical and chest CT features associated with severe and critical COVID-19 pneumonia: Invest Radiol, 2020; 55(6); 327-31
22. Colombi D, Bodini FC, Petrini M, Well-aerated lung on admitting chest CT to predict adverse outcome in COVID-19 pneumonia: Radiology, 2020; 296(2); E86-96
23. Fleiss JL, Cohen J, The equivalence of weighted kappa and the intraclass correlation coefficient as measures of reliability: Educational and Psychological Measurement, 1973; 33(3); 613-19
24. McHugh ML, Interrater reliability: The kappa statistic: Biochem Med (Zagreb), 2012; 22(10); 276-82
25. Koo TK, Li MY, A guideline of selecting and reporting intraclass correlation coefficients for reliability research: J Chiropr Med, 2016; 15(3); 155-63
26. Subbe CP, Kruger M, Rutherford P, Gemmel L, Validation of a modified Early Warning Score in medical admissions: QJM, 2001; 94(10); 521-26
Tables
Table 1. The Modified Early Warning Score.Table 2. Analysis of the interobserver agreement of Total Severity Score-based assessments of chest computed tomography scans. The table presents the κ and intraclass correlation coefficient values for the overall assessment as well as for the assessments of individual lung lobes.Table 3. Analysis of the interobserver agreement of Chest Computed Tomography (CT) Score-based assessments of CT scans. The table presents the κ and intraclass correlation coefficient values for the overall assessment as well as for the assessments of individual lung lobes.Table 4. Analysis of the interobserver agreement of Chest Computed Tomography (CT) Severity Score-based assessments of CT scans. The table presents the κ and intraclass correlation coefficient values for the overall assessment as well as for the assessments of the right and the left lung.Table 5. Analysis of correlations between the extent of lung lesions as assessed using the Total Severity Score, Chest Computed Tomography (CT) Score, and Chest CT Severity Score and patient clinical condition as assessed using the Modified Early Warning Score on the day of the scan. In Press
Clinical Research
Effects of Single-Bout Endurance Exercise Intensity on Peripheral Neurotrophic Factors in Patients With Isc...Med Sci Monit In Press; DOI: 10.12659/MSM.952089
Review article
Anisodus tanguticus in Cancer Research: A Review of Traditional Use, Phytochemistry, Extraction Methods, an...Med Sci Monit In Press; DOI: 10.12659/MSM.952999
Clinical Research
Nasal Mucociliary Clearance and Its Relationship With Disease Severity in Patients With Multiple SclerosisMed Sci Monit In Press; DOI: 10.12659/MSM.952850
Clinical Research
Modified Thoracoabdominal Nerves Block Through the Perichondrial Approach vs Subcostal Transversus Abdomini...Med Sci Monit In Press; DOI: 10.12659/MSM.953976
Most Viewed Current Articles
17 Jan 2024 : Review article 14,176,570
Vaccination Guidelines for Pregnant Women: Addressing COVID-19 and the Omicron VariantDOI :10.12659/MSM.942799
Med Sci Monit 2024; 30:e942799
13 Nov 2021 : Clinical Research 3,762,188
Acceptance of COVID-19 Vaccination and Its Associated Factors Among Cancer Patients Attending the Oncology ...DOI :10.12659/MSM.932788
Med Sci Monit 2021; 27:e932788
14 Dec 2022 : Clinical Research 2,466,310
Prevalence and Variability of Allergen-Specific Immunoglobulin E in Patients with Elevated Tryptase LevelsDOI :10.12659/MSM.937990
Med Sci Monit 2022; 28:e937990
16 May 2023 : Clinical Research 708,927
Electrophysiological Testing for an Auditory Processing Disorder and Reading Performance in 54 School Stude...DOI :10.12659/MSM.940387
Med Sci Monit 2023; 29:e940387