10 July 2022: Clinical Research
Automatic Identification of Depression Using Facial Images with Deep Convolutional Neural Network
Xinru Kong1CE, Yan Yao1BC, Cuiying Wang1BC, Yuangeng Wang1BF, Jing Teng2DG, Xianghua Qi2AG*DOI: 10.12659/MSM.936409
Med Sci Monit 2022; 28:e936409


Abstract
BACKGROUND: Depression is a common disease worldwide, with about 280 million people having depression. The unique facial features of depression provide a basis for automatic recognition of depression with deep convolutional neural networks.
MATERIAL AND METHODS: In this study, we developed a depression recognition method based on facial images and a deep convolutional neural network. Based on 2-dimensional images, this method quantified the binary classification problem and distinguished patients with depression from healthy participants. Network training consisted of 2 steps: (1) 1020 pictures of depressed patients and 1100 pictures of healthy participants were used and divided into a training set, test set, and validation set at the ratio of 7: 2: 1; and (2) fully connected convolutional neural network (FCN), visual geometry group 11 (VGG11), visual geometry group 19 (VGG19), deep residual network 50 (ResNet50), and Inception version 3 convolutional neural network models were trained.
RESULTS: The FCN model achieved an accuracy of 98.23% and a precision of 98.11%. The Vgg11 model achieved an accuracy of 94.40% and a precision of 96.15%. The Vgg19 model achieved an accuracy of 97.35% and a precision of 98.13%. The ResNet50 model achieved an accuracy of 94.99% and a precision of 98.03%. The Inception version 3 model achieved an accuracy of 97.10% and a precision of 96.20%.
CONCLUSIONS: The results show that deep convolution neural networks can support the rapid, accurate, and automatic identification of depression.
Keywords: Nerve Net, facial recognition, Depression, Deep Learning, Humans, Neural Networks, Computer
Background
Depression is one of the most common mental disorders. According to the International Classification of Diseases (ICD-10) [1], patients with depression often exhibit extreme symptoms, such as mental distress, depression, loss of interest and pleasure, and suicidal ideation and behavior. Currently, depression has become one of the major factors of the global disease burden. According to a report by the World Health Organization, there were 322 million patients with depression worldwide in 2017, accounting for 4.4% of the world population; depression is expected to surpass cardiovascular disease and become the leading cause of disability by 2030 [2]. Moderate to severe recurrent depression can seriously affect the work and study of patients and in some serious cases can lead to suicide [3,4]. Depression suicide is the fourth leading cause of death in the 15 to 29-year age group, with more than 700 000 suicides per year [5].
At present, there is a great lack of psychiatrists in the world, and the insufficient proportion of doctors and patients has become a major problem in mental health diagnosis and treatment. Meanwhile, the etiology of depression is not clear, and there is a lack of objective diagnostic physiological indicators. The existing depression diagnosis methods in clinical applications are mainly based on a subjective scale [6]. The accuracy of the test results is affected by the proficiency of the doctors and the coordination of patients, so the misdiagnosis rate is still high. Therefore, it is necessary to find objective parameters to improve the accuracy of depression diagnosis. In recent years, many researchers have tried to use physiological signals, facial visual characteristics, biochemical indicators, and other indicators to find objective diagnostic indicators of depression. However, the process of wearing measuring equipment such as a heart rate monitor and electroencephalogram is complex, and the information collection process requires a high level of cooperation from patients, which increases the difficulty of clinical detection [7]. To address this issue, the diagnostic methods of depression based on facial visual features have gradually emerged. This type of method objectively evaluates the degree of depression by analyzing the depression-related information on patients’ faces and further summarizes the characteristics of patients with depression to guide the clinical diagnosis of doctors. Also, this method only needs a camera for data acquisition. The low cost makes the method easy to implement. Especially, in the process of information collection, patients do not need to contact the equipment and tend to show a real mental state; therefore, the method has a high research value and space for development [8].
In recent years, deep learning has been rapidly developing, which has attracted the attention of an increasing number of researchers [9]. As a branch of machine learning, deep learning is an algorithm based on an artificial neural network for data representation learning. It has obvious advantages over shallow models in feature extraction and model fitting, and it is good at mining abstract distributed feature representations with good generalization ability from the original input data [10,11]. With deep learning, some of the problems that were thought difficult in the past can be solved [12].
With the significant increase in the number of training datasets and the rapid increase in chip processing capabilities, deep learning has achieved remarkable results in the fields of target detection, computer vision, and natural language processing, thus promoting the development of artificial intelligence [13]. The advantage of deep learning is the use of unsupervised or semi-supervised feature learning and hierarchical feature extraction algorithms to replace manual feature acquisition. Deep learning is a hierarchical machine learning method containing multi-level nonlinear transformations. Deep neural networks are the main form of deep learning at present, and the connection mode between neurons is inspired by animal visual cortex tissues [14,15]. The convolutional neural network (CNN) is one classical and widely used network structure. CNNs are composed of one or more convolutional layers, fully connected layers (corresponding to classical neural networks), as well as association weights and pooling layers. This structure enables the CNN to use 2-dimensional (2D) data as input. Compared with other deep learning structures, CNNs can obtain better results in images [16,17]. This model can be trained using backpropagation algorithms. Compared with other deep, feedforward neural networks, CNNs require fewer parameters to be estimated, making them an attractive deep learning architecture [18].
Depression is one of the most common but serious mental diseases in the world. This serious disease could cause patients to have negative and pessimistic thoughts, self-blame, and self-harm. Also, the patients lacking self-confidence can germinate the idea of despair, and they believe that “ending life is a relief” and “living in the world is superfluous”. In this case, the patients will make suicide attempts or conduct suicidal behaviors. Although depression can be severe, it can be cured with medication, psychotherapy, and other clinical treatments. Currently, the diagnosis of depression is based on self-report and questionnaire surveys of patients in clinical interviews, such as the Self-Rating Depression Scale and Beck Depression Scale. However, these diagnosis methods use subjective ratings. Therefore, as an alternative, it is crucial to diagnose depression through human face identification with the existing machine science technology [19,20].
Behavior-based depression recognition is becoming increasingly popular, and the identified behaviors include speech, facial expressions, gestures, and eye movements. Research on depression based on facial expression mainly uses images and facial feature points. Meanwhile, the local binary pattern, local binary pattern from three orthogonal planes (TOP), local Gabor binary pattern TOP, local curvelet binary pattern, and local phase quantization from TOP are extracted to describe the texture changes of facial regions. However, the above methods are based on a large number of manual feature descriptors designed with professional knowledge. CNNs are now mainly used in diagnosing some genetic diseases with obvious facial features, such as Nunan syndrome, Alzheimer disease, and Turner syndrome [21,22]. Neural networks are also used in diseases, but there are not many possible uses to identify depression. In this study, we expected to rapidly and accurately determine whether the participants in ordinary life have depression with emotional fluctuations. Therefore, this study used the patient’s resting face to train the model instead of using the traditional facial recognition approach during controlled emotional stimuli and controlled tasks.
The purpose of this study was to use facial recognition technology, especially deep CNN, to automatically identify patients with depression. A depression recognition model was constructed by testing 102 patients with depression and 1100 healthy participants who had been clinically diagnosed with depression. With this model, a potential patient with depression could be detected in a timely manner and treated actively, thus reducing the harm caused by the disease. In this paper, we describe the proposed method, including the recognition results based on facial features of depressive patients, which are illustrated in the extracted feature maps. Also, depression patient identification, image preprocessing, datasets, principles, training details, and model assessment are presented. We then give the results, summarizing the performance evaluation, giving results of verification experiments, and compare our method with other latest methods. Finally, we provide discussions and conclusions and the opportunities for future work.
Material and Methods
DATASET ACQUISITION:
All the collected data were from the Department of Neurology, Affiliated Hospital of Shandong University of Traditional Chinese Medicine. All patients voluntarily participated in this study. Facial photos were taken in a standard clinic approach with an MI PAD3 (Xiaomi, Beijing, China) [23] as follows: (1) Participants sat in front of the white background and took off their hats and glasses and tied up long hair to expose ears; (2) The participants’ facial expressions were relaxed, and their eyes looked straight ahead. In addition, the information of each participant was collected, including age, occupation, education level, and whether treatment had been performed before.
DEPRESSION DATA SET:
The data on patients with depression were collected from the Department of Neurology, Affiliated Hospital of Shandong University of Traditional Chinese Medicine from October 2021 to May 2022. A total of 102 patients with depression who volunteered to participate were included, and 10 pictures were collected from each patient.
The inclusion criteria of patients with depression were as follows: (1) diagnostic criteria of depression according to the Diagnostic and Statistical Manual of Mental Disorders-5 standard developed by the American Psychiatric Association [24]; (2) volunteers with depression were scored by the Hamilton Depression Scale, with scores ranging from 17 to 30 points; (3) the age of patients was 15 to 70 years old; (4) patients with depression were first diagnosed in our department (without treatment); (5) the types of depression included destructive mood disorder, severe depression (including severe depressive episodes), persistent depression (bad mood), and premenstrual dysphoria; and (6) postpartum depression and menopause depression.
The exclusion criteria were as follows: (1) those who do not meet the inclusion criteria; (2) patients with severe primary diseases such as cardiovascular, brain, liver, and kidney, or mental diseases, and those who could not cooperate with information collection; (3) patients with other mental diseases, such as mania and schizophrenia; (4) patients with nervous system trauma or history; and (5) patients with depression caused by substances/drugs, depression caused by other diseases, and other specific forms of depression.
HEALTHY PARTICIPANT DATASET:
Data of 1132 healthy participants were collected by the Neurology Department of Shandong University of Traditional Chinese Medicine. This study selected 1100 facial images according to the following: (1) the participant’s age was 15 to 70 years old, and (2) there were no serious primary diseases, such as cardiovascular, brain, liver, and kidney diseases, and no mental illness.
DATASET PROCESSING:
The purpose of data preprocessing was to clean up and cut images. Since the data were collected from clinical work, they needed to be preprocessed before they could be used to train the deep learning model. In the dataset, the face was cut from the original image to ensure that the face was in the middle of the image and occupied 70% to 90% of the area of each image. Then, the dataset was divided into a training set, test set, and validation set at the ratio of 7: 2: 1. For scaling, the normalization method was applied, and the pixel values of all images were resized from (0, 255) to (0, 1).
FACIAL TREATMENT OF HEALTHY PARTICIPANTS:
The data of 1132 healthy volunteers were included from the Neurology Department of Shandong University of Traditional Chinese Medicine. When the photos were taken, the eyebrows and ears were exposed. A total of 1132 pictures were obtained, and 1100 pictures were selected and used in this study. The samples were divided into a training set, test set, and verification set with 770 samples, 220 samples, and 110 samples, respectively.
FACIAL TREATMENT OF PATIENTS WITH DEPRESSION:
The data of 102 patients with depression were collected by the Department of Neurology, Affiliated Hospital of Shandong University of Traditional Chinese Medicine. When taking photos, the eyebrows and ears were exposed. For each patient, 10 images were taken, and a total of 1020 images were obtained. The samples were divided into a training set, test set, and verification set with 714 samples, 204 samples, and 102 samples, respectively.
MODEL ESTABLISHMENT:
CNN models have been developed to assist in our daily life. For example, some medical applications are based on a branch of artificial intelligence, known as “computer vision”. Therefore, CNN algorithms are helpful for disease detection and behavior and psychological analysis. The tools used in this study included PyCharm (
Five deep CNN models were constructed for depression identification: the fully connected convolutional neural network (FCN); visual geometry group 11 (VGG11); visual geometry group 19 (VGG19); deep residual network 50 (ResNet50), and Inception version 3 (V3). The FCN model was integrated with the current advanced attention mechanism, and the model included a feature input layer, convolution layer, activation layer, and full connection layer. VGGNet is a deep CNN architecture developed by the Visual Geometry Group (VGG) of Oxford University. VGG-11 consists of 8 convolution layers and 3 fully connected layers. VGG-19 consists of 16 convolution layers and 3 fully connected layers. ResNet50 is a residual network composed of residual blocks, and each block is a stack of convolution layers [25]. In addition to the direct connection of the convolution layer, ResNet has a fast connection path between the input of the residual block and its output, and ResNet50 contains 49 convolution layers and a full connection layer. Inception-V3 uses a method that decomposes large convolution into small convolution and normal convolution into asymmetric convolution to increase the recognition accuracy [24]. The parameter is the total weight of the network, which determines the spatial complexity of the network.
PyTorch in the Anaconda software was used, and the collected datasets of patients with depression and healthy participants were imported and divided into a training set, test set, and validation set at the ratio of 7: 2: 1. Then, this study used the CNN to construct a complete connection layer, which was integrated with the current advanced attention mechanism, and the model was called FCN (Figure 1, PowerPoint 2016 Microsoft). The FCN model had 11 layers: (1) convolutional layer (7,7,64); (2) convolutional layer (3,3,64)×2; (3) convolutional layer (3,3,64)×2; (4) convolutional layer (3,3,128)×2; (5) convolutional layer (3,3,128)×2; (6) convolutional layer (3,3,256)×2; (7) convolutional layer (3,3,256)×2; (8) convolutional block attention module; (9) convolutional layer (3,3,512)×2; (10) convolutional layer (3,3,512)×2; and (11) fully connected layer (512,2). Then, the constructed FCN model was used to test (since the validation set was also used to test the training model, it was not reflected in the flowchart separately).The Softmax function was used for binary classification. The batch size was set to 16, and the learning rate was set to 10e-3. The training process was run for 30 epochs.
The VGGG11 model (
The VGGG19 model (
The ResNet50 model (
The Inception-V3 model (
VERIFICATION OF THE MODELS:
To evaluate the classification performance of the models, some evaluation indexes were introduced, including the receiver operating characteristic (ROC), loss function, accuracy, precision, recall, and F1 score. Depression was classified as a positive class, and non-depression was classified as a negative class. According to whether the classifier’s prediction on the test dataset was correct or not, the total number of 4 situations was denoted as follows.
True positive (TP) indicated the number of depressive samples that were predicted as depressive; false negative (FN) indicated the number of depressive samples that were predicted as non-depressive; false positive (FP) indicated the number of non-depressive samples that were predicted as depressive; and true negative (TN) indicated the number of non-depressive samples that were predicted as non-depressive. True and false represented correct and wrong classification, while positive and negative represented depressive and non-depressive samples.
ROC CURVE:
The ROC curve, also known as the sensitivity curve, is a coordinate diagram composed of the horizontal axis of the false alarm probability and the vertical axis of the hit probability. The curve was drawn according to the results obtained under specific stimulus conditions and different judgment criteria [12].
According to the prediction score of the classifier in machine learning, the samples were sorted. Then, the false positive rate (FPR) and true positive rate (TPR) were calculated as:
The curve was drawn by matplotlib, and the ROC curve was obtained by the FPR and TPR.
LOSS FUNCTION:
Loss function, or cost function, is a function that maps the values of a random event or its related random variables to nonnegative real numbers to represent the “risk” or “loss” of the random event [16]. In real applications, the loss function is usually associated with optimization problems, such as a learning criterion, namely solving and evaluating models by minimizing the loss function [26]. Parameter estimation is often used in statistics and machine learning.
In machine learning and deep learning, the loss function is used to estimate the deviation between the predicted value and the real value of the model in the training process. The smaller the loss function, the closer the predicted value is to the real value, and the better is the generalization performance of the model.
In this study, the Softmax loss was used to calculate loss, and the loss function was composed of Softmax and cross-entropy loss [27].
ACCURACY:
Accuracy is one of the indicators used to evaluate the performance of the classifier, which is calculated as the ratio of the number of samples correctly classified by the classifier to the total number of samples for a given test dataset.
The accuracy was calculated as the number of correct predictions to the total number of samples.
Precision refers to the proportion of true depression samples in the samples predicted as depression by the classifier, that is, how many of the samples judged as depression by the classifier were true depression samples. The calculation formula was as follows:
Recall (recall rate) was the proportion of correctly classified positive samples to true positive samples. The number of positive samples correctly classified were the true cases (TP). The number of true positive samples included real cases (TP) and FN cases.
The F1 score is the harmonic mean of precision rate and recall rate.
Results
ROC CURVES:
The ROC curves of FCN, VGG11, VGG19, ResNet50, and Inception-V3 are shown in Figure 2A–2E, respectively (Python3.9, Python Software Foundation). It can be seen that the overall effect was better, and FNC showed obvious superiority.
LOSS FUNCTION:
The loss curves of FCN, VGG11, VGG19, ResNet50, and Inception-V3 networks are shown in Figure 3A–3E (Python3.9, Python Software Foundation). It was found that the VGG11, ResNet50, and Inception-V3 models had serious oscillation, and good results were achieved in speed and accuracy. Meanwhile, the loss function curves of VGG11 and FCN models decreased rapidly, and the model oscillation was small. The training and testing loss function curves of the FCN model were closest; therefore, FCN was determined to be a good facial recognition network.
ACCURACY:
The accuracy curves of FCN, VGG11, VGG19, ResNet50, and Inception-V3 are respectively shown in Figure 4A–4E (Python3.9, Python Software Foundation). The accuracy of the 3 networks was improved after 30 epochs. The accuracy of VGG11, ResNet50 and Inception-V3 models fluctuated severely. FCN and VGG19 models had good accuracy. Although the curve of the VGG model was not relatively flat, the accuracy of the FCN model was significantly increased.
PRECISION, RECALL, AND F1 SCORES:
Precision is the ratio of the number of correct samples in the identification or retrieval results to the total number of samples. The higher the value, the higher the accuracy and the better the system performance. The recall ratio refers to the ratio of the relevant information detected from the database to the total amount of information. Sometimes, we needed to combine precision and recall. F1 score is such an evaluation index, and it is one of the most commonly used indicators in classification and information retrieval. To test the model, the above 3 indexes, precision, recall, and F1 scores, were used to evaluate model performance. It can be seen that the FCN model achieved good results in precision, recall, and F1. The VGG19 model had good accuracy and precision. In the recall rate and F1, the Inception-V3 model was inferior to the FCN model. All evaluation results are presented in Table 1.
Discussion
This study explored the importance of facial features in the diagnosis of depression and extended the application of facial recognition technology in medicine. Although the facial features of depression are vague and the results in the literature are not consistent, the facial expressions of patients with depression often have the characteristics of sadness, depression, reduced smile, and ease to cry. The main facial features include the mouth angle hanging downward, the formation of the so-called ‘Ω’, tight eyebrows, binocular dullness, reduced blinking, eyes condensed with tears, shoulders drooping, bent waist drooping, less action, sitting for a long time, and posture unchanged [18–20]. Guo et al discussed the facial emotion recognition accuracy of patients with depression and found that compared with the healthy control group, depressed patients are unlikely to present happy, disgusted, and neutral facial expressions. Joormann and Gotlib found that sad expressions are easily observed in participants with depression syndrome. This finding is consistent with some other analysis results of depression [28]. Studies show that participants with depression may more accurately perceive and remember their previous negative images. This may be one of the reasons for the depression syndrome [29,30]. Also, the participants had facial imitations, such as mouth angle hanging downward and tight eyebrows. Guo et al proposed a new method for potential depression risk identification based on a deep belief network model. The recognition performance of the combined 2D and 3D feature model was better than that of the 2D or 3D feature models [31]. Therefore, this further suggests using a 3D face model to explore the rapid and accurate diagnosis of depression.
With the continuous improvement of machine learning, the application of artificial intelligence, such as backpropagation neural network and CNN models, has made great progress in facial recognition. Owing to the introduction of AlexNet, people’s interest in CNN has begun to grow since 2012. CNN is widely used in image segmentation, image classification, and other fields, and it is also the most commonly used deep learning method in facial recognition. The main advantage of the deep learning method is that it can use a large amount of data for training to learn robust face representation from the training data [31,32]. Also, the deep learning method is good at dealing with different types of data, such as 1D signal data and time series, 2D image or audio signal data, and 3D video data. Also, CNNs can run on any device, which also makes them attractive. Moreover, CNNs can perform parameter sharing and use special convolution and pooling operations to achieve high accuracy [22,33].
This study shows that the accuracy and precision of this method for detecting depression were above 99%. There are several reasons for this good result. First, facial features in patients with depression are easy to observe clinically [34]. The data of patients with depression were collected by the Affiliated Hospital of Shandong University of Traditional Chinese Medicine. Also, frame extraction was performed, which may lead to better robustness of the model. The CNN model performs operations on human facial expression images collected from various channels. Meanwhile, Opencv was used to capture human facial expressions so that more accurate human facial expressions could be obtained for more sensitive recognition [26–30,32–39]. Based on this, the reliability of the information of the entire face recognition system and the stability of the system was greatly improved. The deep learning models have been constantly updated in recent years, so the diagnosis of depression diseases through facial recognition is no longer impractical [40–42].
The attention mechanism in neural networks is a resource allocation scheme that allocates computing resources to more important tasks and solves the problem of information overload in the case of limited computing power. In neural network learning, generally, the more parameters in the model, the stronger the expression ability of the model, and the greater the amount of information stored in the model, but this will bring the problem of information overload [43]. Then, by introducing the attention mechanism, the network can focus more on the critical information in the input, reduce the attention to other information, and even filter out irrelevant information, thus solving the problem of information overload and improving the efficiency and accuracy of task processing. The present study added algorithms of attention mechanisms to improve model accuracy [44].
CNN is not good at long-distance analysis of images; therefore, in this study, we chose the algorithm of attention mechanism to effectively perform long-distance analysis. In the next step, we hope to find more suitable algorithms in the process of continuous attempts and apply them to depression recognition.
The face includes the most nerves and the most developed small muscles in the body. It carries the expressions of joy, anger, worry, thought, sadness, fear, and surprise. A theory about the causes of depression suggests that depression is associated with a similar hyperactive neuroendocrine response to stress in the hypothalamic-pituitary-adrenal (HPA) axis [45]. The activity of the HPA axis is controlled by the secretion of corticotropin-releasing hormone by the hypothalamus. The corticotropin-releasing hormone activates the pituitary secretion of adrenocorticotropic hormone. In turn, adrenocorticotropic hormone stimulates the adrenal secretion of glucocorticoids (human cortisol). Relevant evidence suggests that there is a link between stress, depression, and the HPA axis. First of all, the main symptoms of depression are irritability and lack of happiness [46]. It is a chemical reaction to bad events. Things are chronic when there is pressure. This pressure activates the HPA axis, resulting in a large release of glucocorticoids into the blood and then leading to excessive activity of the HPA axis. Antidepressants will directly reduce the activity of the HPA axis. Cooper et al used arterial spin labeling to measure cerebral blood flow to discover the changes in cerebral blood flow in patients with depression. Their analysis showed the characteristics of the right parahippocampal, thalamus, and fusiform gyrus in patients with depression [23,25].
Conclusions
This paper presents a CNN-based diagnostic method for depression. The method was tested in terms of accuracy, precision, recall, and F1. The experimental results showed that the accuracy and precision of this method for detecting depression were above 90%, indicating that it is feasible to identify depression automatically from facial images. The proposed method can be applied to early disease diagnosis and prevention of disease progression. In future studies, we will study various depressions that affect facial features. Also, we will use biomolecular diagnosis to assist clinical diagnosis to open up a new way in the field of precision medicine.
Figures
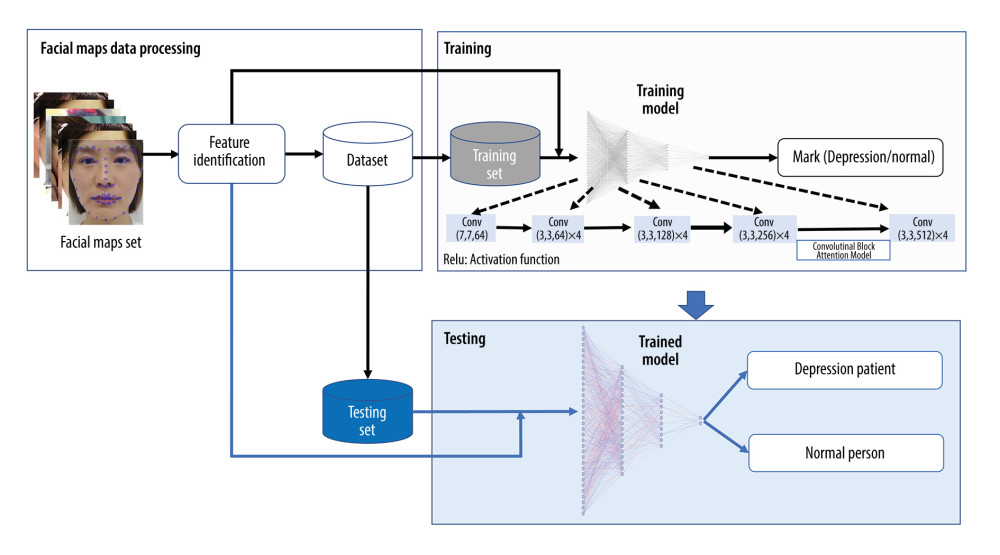 Figure 1. The collected datasets of patients with depression and healthy participants were divided into a training set, test set, and validation set at the ratio of 7: 2: 1. The study used the convolutional neural network to construct a complete connection layer, which was added to the current advanced attention mechanism model and named FCN. The FCN model had 11 layers (1) convolutional layer (7,7,64); (2) convolutional layer (3,3,64)×2; (3) convolutional layer (3,3,64)×2; (4) convolutional layer (3,3,128)×2; (5) convolutional layer (3,3,128)×2; (6) convolutional layer (3,3,256)×2; (7) convolutional layer (3,3,256)×2; (8) convolutional block attention module; (9) convolutional layer (3,3,512)×2; (10) convolutional layer (3,3,512)×2; and (11) fully connected Layer (512,2). (Because the validation set is also used to test the training model, the validation set was organized into the validation set and was not reflected in the flowchart separately.)
 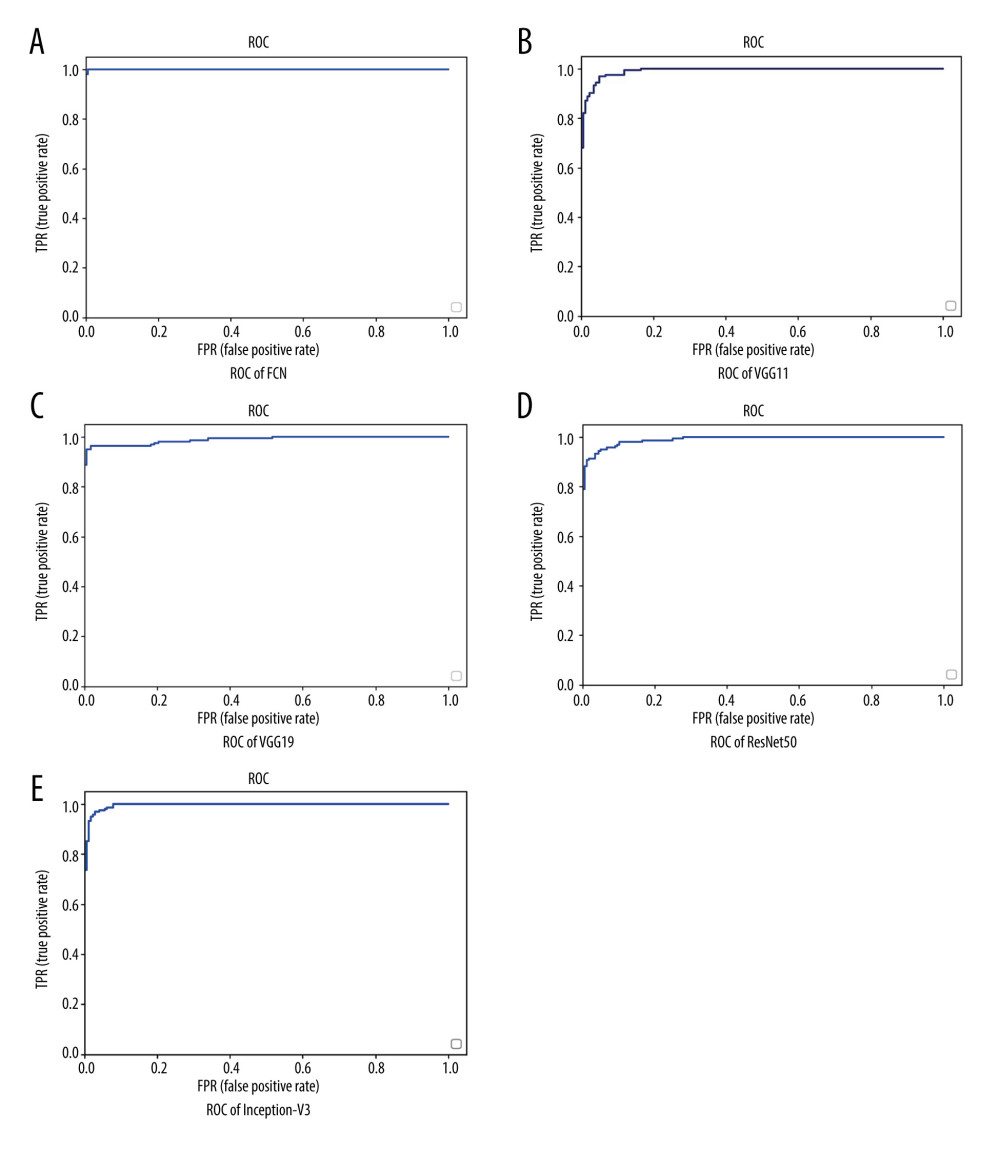 Figure 2. (A–E) Receiver operating characteristic curves of FCN, VGG11, VGG19, ResNet50, and Inception-V3. It can be seen that the overall effect was better, and FCN showed obvious superiority.
 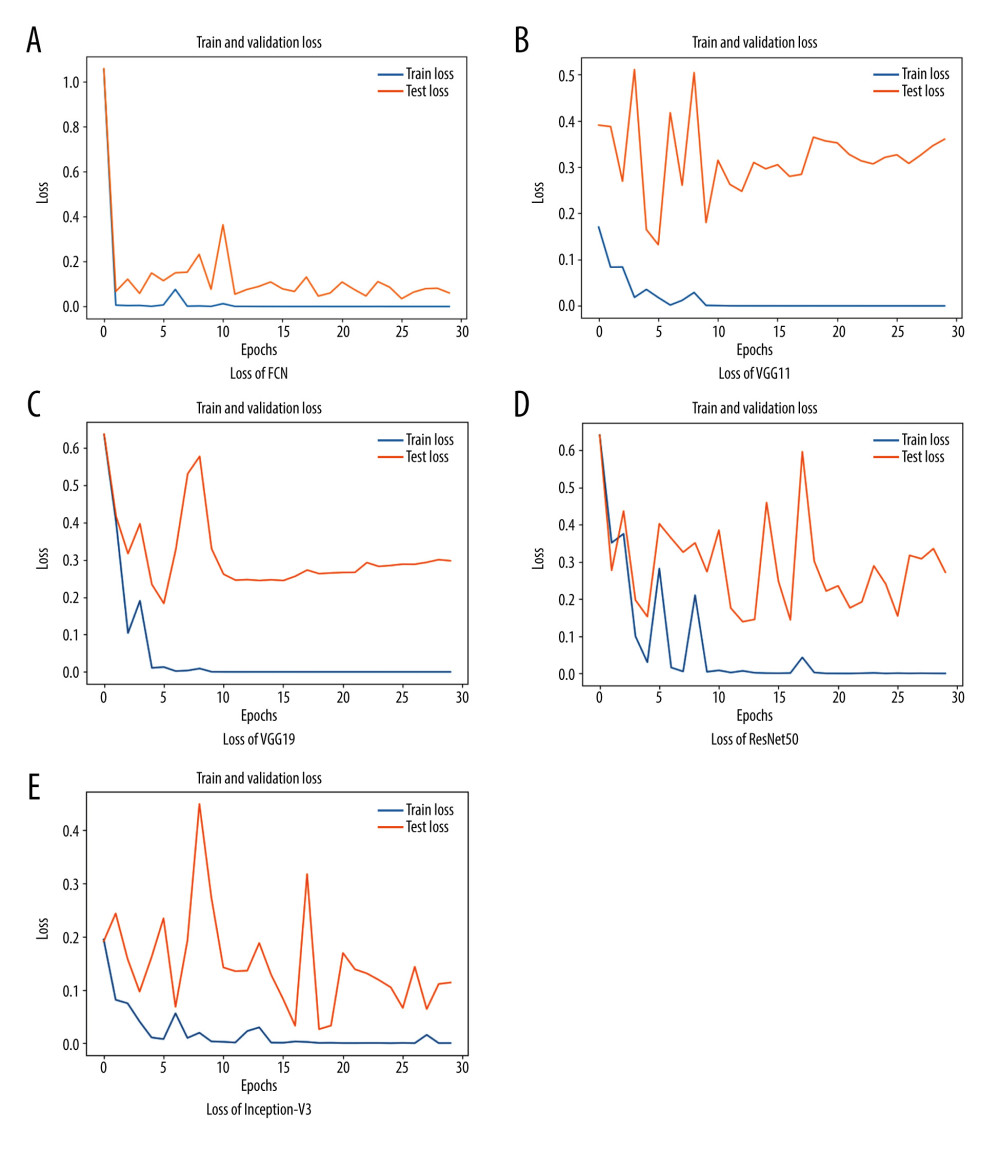 Figure 3. (A–E) Training loss vs validation loss of FCN, VGG11, VGG19, ResNet50, and Inception-V3. VGG11, ResNet50 network, and Inception-V3 models had serious oscillation and achieved good results in speed and accuracy. At the same time, the loss function curves of the VGG11 and FCN models decreased rapidly and the model oscillation was small.
 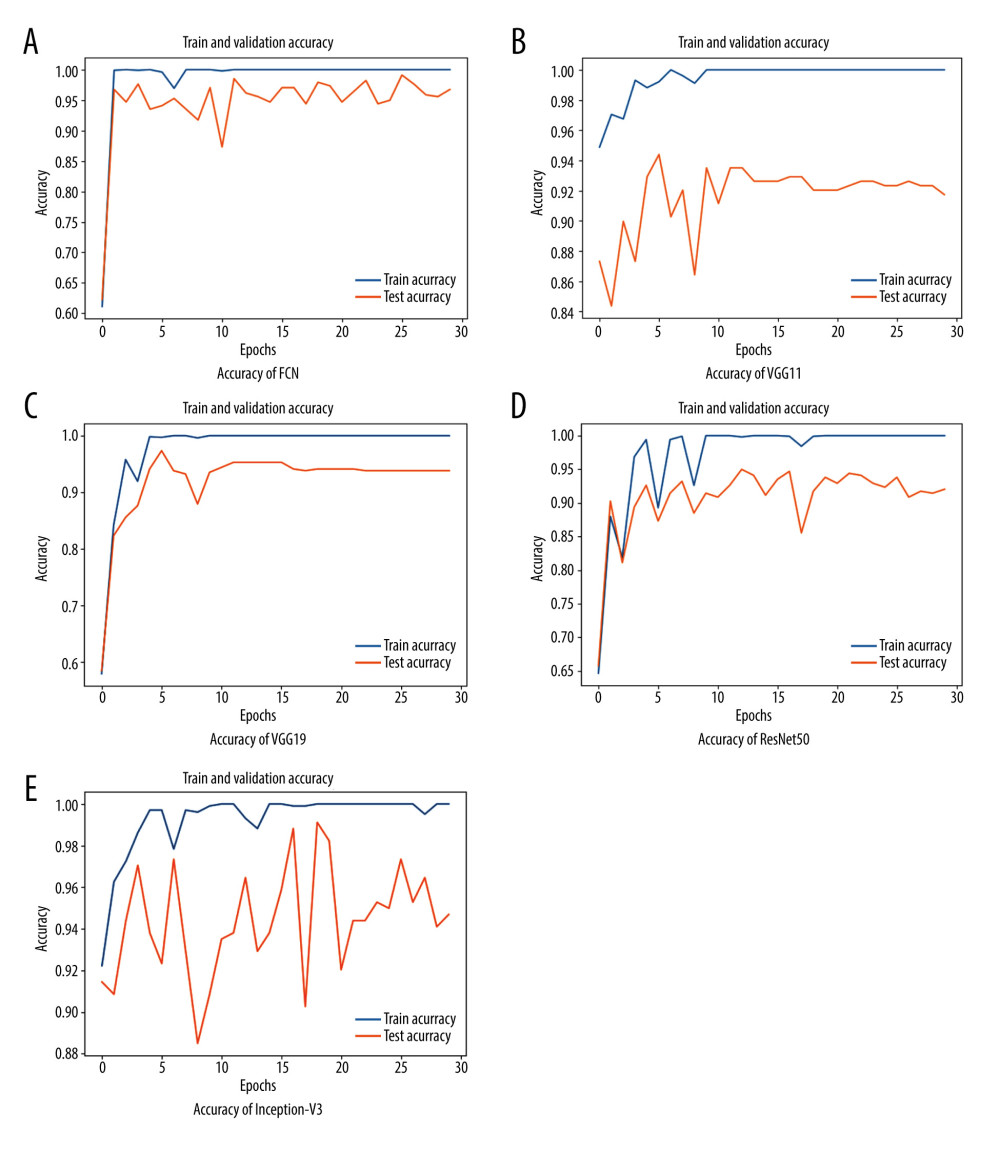 Figure 4. (A–E) Training accuracy vs validation accuracy of FCN, VGG11, VGG19, ResNet50, and Inception-V3. The accuracy of VGG11, ResNet50 network, and Inception-V3 models fluctuated greatly. FCN and VGG19 models had good accuracy. Although the curve of the VGG19 model was relatively flat, the accuracy of the FCN model was significantly improved.
 References
1. World Health Organization: The ICD-10 classification of mental and behavioural disorders: Clinical descriptions and diagnostic guidelines[M], 1992, World Health Organization
2. World Health Organization: Depression and other common mental disorders: Global health estimates[R], 2017, World Health Organization
3. Hickie AMIB, Davenport TA, Luscombe GM, The assessment of depression awareness and help-seeking behaviour: Experiences with the International Depression Literacy Survey: BMC Psychiatry, 2007; 7(1); 1-12
4. Axén I, Bodin L, The Nordic maintenance care program: The clinical use of identified indications for preventive care: Chiropr Man Therap, 2013; 21(1); 10
5. Friedrich MJ, Depression is the leading cause of disability around the world: JAMA, 2017; 317(15); 1517
6. Vázquez-Romero A, Gallardo-Antolín A, Automatic detection of depression in speech using ensemble convolutional neural networks: Entropy, 2020; 22(6); 688
7. Xing Y, Rao N, Miao M, Task-state heart rate variability parameter-based depression detection model and effect of therapy on the parameters: IEEE Access, 2019; 7; 105701-9
8. Koller-Schlaud K, Ströhle A, Bärwolf E, EEG frontal asymmetry and theta power in unipolar and bipolar depression: J Affect Disord, 2020; 276; 501-10
9. Deng L, Yu D, Foundations and trends in signal processing: DEEP LEARNING – methods and applications: Now Publishers, 2014
10. Dham S, Sharma A, Dhall A, Depression scale recognition from audio, visual and text analysis arXiv preprint 2017; 1709:05865
11. Evans-Lacko S, Aguilar-Gaxiola S, Al-Hamzawi A, Socio-economic variations in the mental health treatment gap for people with anxiety, mood, and substance use disorders: Results from the WHO World Mental Health (WMH) surveys: Psychol Med, 2018; 48(9); 1560-71
12. Peter F, Blockeel H: Decision support for data mining: An introduction to ROC analysis and its applications, 2003
13. Liu W, Wang Z, Liu X, A survey of deep neural network architectures and their applications: Neurocomputing, 2017; 234; 11-26
14. Ghorbanzadeh O, Blaschke T, Gholamnia K, Evaluation of different machine learning methods and deep-learning convolutional neural networks for landslide detection: Remote Sensing, 2019; 11(2); 196
15. Cardinal RN: Analysis of variance: Corsini Encyclopedia of Psychology, 2010
16. Jones WB, Thron WJ, Encyclopedia of mathematics and its applications: Math Comput, 2011; 39(159); 602
17. O’Shea K Nash R, An introduction to convolutional neural networks arXiv preprint arXiv 2015:151108458
18. Lee H, Grosse R, Ranganath R, Convolutional deep belief networks for scalable unsupervised learning of hierarchical representations; 609-16
19. Liu Z, Luo P, Wang X, Deep learning face attributes in the wild; 3730-38
20. Ljubic B, Roychoudhury S, Cao XH, Influence of medical domain knowledge on deep learning for Alzheimer’s disease prediction: Comput Methods Programs Biomed, 2020; 197; 105765
21. Pan Z, Shen Z, Zhu H, Clinical application of an automatic facial recognition system based on deep learning for diagnosis of Turner syndrome: Endocrine, 2021; 72(3); 865-73
22. Edition F, Diagnostic and statistical manual of mental disorders: Am Psychiatric Assoc, 2013; 21(21); 591-643
23. Madhavan S, Harris MA, Gusev Y, Systems medicine platform for personalized oncology: US Patent
24. American Psychiatric Association DSM-Task Force Arlington VA US, Diagnostic and statistical manual of mental disorders: DSM-5™: Codas, 2013; 25(2); 191
25. Gabriel A, Violato C, The development of a knowledge test of depression and its treatment for patients suffering from non-psychotic depression: A psychometric assessment: BMC Psychiatry, 2009; 9(1); 56
26. Somoza E, Soutullo-Esperon L, Mossman D, Evaluation and optimization of diagnostic tests using receiver operating characteristic analysis and information theory: Int J Biomed Comput, 1989; 24(3); 153-89
27. Pariante CM, Depression, stress and the adrenal axis: J Neuroendocrinol, 2003; 15(8); 811-12
28. Morency LP, Stratou G, DeVault D, SimSensei demonstration: A perceptive virtual human interviewer for healthcare applications: Proceedings of the AAAI Conference on Artificial Intelligence, 2015; 29(1); 4307-8
29. Nech A, Kemelmacher-Shlizerman I, Level playing field for million scale face recognition[C]; 7044-53
30. Smith K, Mental health: A world of depression: Nature, 2014; 515(7526); 181
31. Guo W, Yang H, Liu Z, Deep neural networks for depression recognition based on 2d and 3d facial expressions under emotional stimulus tasks: Front Neurosci, 2021; 15; 609760
32. Szegedy C, Vanhoucke V, Ioffe S, Rethinking the inception architecture for computer vision; 2818-26
33. Van Velzen LS, Kelly S, Isaev D, White matter disturbances in major depressive disorder: A coordinated analysis across 20 international cohorts in the ENIGMA MDD working group: Mol Psychiatry, 2020; 25(7); 1511-25
34. Wright SL, Langenecker SA, Deldin PJ, Gender specific disruptions in emotion processing in younger adults with depression: Depress Anxiety, 2009; 26(2); 182-89
35. Hamilton W, Ying Z, Leskovec J, Inductive representation learning on large graphs: Advances in Neural Information Processing Systems, 2017; 30
36. Pavlou A, Casey M, Identifying emotions using topographic conditioning maps[C]; 40-47, Berlin, Heidelberg, Springer
37. Scherer S, Stratou G, Lucas G, Automatic audiovisual behavior descriptors for psychological disorder analysis: Image Vision Comput, 2014; 32(10); 648-58
38. Schmidhuber J, Deep learning in neural networks: An overview: Neural Netw, 2015; 61; 85-117
39. Sharma N, Gedeon T, Objective measures, sensors and computational techniques for stress recognition and classification: A survey: Comput Methods Programs Biomed, 2012; 108(3); 1287-301
40. Yosinski J, Clune J, Nguyen A, Understanding neural networks through deep visualization arXiv preprint arXiv. 2015;150606579
41. Zhang T, Statistical behavior and consistency of classification methods based on convex risk minimization: Ann Stat, 2004; 32(1); 56-85
42. Zhang X, Zhao J, LeCun Y, Character-level convolutional networks for text classification: Advances in Neural Information Processing Systems, 2015; 28
43. Jia JR, Fang F, Luo H, Temporal structure and dynamic neural mechanism in visual attention: Sheng Li Xue Bao, 2019; 71(1); 1-10 [in Chinese]
44. Sha Y, Wang MD, Interpretable predictions of clinical outcomes with an attention-based recurrent neural network: ACM BCB, 2017; 2017; 233-40
45. Zou KH, O’Malley AJ, Mauri L, Receiver-operating characteristic analysis for evaluating diagnostic tests and predictive models: Circulation, 2007; 115(5); 654-57
46. So M, Yamaguchi S, Hashimoto S, Is computerised CBT really helpful for adult depression – A meta-analytic re-evaluation of CCBT for adult depression in terms of clinical implementation and methodological validity: BMC Psychiatry, 2013; 13(1); 113
Figures
Figure 1. The collected datasets of patients with depression and healthy participants were divided into a training set, test set, and validation set at the ratio of 7: 2: 1. The study used the convolutional neural network to construct a complete connection layer, which was added to the current advanced attention mechanism model and named FCN. The FCN model had 11 layers (1) convolutional layer (7,7,64); (2) convolutional layer (3,3,64)×2; (3) convolutional layer (3,3,64)×2; (4) convolutional layer (3,3,128)×2; (5) convolutional layer (3,3,128)×2; (6) convolutional layer (3,3,256)×2; (7) convolutional layer (3,3,256)×2; (8) convolutional block attention module; (9) convolutional layer (3,3,512)×2; (10) convolutional layer (3,3,512)×2; and (11) fully connected Layer (512,2). (Because the validation set is also used to test the training model, the validation set was organized into the validation set and was not reflected in the flowchart separately.)Figure 2. (A–E) Receiver operating characteristic curves of FCN, VGG11, VGG19, ResNet50, and Inception-V3. It can be seen that the overall effect was better, and FCN showed obvious superiority.Figure 3. (A–E) Training loss vs validation loss of FCN, VGG11, VGG19, ResNet50, and Inception-V3. VGG11, ResNet50 network, and Inception-V3 models had serious oscillation and achieved good results in speed and accuracy. At the same time, the loss function curves of the VGG11 and FCN models decreased rapidly and the model oscillation was small.Figure 4. (A–E) Training accuracy vs validation accuracy of FCN, VGG11, VGG19, ResNet50, and Inception-V3. The accuracy of VGG11, ResNet50 network, and Inception-V3 models fluctuated greatly. FCN and VGG19 models had good accuracy. Although the curve of the VGG19 model was relatively flat, the accuracy of the FCN model was significantly improved. Tables
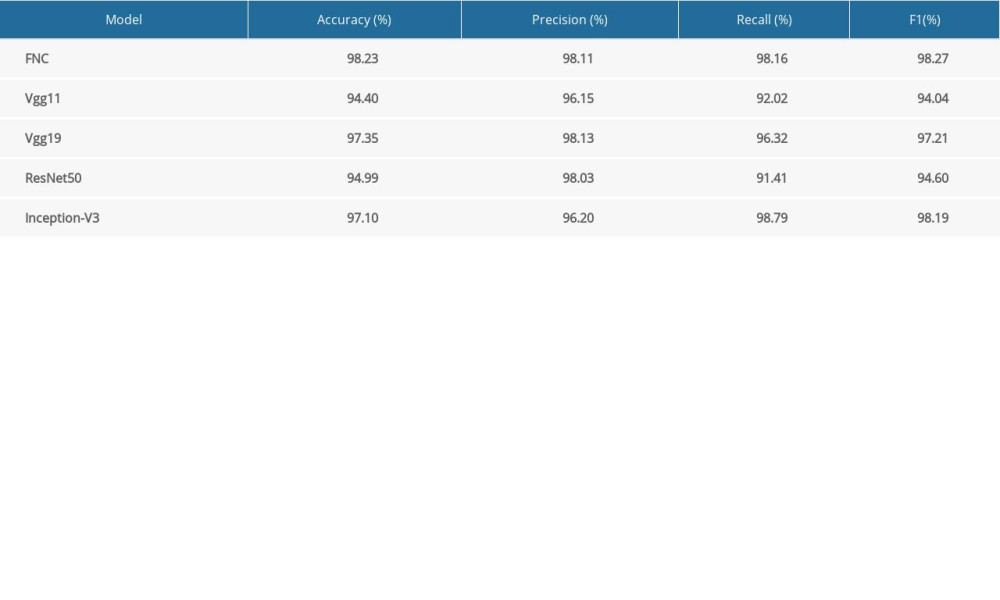 Table 1. Accuracy, precision, recall and F1 score of each model. FCN model achieved good results in Accuracy, precision, recall and F1. The VGG19 model had good accuracy and precision. The Inception-V3 model was behind the FCN model on recall and F1.Table 1. Accuracy, precision, recall and F1 score of each model. FCN model achieved good results in Accuracy, precision, recall and F1. The VGG19 model had good accuracy and precision. The Inception-V3 model was behind the FCN model on recall and F1.
 In Press
Clinical Research
Analysis of the Clinical Characteristics and Endoscopic Features of Phytobezoar-Induced Ulcers and Gastric ...Med Sci Monit In Press; DOI: 10.12659/MSM.952191
Clinical Research
Effect of Indirect Co-Culture With Gingival Mesenchymal Stem Cells on Cytokine Secretion in Primary Oral Sq...Med Sci Monit In Press; DOI: 10.12659/MSM.952439
Clinical Research
Comparison of Sleep Architecture in Individuals Aged 65 to 80 Years With and Without Mild Cognitive Impairm...Med Sci Monit In Press; DOI: 10.12659/MSM.952493
Clinical Research
Effects of Single-Bout Endurance Exercise Intensity on Peripheral Neurotrophic Factors in Patients With Isc...Med Sci Monit In Press; DOI: 10.12659/MSM.952089
Most Viewed Current Articles
17 Jan 2024 : Review article 14,176,514
Vaccination Guidelines for Pregnant Women: Addressing COVID-19 and the Omicron VariantDOI :10.12659/MSM.942799
Med Sci Monit 2024; 30:e942799
13 Nov 2021 : Clinical Research 3,760,677
Acceptance of COVID-19 Vaccination and Its Associated Factors Among Cancer Patients Attending the Oncology ...DOI :10.12659/MSM.932788
Med Sci Monit 2021; 27:e932788
14 Dec 2022 : Clinical Research 2,466,264
Prevalence and Variability of Allergen-Specific Immunoglobulin E in Patients with Elevated Tryptase LevelsDOI :10.12659/MSM.937990
Med Sci Monit 2022; 28:e937990
16 May 2023 : Clinical Research 708,906
Electrophysiological Testing for an Auditory Processing Disorder and Reading Performance in 54 School Stude...DOI :10.12659/MSM.940387
Med Sci Monit 2023; 29:e940387