09 August 2023: Clinical Research
Efficiency and Effectiveness of Patient Care Provided by Physicians in Rural and Urban Areas in Poland
Artur PrusaczykDOI: 10.12659/MSM.939169
Med Sci Monit 2023; 29:e939169


Abstract
BACKGROUND: The health sector in Poland is currently facing challenges such as limited financial resources, poor infrastructure, and insufficient human resources. To address these issues, increasing cost-effectiveness at the individual physician level has become essential. This study aimed to evaluate the efficiency and effectiveness of patient care at the level of individual primary health care physicians and to compare the performance of physicians working in urban and rural areas.
MATERIAL AND METHODS: Thirteen original effectiveness indicators were developed based on a literature review, expert consultations, and a pilot study at the Medical and Diagnostic Center in Siedlce. The indicators were used to evaluate the effectiveness of physicians and compare physicians’ characteristics working in rural and urban areas. The study extracted data on physicians’ characteristics and used the indicators to evaluate their effectiveness.
RESULTS: Physicians working in rural areas treated more patients due to staff shortages. However, physicians working in urban areas demonstrated greater effectiveness in performing routine and advanced health checks and mammograms. Despite this advantage, the average life expectancy of patients was higher among patients of physicians working in rural areas.
CONCLUSIONS: Five indicators developed in the study formed a scale, which is a step toward developing a uniform effectiveness indicator. Further research on consistently measuring effectiveness could significantly impact the development of sociometric research methodology. This study highlights the differences in efficiency and effectiveness of physicians working in rural vs urban areas and underscores the need for healthcare policymakers to consider these differences in addressing healthcare resource allocation.
Keywords: Patient Care, Primary Health Care, Quality Indicators, Health Care, Rural Health Services, Urban Health Services, Humans, Poland, Pilot Projects, Physicians, Rural Population
Background
Poland’s healthcare system faces significant challenges due to limited financial resources, poor infrastructure, and insufficient human resources. The system needs a solution that can increase effectiveness while minimizing costs. One approach that could address this challenge is to focus on the effectiveness of care at the level of individual physicians. As Bober and Olkiewicz have pointed out, the overall effectiveness of healthcare organizations is the sum of the effectiveness of individual diagnostic and therapeutic positions. Therefore, evaluating the effectiveness of individual physicians may help address the overall effectiveness of the healthcare system [1]. At the level of physicians, decisions about diagnosis and treatment are made, and interactions with patients occur, making it a suitable level for measuring effectiveness.
To measure physician effectiveness, it is essential to properly define effectiveness. According to Suchecka and Owczarek, the effectiveness of healthcare services is an attribute of the healthcare model measured based on the relationship between the product of the healthcare system (outcome) and the inputs required to produce that product (input) [2]. The service provider can be either a medical entity or an individual physician. Palmer and Togerson presented a more operational viewpoint of effectiveness, stating that it is the relationship between resource inputs (labor, capital, or equipment costs) and either intermediate or final health outcomes. Intermediate outputs are understood as factors such as the number of people treated or waiting times for treatment, while final results include the number of lives saved, years of life gained, and time free of disease symptoms [3]. This definition opens up considerable opportunities for the selection of effectiveness indicators.
For the purposes of this study, effectiveness was defined as the relationship between inputs and intermediate outcomes, as these can be attributed to specific physicians. In contrast, final outcomes tend to be attributed to the medical entity as a whole. To measure effectiveness, indicators were developed based on the Data Envelopment Analysis (DEA) efficacy frontier testing methodology. DEA is based on the Charnes, Cooper, and Rhodes assumption that the effectiveness score of any entity can be represented as the ratio of the weighted sum of effects to the weighted sum of inputs [4]. According to this definition, effectiveness is determined for a specific set of objects, referred to as DMUs (decision-making units). Therefore, the DEA method applies to individuals, allowing their individual effectiveness to be measured. The most effective object is selected based on linear programming and marked as the coefficient equal to 100%, whereas the other objects within the study set are assigned percentages corresponding to the degree to which they attain the effectiveness of the benchmark object. This object marks the effectiveness limit, which is also the limit of the set of production capacity of the group of facilities under analysis. Using this methodology, it is possible to determine the most effective objects in the study set without determining the functional relationship between the inputs and outputs. However, a drawback of the DEA method is its sensitivity to unusual parameters of objects considered effective [5].
The productivity indicator does not consider the cost of treatment or assess the legitimacy of the treatment. Therefore, a study of the indicators applied to measure effectiveness in healthcare has been carried out. The selection of indicators was based on the DEA efficacy frontier testing methodology, which provides a way to measure individual effectiveness. The DEA method applies to individuals, allowing their individual effectiveness to be measured. This study focused on evaluating the effectiveness of patient care at the level of individual primary healthcare (PHC) physicians, using original effectiveness indicators and comparing the effectiveness of physicians working in urban and rural areas.
In summary, measuring the effectiveness of individual physicians has the potential to increase the overall effectiveness of the healthcare system. Properly defining effectiveness, including the relationship between inputs and outcomes, is necessary to develop suitable indicators. DEA is the efficacy frontier testing methodology.
Material and Methods
ETHICS STATEMENT:
The study protocol was reviewed and approved by the Ethics Committee at the Medical University of Warsaw. Written informed consent was obtained from all participants.
RESEARCH METHODOLOGY:
The study consisted of a questionnaire survey and retrospective desk research. The effectiveness indicators were developed through a literature review, expert consultations, and a pilot study at the Medical and Diagnostic Center (MDC) in Siedlce, Poland [6]. The DEA methodology was used to construct the indicators, and each indicator was relativized to enable data comparison and modeling. Quality assessment was measured in 3 areas: structure, process, and effect, and medical personnel characteristics were used to build the indicators. The quality of the structure area was measured by hard and soft factors, which represent the resources of the medical facility. The quality of the process was both a technical and communicative dimension, and the quality of the outcome was measured by healthcare effectiveness indicators such as mortality, morbidity, complications, adverse effects, and patient satisfaction.
PATIENT POPULATION COVERAGE (Z.1):
The indicator calculates the annual average number of patient declarations of a given physician divided by the annual average number of total patient declarations filed at the medical center. A higher number of declarations suggests a higher patient market-realized satisfaction rate, indicating the quality of healthcare provided by the physician.
WORKTIME EFFECTIVENESS (Z.2):
The indicator value is calculated as the total value of the physician’s salary throughout the year divided by the total actual work time of the physician in the same year. This indicator aims to determine the financial worth/cost of 1 person-hour of physician, representing their effectiveness.
KEY VISITS EFFECTIVENESS (Z.3):
This indicator measures the effectiveness of the physician during key visits, including home and GD (chronic disease) follow-up visits. It is calculated as the value of remuneration due for these visits within the year, divided by the total actual work time of the physician during the same year. The weighting of different types of visits takes into account their diverse significance and difficulty. The value of remuneration reflects economic conditions and is considered an adequate way to capture the diversity of the visits.
COMPLEX VISITS EFFECTIVENESS (Z.4):
This indicator measures the effectiveness of a physician during complex visits (at GDK) (for chronic disease patients) and follow-up visits (GD). The indicator value is calculated by dividing the total value of remuneration due for these types of visits by the total actual work time of the physician in the same year. The weight of each type of service is determined based on its corresponding value of remuneration, which enables appropriate measurement of their significance and difficulty.
EFFECTIVENESS OF THE NUMBER OF COMPLEX VISITS (Z.5):
The indicator is determined by calculating the ratio of the total number of complex visits (at GDK) and follow-up visits (GD) made by the physician within a year to the total actual work time of the physician during the same period. This indicator allowed us to assess the impact of the number of visits made by the physician on their effectiveness on population healthcare, especially for chronically ill patients, regardless of the complexity or difficulty of the visits.
EFFECTIVENESS OF THE NUMBER OF ROUTINE AND ADVANCED HEALTH CHECKS (Z.6):
This indicator is calculated by dividing the total number of health checks carried out by the physician during the year by their total actual work time in the same year. This indicator is used to assess the physician’s performance in terms of the number of health checks they conducted.
CARE PLAN EXECUTION EFFECTIVENESS (Z.7):
The value of this was calculated by dividing the number of patients of the given physician actively following their care plan by the average number of patients of the given physician registered as chronically ill patients in that same year. This indicator is used to measure the effectiveness of the given physician in making patients actively follow the care plan. A high value of the indicator is expected to reflect a high degree of the physician’s communication skills, skills in team coordination, and positive influence on patients.
EFFECTIVENESS OF NUMBER OF DILO CARDS ISSUED (Z.8):
The indicator value is calculated as the number of DILO (cancer diagnostics and treatment) cards issued by a given physician within a year divided by the average number of the physician’s patients in the same year. This indicator aims to assess the effectiveness of the physician’s cancer screening practices. While a higher percentage of diagnosed early-stage cancer cases would be ideal, such data are unavailable, so the number of DILO cards issued is used as a proxy. Physicians who issue a higher number of DILO cards are likely to be more effective in detecting cancer early and thus have a positive impact on patient outcomes. In the future, it will be advisable to observe the length of survival of patients, time to recurrence of cancer diseases, and the total costs of treatment in relation to each year of life.
AVERAGE PATIENT LIFE EXPECTANCY (Z.9):
This indicator calculates the average age of patients who died within a given year under the care of a physician. It serves as an overall indicator of the physician’s effectiveness in providing care to patients. It is valuable if the measurements are made in a group of patients who have been under the care of a given medical team for at least 5 years.
AVERAGE CHRONIC PATIENT LIFE EXPECTANCY (Z.10):
The indicator calculates the average age of chronically ill patients who died within a given year under the care of a physician. It is valuable if the measurements are made in a group of patients who have been under the care of a given medical team for at least 5 years.
PERCENTAGE OF CERVICAL SCREENING TESTS (Z.11):
The indicator measures the percentage of a physician’s patients who received cervical screening tests during a given year, divided by the total number of patients under the physician’s care. It assumes that the percentage of patients requiring cervical screening tests should be similar across physicians, making it a valuable indicator of a physician’s effectiveness in referring patients for preventive tests.
PERCENTAGE OF MAMMOGRAMS (Z.12):
The indicator measures the percentage of a physician’s patients who received mammograms during a given year, divided by the total number of patients under the physician’s care. Like the cervical screening test indicator, it indicates a physician’s effectiveness in referring patients for preventive tests.
PERCENTAGE OF CVD SCREENING TESTS (Z.13):
This indicator measures the percentage of a physician’s patients who received cardiovascular disease screening tests during a given year, divided by the total number of patients under the physician’s care. It also serves as an indicator of a physician’s effectiveness in referring patients for preventive tests.
STUDY EXECUTION:
The study utilized unique data on individual physician performance collected by the MDC in Siedlce, Poland. The dataset included information on visits, diagnoses, labor costs, and other activities. The study population consisted of 29 primary care physicians employed at the Medical and Diagnostic Center in Siedlce who had been employed at the center for 1 year or more and had at least 100 patients assigned within the PHC system.
Calculations were performed for each indicator to determine the distribution of results obtained by the PHC physicians. The analysis was based on relativized indicator values, with each indicator represented as a range of values up to 100. The study examined measures of central tendency, dispersion, kurtosis, skewness, and the Shapiro-Wilk test of distribution normality. The distributions of the results of physicians from 2 groups – those working in urban and rural areas – were compared using parametric and non-parametric tests.
Tables and graphs were used to present the results. Box plots were developed to provide a transparent comparison of indicator values for physicians working in urban and rural areas. The blue graphs represent physicians working in rural areas, while the red graphs represent physicians working in urban areas. The rectangle’s area is limited by the first quartile at the bottom and the third quartile at the top. The horizontal line represents the median in the box, and the mean is represented by an X. Points outside of the rectangles represent outlier cases.
Results
PATIENT POPULATION COVERAGE:
For instance, the Z.1 indicator, Patient population coverage, had a significantly higher average value for physicians working in rural areas (Figure 1). Also, the Z.6 indicator, Effectiveness of routine and advanced health checks, had a significantly higher mean value for physicians working in urban areas (Figure 2).
Regarding the Z.2 indicator, Worktime effectiveness, physicians working in urban areas had a higher average value (Figure 1). However, most of the results were below the mean, indicating more extreme cases for urban areas. On the other hand, physicians in rural areas were more likely to demonstrate lower unit scores, resulting in higher scores than the mean.
PATIENT LIFE EXPECTANCY:
The Z.9 indicator, Patient life expectancy, showed significantly higher values for physicians working in rural areas, with a high positive kurtosis and left skewness for physicians working in urban areas. However, the Z.10 indicator, Average chronic patient life expectancy, showed no significant difference between urban and rural areas (Figure 3).
PERCENTAGE OF MAMMOGRAMS PERFORMED:
The Z.12 indicator – percentage of mammograms performed – had a significantly higher mean value for physicians working in urban areas, but both distributions were similar in shape (Figure 3). Table 4 presents the results of the statistical tests that were carried out to compare the indicator distributions for physicians working in urban and rural areas. In some cases, the tests demonstrated a statistically significant difference between the distribution of indicator values for physicians. Overall, the study results provide valuable insights into the effectiveness of primary care physicians in different areas and highlight areas that may require attention to improve their performance.
Discussion
LIMITATIONS:
This research was a pilot study and thus is limited to PHC physicians working at the Medical and Diagnostic Center in Siedlce. The sample size was small and restricted to 1 healthcare entity, although it includes physicians working in various locations. It allowed for an assessment of the reliability of the tools developed for the study but did not permit investigation of relationships between variables or the isolation of measurement scales for the effectiveness of patient care. Therefore, future research is planned with a larger sample of physicians from nationwide healthcare entities.
Conclusions
The analyses revealed that physicians working in urban and rural areas differ in terms of effectiveness only in certain aspects. Physicians in rural areas tend to treat more patients due to staff shortages. Accessibility to transport and availability of specialized equipment in urban areas, on the other hand, enable physicians to perform routine and advanced health checks and mammograms more effectively. Despite these advantages, the life expectancy of patients is higher among patients of physicians working in rural areas, possibly because non-medical lifestyle factors are crucial to maintaining health.
The methodology proposed in this article measures descriptive factors that have been overlooked thus far, including the input of a single physician, the cost of their work, and the generalized effects on patients. However, it does not determine the direction of the dependence of these factors, which could be the focus of future research.
Figures
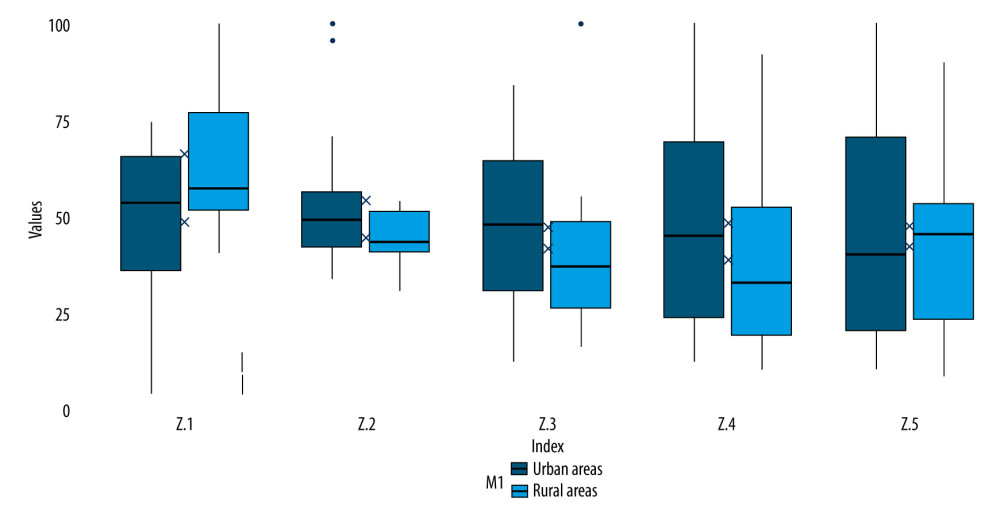 Figure 1. Distribution of indicator values: Z.1 Patient population coverage, Z.2. Worktime effectiveness, Z.3. Key visits effectiveness, Z.4. Complex visits effectiveness, Z.5. Effectiveness of the number of complex visits. The scores for Z.1 represent the percentage of patients for whom the physician was responsible for in the given area. The scores for Z.2–Z.5 represent percentage of renumeration or time spend on the indicated visit type. Source: R project for Statistical Computing, version 4.2.1, Ggplot 2.
 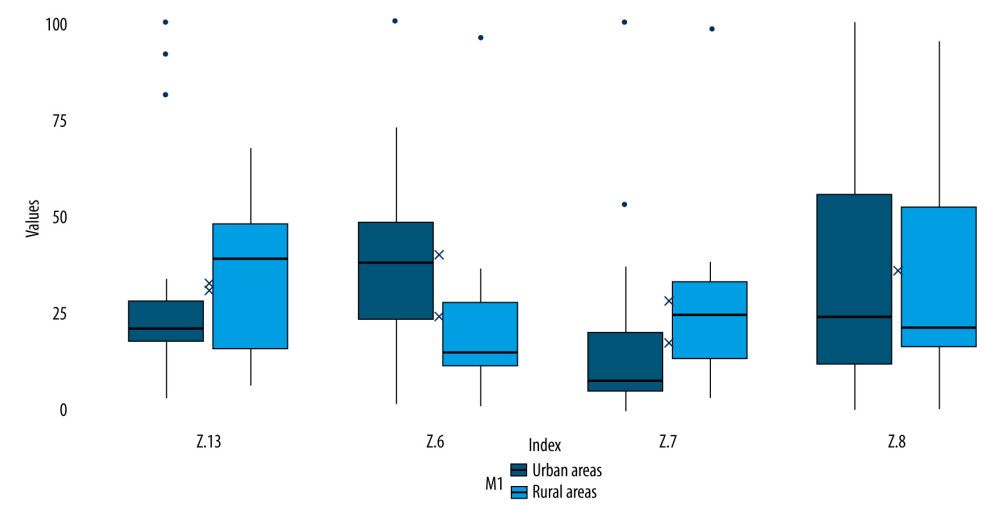 Figure 2. Distribution of indicator values: Z.6. Effectiveness of routine and advanced health checks, Z.7. Care plan execution effectiveness, Z.8. Effectiveness of the number of DILO cards issued, Z.13. Percentage of CVD tests. The scores represent the percentage of patients for whom the indicated test or action was carried out. Source: R project for Statistical Computing, version 4.2.1, Ggplot 2.
 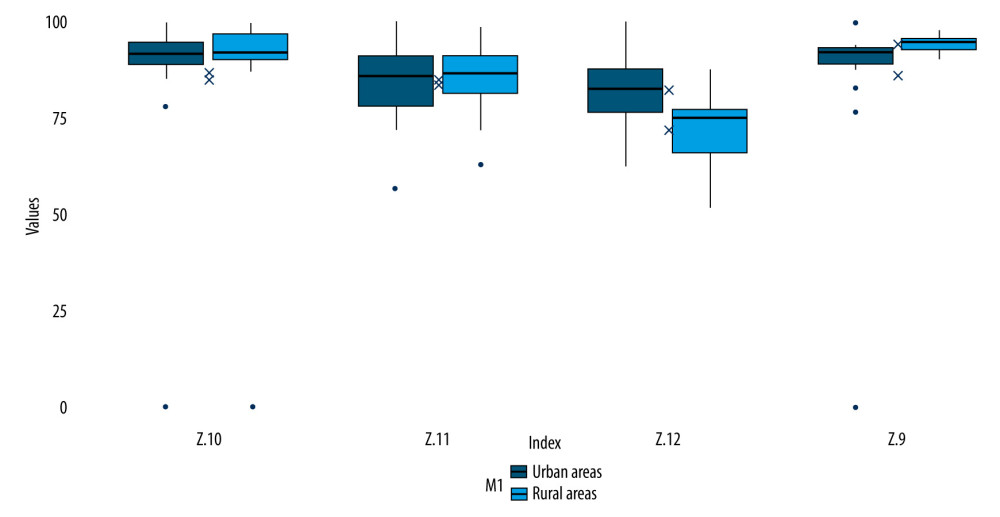 Figure 3. Distributions of indicator values: Z.9. Average patient life expectancy. Z.10. Average chronic patient life expectancy, Z.11. Percentage of cervical screening tests, Z.12. Percentage of mammograms. The scores represent the percentage of patients for whom the indicated test was carried out or whose life expectancy was reached. Source: R project for Statistical Computing, version 4.2.1, Ggplot 2.
 Tables
Table 1. Characteristics of individual indicators in the study sample. The table displays the value distribution of each indicator in the entire study sample, independent of statistical analysis parameters.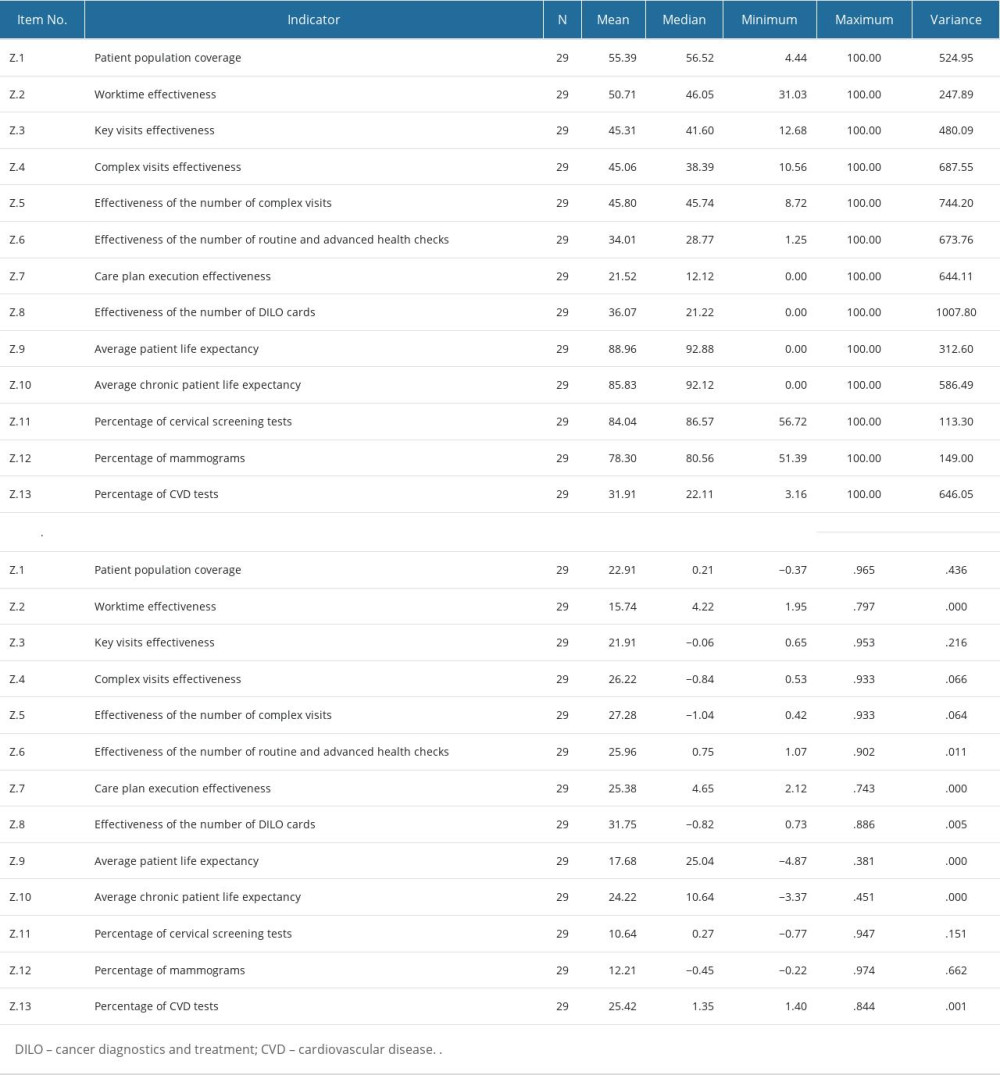 Table 2. Value distribution of indicators for physicians working in urban areas. The table displays the mean, median, and standard deviation for each indicator in urban areas, as well as the statistical significance of the difference in means between urban and rural areas.
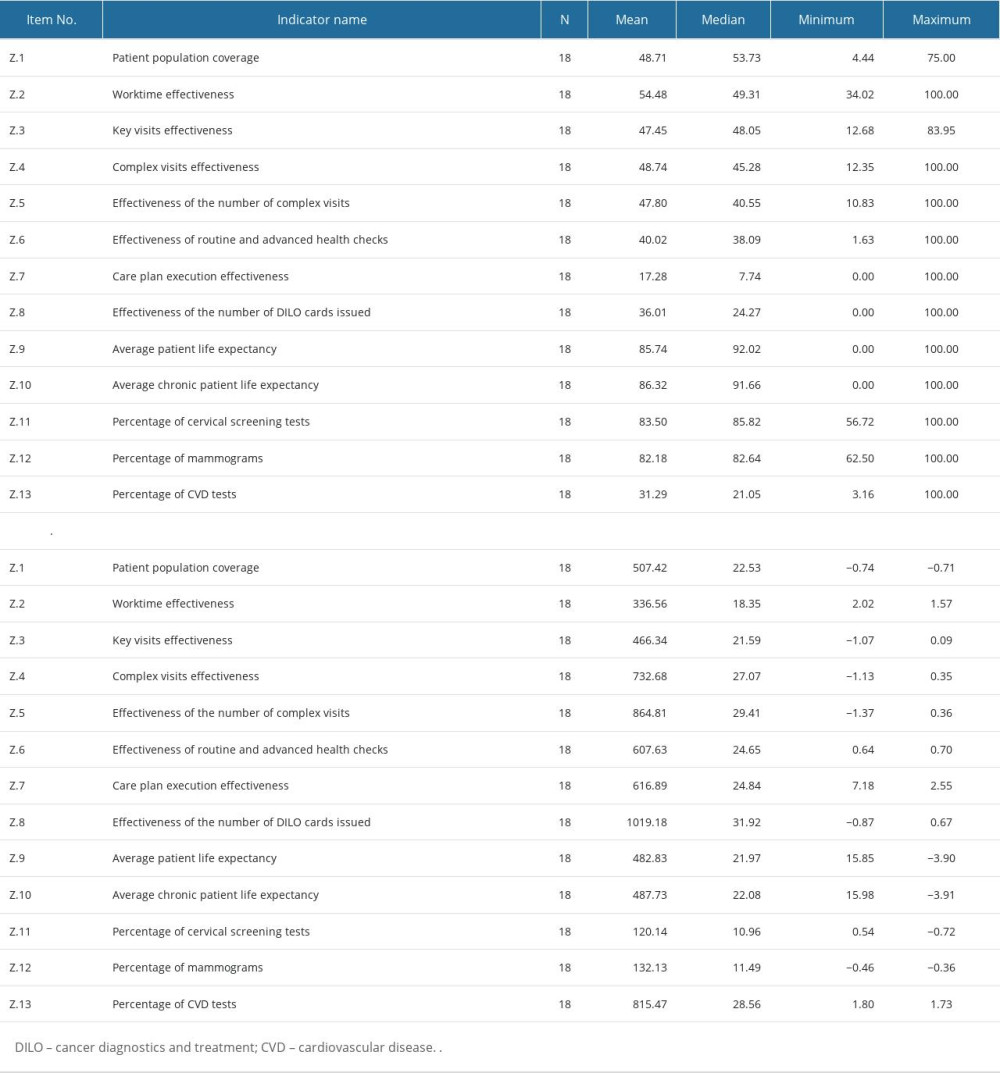 Table 3. Value distribution of indicators for physicians working in rural areas. The table displays the mean, median, and standard deviation for each indicator in rural areas, as well as the statistical significance of the difference in means between urban and rural areas.
 Table 4. Differences in the distributions of the individual indicator values for physicians who work in urban and in rural areas.
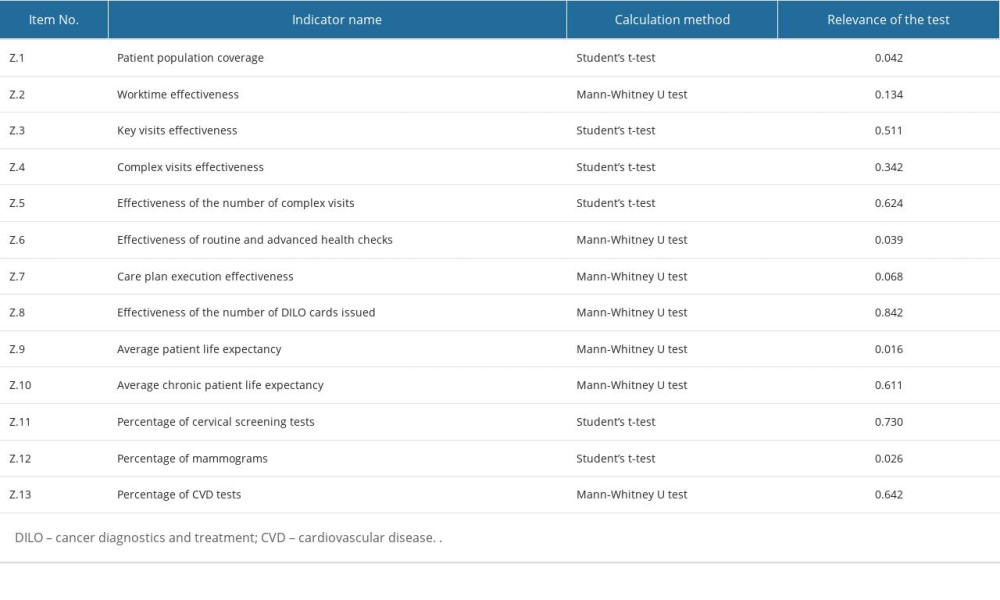
References
1. Bober B, Olkiewicz M, Qualitative factors of the efficiency of hospital services: Zeszyty Naukowe UPH seria Administracja i Zarządzanie, 2013; 25; 269-78
2. Suchecka J, Owczarek K, Measures of effectiveness of medical services in the American Health Care System. University of Warsaw, Faculty of Management: Problemy Zarzadzania, 2011; 9; 79-92
3. Palmer S, Torgerson DJ, Economics notes: Definitions of efficiency: BMJ, 1999; 318; 1136
4. Charnes A, Cooper W, Lewin AY, Data envelopment analysis theory, methodology and applications: J Oper Res Soc, 1997; 48; 332-33
5. Bartoszewicz A, Lelusz HConception and directions of using DEA method to measure the efficiency of local governments – selected aspects: Finanse, Rynki Finansowe, Ubezpieczenia, 2016; 80; 217-25 [in Polish]
6. Bogdan M, Prusaczyk A, Żuk P, Original efficiency indices in PHC patient care: Fam Med Prim Care Rev, 2021; 23; 290-94
7. Teisberg E, Wallace S, O’Hara S, Defining and implementing value-based health care: A strategic framework: Acad Med, 2020; 95; 682-85
8. Institute of Medicine (US) Committee on Quality of Health Care in America Crossing the Quality Chasm, 2001, Washington, DC, National Academies Press
9. Zhang L, Lewsey J, McAllister DA, Comparative effectiveness research considered methodological insights from simulation studies in physician’s prescribing preference: J Clin Epidemiol, 2022; 148; 74-80
10. Manzoor F, Wei L, Hussain A, Patient satisfaction with health care services:; An application of physician’s behavior as a moderator: Int J Environ Res Public Health, 2019; 16; 3318
11. Bandurska E, Damps-Konstańska I, Popowski P, Cost-effectiveness analysis of integrated care in management of advanced chronic obstructive pulmonary disease (COPD): Med Sci Monit, 2019; 25; 2879-85
12. Cutrona SL, Choudhry NK, Stedman M, Physician effectiveness in interventions to improve cardiovascular medication adherence: A systematic review: J Gen Intern Med, 2010; 25; 1090-96
Figures
Figure 1. Distribution of indicator values: Z.1 Patient population coverage, Z.2. Worktime effectiveness, Z.3. Key visits effectiveness, Z.4. Complex visits effectiveness, Z.5. Effectiveness of the number of complex visits. The scores for Z.1 represent the percentage of patients for whom the physician was responsible for in the given area. The scores for Z.2–Z.5 represent percentage of renumeration or time spend on the indicated visit type. Source: R project for Statistical Computing, version 4.2.1, Ggplot 2.Figure 2. Distribution of indicator values: Z.6. Effectiveness of routine and advanced health checks, Z.7. Care plan execution effectiveness, Z.8. Effectiveness of the number of DILO cards issued, Z.13. Percentage of CVD tests. The scores represent the percentage of patients for whom the indicated test or action was carried out. Source: R project for Statistical Computing, version 4.2.1, Ggplot 2.Figure 3. Distributions of indicator values: Z.9. Average patient life expectancy. Z.10. Average chronic patient life expectancy, Z.11. Percentage of cervical screening tests, Z.12. Percentage of mammograms. The scores represent the percentage of patients for whom the indicated test was carried out or whose life expectancy was reached. Source: R project for Statistical Computing, version 4.2.1, Ggplot 2. Tables
Table 1. Characteristics of individual indicators in the study sample. The table displays the value distribution of each indicator in the entire study sample, independent of statistical analysis parameters.Table 2. Value distribution of indicators for physicians working in urban areas. The table displays the mean, median, and standard deviation for each indicator in urban areas, as well as the statistical significance of the difference in means between urban and rural areas.Table 3. Value distribution of indicators for physicians working in rural areas. The table displays the mean, median, and standard deviation for each indicator in rural areas, as well as the statistical significance of the difference in means between urban and rural areas.Table 4. Differences in the distributions of the individual indicator values for physicians who work in urban and in rural areas.Table 1. Characteristics of individual indicators in the study sample. The table displays the value distribution of each indicator in the entire study sample, independent of statistical analysis parameters.Table 2. Value distribution of indicators for physicians working in urban areas. The table displays the mean, median, and standard deviation for each indicator in urban areas, as well as the statistical significance of the difference in means between urban and rural areas.Table 3. Value distribution of indicators for physicians working in rural areas. The table displays the mean, median, and standard deviation for each indicator in rural areas, as well as the statistical significance of the difference in means between urban and rural areas.Table 4. Differences in the distributions of the individual indicator values for physicians who work in urban and in rural areas. In Press
Clinical Research
Comparative Effectiveness of a Nurse-Led Care Model vs Usual Care in Rheumatoid Arthritis: A Longitudinal C...Med Sci Monit In Press; DOI: 10.12659/MSM.953211
Clinical Research
Impact of Treatment Modality on Pain, Sexual Function, and Psychological Well-Being in Patients With Bartho...Med Sci Monit In Press; DOI: 10.12659/MSM.952422
Clinical Research
Association Between Radiographic Knee Osteoarthritis, Pre-Fracture Mobility, and Hip Fracture Patterns in O...Med Sci Monit In Press; DOI: 10.12659/MSM.952678
Clinical Research
Association Between Total Cholesterol–to–High-Density Lipoprotein Ratio and Gestational Hypertension: A Cas...Med Sci Monit In Press; DOI: 10.12659/MSM.952395
Most Viewed Current Articles
17 Jan 2024 : Review article 14,176,084
Vaccination Guidelines for Pregnant Women: Addressing COVID-19 and the Omicron VariantDOI :10.12659/MSM.942799
Med Sci Monit 2024; 30:e942799
13 Nov 2021 : Clinical Research 3,757,530
Acceptance of COVID-19 Vaccination and Its Associated Factors Among Cancer Patients Attending the Oncology ...DOI :10.12659/MSM.932788
Med Sci Monit 2021; 27:e932788
14 Dec 2022 : Clinical Research 2,466,116
Prevalence and Variability of Allergen-Specific Immunoglobulin E in Patients with Elevated Tryptase LevelsDOI :10.12659/MSM.937990
Med Sci Monit 2022; 28:e937990
16 May 2023 : Clinical Research 708,768
Electrophysiological Testing for an Auditory Processing Disorder and Reading Performance in 54 School Stude...DOI :10.12659/MSM.940387
Med Sci Monit 2023; 29:e940387