23 November 2020: Animal Study
Intermittent Fasting Improves Lipid Metabolism Through Changes in Gut Microbiota in Diet-Induced Obese Mice
Ya Deng1BEF, Wanjun Liu1CE, Jianqing Wang2DF, Jun Yu2D, Li-qi Yang1AG*DOI: 10.12659/MSM.926789
Med Sci Monit 2020; 26:e926789


Abstract
BACKGROUND: The mechanism of how intermittent fasting (IF) improves metabolism is not fully understood. Our study aimed to explore the effect of IF on lipid metabolism in obese mice, specifically on the intestinal flora.
MATERIAL AND METHODS: Diet-induced obese (DIO) mice were subjected to ad libitum (AL) feeding or IF (alternate-day fasting) for 30 days. We examined the lipid metabolism, fat distribution, gene expression of lipid metabolism, and intestinal flora in the mice.
RESULTS: Despite having access to the same high-fat diet as the AL-fed groups, IF mice displayed pronounced weight loss, and their lipid metabolism significantly improved, mainly reflected in lower serum lipid levels and ameliorated liver steatosis. IF also reduced metabolic endotoxemia in DIO mice. The 16S ribosomal deoxyribonucleic acid gene amplicon sequencing suggested that IF did not change the community richness but had a tendency to increase community diversity in the intestinal flora. In addition, IF significantly reduced the ratio of Firmicutes to Bacteroidetes and increased the relative abundance of Allobaculum in the intestinal flora.
CONCLUSIONS: IF can improve fat metabolism, reduce fat accumulation, promote white fat conversion to beige, and improve gut microbiota.
Keywords: Basal Metabolism, DNA, Ribosomal, Fasting, Obesity, Adipose Tissue, Beige, Adipose Tissue, White, Body Weight, Diet, High-Fat, Discriminant Analysis, Dysbiosis, Energy Intake, Feeding Behavior, Lipid Metabolism, Lipopolysaccharides, Mice, Obese
Background
The increasing prevalence of obesity is a serious threat to global public health [1,2]. The obesity epidemic is a result of gene and environmental interactions as well as long-term imbalances in energy intake and consumption [3,4]. Intermittent fasting (IF) is a diet strategy [5,6] that has been shown to improve metabolism, regulate immunity, reduce oxidative stress, and prolong life [7–9]. There are many forms of IF, including fasting every other day, fasting for 2 consecutive days every week (also known as 5: 2 diet), time-limited eating, and fasting in Ramadan. However, no matter what form, its basic premise is periodic fasting during the diet [5,10]. Stekovic et al. [11] found that healthy adults who received fasting intervention every other day for more than 6 months had no adverse reactions, which further confirmed the safety of IF intervention.
The mechanism by which IF reduces obesity and improves metabolism has not been clarified. Recent research has shown that IF may occur through the gut microbiota-beige fat axis to rebuild energy balance and reduce obesity [12]. Nevertheless, the effect of IF on gut microbiota in obese mice induced by a high-fat diet (HFD) is less clear. Demonstrating the beneficial effects of IF on gut microbiota disorders in obese individuals and identifying specific bacteria contributing to this process will provide a new target for the treatment of obesity.
In this study, 30 days of IF intervention (15 cycles of alternate-day fasting) was performed on diet-induced obese (DIO) mice to demonstrate the beneficial effects of IF on weight loss and lipid metabolism. Furthermore, the 16S ribosomal deoxyribonucleic acid (rDNA) gene amplicon sequencing was applied to verify our hypothesis that IF could reverse gut microbiota dysbiosis in DIO mice.
Material and Methods
EXPERIMENTAL ANIMALS AND DIETS:
This research was approved by the Experimental Animal Ethics Committee of Anhui Medical University. Sixty 3-week-old male C57BL/6J mice were collected from Beijing Vital River Laboratory Animal Technology Co., Ltd. (China). All mice were housed in cages under controlled environmental conditions (temperature 23±2°C, 12-h light/dark cycle) and had unlimited access to water throughout the experiment. Low-fat diets (LFDs) (TP23302, Trophic Animal Feed High-Tech Co., Ltd., China) provided 3.6 kcal/g, consisting of 10% fat, 19% protein, and 71% carbohydrate. HFDs (TP2300, Trophic Animal Feed) provided 5.1 kcal/g, consisting of 60% fat, 19% protein, and 21% carbohydrate.
EXPERIMENTAL DESIGN:
The DIO mouse model was used for the first time. All mice were randomly divided into 2 groups: one group was fed an LFD (
BIOCHEMICAL TESTS:
Commercial kits were purchased from Nanjing Jiancheng Biological Research Institute to detect total cholesterol (TC), triglyceride (TG), low-density lipoprotein (LDL), high-density lipoprotein (HDL), and liver TG concentrations. Serum levels of lipopolysaccharide (LPS) were measured using commercially available enzyme-linked immunosorbent assay (ELISA) kits from Wuhan Colorful Gene Biological Technology Co., Ltd. (China).
REAL-TIME QUANTITATIVE POLYMERASE CHAIN REACTION (RT-QPCR):
Total ribonucleic acid (RNA) was extracted using the TRIzol method from tissues weighing 50–100 mg. The complementary DNA (cDNA) was synthesized using the RevertAidTM First Strand cDNA synthesis kit (Thermo Scientific, USA). The fluorescence quantitative PCR reaction system was prepared using cDNA as a template. Reaction conditions were set at 95°C for 1 min, followed by 40 cycles of reaction at 95°C for 20 s and 60°C for 1 min. Table 1 lists the primers used in this study. The results were calculated by the 2−ΔΔCt method.
HEMATOXYLIN AND EOSIN (H&E) AND IMMUNOHISTOCHEMISTRY (IHC) STAINING:
For histologic analysis, fixed mouse liver and adipose tissues were dehydrated, paraffin embedded, and sectioned at 3 μm. H&E staining was performed in accordance with the standard procedure. For IHC staining, the thick slides from adipose tissues were deparaffinized and rehydrated. Antigen retrieval was carried out in citrate buffer (pH 6.0) using high temperature and pressure. H2O2 (3%) was dripped onto the sections; they were incubated at room temperature for 20 min to block endogenous peroxidase activity. Then the primary antibody (UCP1, 1: 4000, Ab209483, Abcam, USA) was added and incubated at 37°C for 1 h, followed by incubation with a secondary antibody at 37°C for 20 min. Immunovisualization was carried out with 3,3′-diaminobenzidine (Zsbio, China). Slide digital images were collected at ×5–40 magnification with an Olympus CX41 microscope (Japan).
GUT MICROBIOTA ANALYSIS:
Fresh fecal samples from mice were collected for gut microbiota analysis. The cetyltrimethylammonium bromide method was used to extract genomic DNA from samples. The variable region 4 (V4) of the bacterial 16S rDNA genes was PCR amplified using specific primers (515F-806R) with the barcode. PCR products were used to generate sequencing libraries with the Ion Plus fragment library kit (48 rxns). Then, the library was sequenced on the Ion S5™XL platform to produce 400–600 base-pair single-end reads. Single-end reads were assigned to samples on the basis of their unique barcode and truncated by cutting off the barcode and primer sequence. The raw reads were cut and filtered, and chimeric sequences were removed to obtain the final clean reads. Uparse software (Uparse v7.0.1001) was used to cluster all clean reads of all samples. By default, the sequences were clustered into operational taxonomic units (OTUs) with 97% consistency. Representative sequences for each OTU were screened for further species annotation. For α diversity analysis, we selected abundance-based coverage estimator (ACE) indices to identify community richness and Simpson indices to identify community diversity. Both were calculated using QIIME (Version 1.7.0). The Wilcoxon rank-sum test was used for comparison between groups. The rarefaction curve and OTU rank curve were displayed using R software. For β diversity analysis, nonmetric multidimensional scaling (NMDS), on the basis of Bray-Curtis, was performed to analyze differences in gut microbiota structure within and between groups. Multiresponse permutation procedure (MRPP) analysis, a parameter test based on Bray-Curtis, was used to analyze whether the differences in the microbial community structure between groups were significant. At different levels, we applied the Kruskal-Wallis rank-sum test to analyze the differences in species between groups. Furthermore, linear discriminant analysis effect size (LEfSe) analysis, with a linear discriminant analysis (LDA) score >4, was performed to identify biomarkers with statistical differences among groups. LEfSe analysis was performed using the nonparametric factorial Kruskal-Wallis rank-sum test and then the Wilcoxon rank-sum test.
STATISTICAL ANALYSIS:
Data are presented as mean±SD. Statistical analysis was performed using SPSS (Version 16.0). Two independent sample
Results
IF REDUCED BODY WEIGHT BUT DID NOT CHANGE CUMULATIVE ENERGY INTAKE IN DIO MICE:
Over the 12 weeks, the weight difference between HFD-fed and LFD-fed mice was over 20% (P<0.001, Figure 1A), which indicated that the DIO mice model was successful. After 30 days of IF intervention, the weight of mice in the HFD+AL group was significantly higher than that in the LFD+AL group (P<0.001, Figure 1B). IF significantly reduced body weight in DIO mice (P<0.001). However, it is interesting that IF mice fed HFD were able to ingest enough energy on the diet day to compensate for the loss on the fasting day. Thus, the final cumulative energy intake did not decrease (P>0.05, Figure 1C, 1D).
IF IMPROVED LIPID METABOLISM IN DIO MICE:
Blood lipid tests suggested that the serum TC, TG, and LDL levels in the HFD+AL group were higher than those in the LFD+AL group, and the HDL levels were reduced (all P<0.01, Figure 2A). IF notably reversed these trends (all P<0.01). The liver is the major organ for lipid synthesis, so we also measured TG concentration in the liver. IF also significantly reduced liver TG levels in DIO mice (P<0.001, Figure 2B). Consistent with the biochemical results, liver histologic analysis showed that mice in the HFD+AL group developed marked hepatic steatosis (Figure 2C). IF significantly ameliorated the severity of liver steatosis in DIO mice. Of note, although the liver TG content of mice in the LFD+IF group was higher than that in the LFD+AL group (17%, P<0.001), we did not identify any fatty liver in the morphologic examinations. The results showed that the relative gene expression of Fas (a key enzyme for de novo fatty acid synthesis), Pparγ (promotes liver lipid uptake and lipid droplet formation), Cd36 (a transmembrane protein that accelerates fatty acid uptake), and Pparα (regulating fatty acid breakdown and mitochondrial β oxidation) were all significantly increased in the HFD+AL group mice (all P<0.001, Figure 2D). IF reversed these trends (all P<0.01).
IF PROMOTED CONVERSION OF WHITE ADIPOSE TISSUE (WAT) INTO BEIGE FAT IN DIO MICE:
Different parts of the adipose tissue were separated and weighed. Fat/body weight ratio was calculated and normalized against the LFD+AL group. As shown in Figure 3A, the mass of adipose tissue in the HFD+AL group, including inguinal WAT (Ing-WAT), epididymal WAT (Epi-WAT), and interscapular brown adipose tissue (Int-BAT), were all significantly higher than those in the LFD+AL group (P<0.001). IF notably reduced fat accumulation in DIO mice, especially WAT (P<0.05). By observing the H&E-stained slides of the Ing-WAT under a microscope, it was determined that the HFD+IF group had smaller adipocytes than the HFD+AL group, and an increase in multilocular adipocytes, a typical characteristic of beige adipocytes (Figure 3C). In addition, the relative messenger (m)RNA expression level of Ucp1 mRNA, a marker gene of beige fat, in the HFD+IF group was significantly higher than that in the HFD+AL group (P<0.05) (Figure 3B). IHC staining also showed that the Ucp1 signal in the HFD+IF group was stronger than that in the HFD+AL group (Figure 3D). These results suggested that IF promoted the conversion of Ing-WAT to beige in DIO mice.
IF REDUCED SERUM LPS LEVELS AND IMPROVED GUT MICROBIOTA DYSBIOSIS IN DIO MICE:
ELISA findings showed that the level of serum LPS in the HFD+AL group mice was 1.38 times that of the LFD+AL group mice (P<0.001, Figure 4A). Serum LPS is mainly from the gut and its increase is related to gut microbiota dysbiosis. In addition, this study examined the effect of IF on the intestinal flora of mice. High-throughput sequencing generated 85 145 raw reads per sample. After removing the chimera, 80 132 clean reads were obtained for each sample for the following analysis. On the basis of the 97% similarity level, all effective reads were clustered into 1176 OTUs. After comparing the results with the reference database, 613 OTUs (52.13%) were annotated at the genus level. Figure 4B and 4C show the rarefaction curves and OTU rank curves, respectively. As shown in the figures, the sequencing depth of the 4 groups was reasonable, and the species richness and evenness in HFD+IF were higher than those in the other groups. ACE index, an indicator of community richness, did not differ among groups (P>0.05, Figure 4D). The Simpson index in the LFD+IF group was significantly higher than that in the LFD+AL group (P<0.01, Figure 4E), which was used to indicate community diversity. Compared with the HFD+AL group, the HFD+IF group showed an upward trend, but the difference was not statistically significant (P>0.05). The NMDS plot showed that the gut microbiota structure of the HFD+IF group was closer to the LFD+AL group and the LFD+IF group (Figure 4F). MRPP analysis showed significant differences in community structure between the HFD+IF group and the HFD+AL group (P=0.016). These results suggested that IF reshaped gut microbiota in DIO mice. However, further analysis is required to determine the species contributing to these differences.
Figure 5A shows the top 10 bacteria at the phylum level. The HFD+AL group significantly increased the relative abundance of Firmicutes (48.7%→84.7%, P<0.01) and decreased Bacteroidetes (33.8%→7.4%, P<0.01) compared with the LFD+AL group. However, IF restored these levels: decreased Firmicutes (84.7%→63.8%, P<0.05) and increased Bacteroidetes (7.4%→22.4%, P>0.05). Thus, the ratio of Firmicutes to Bacteroidetes (F/B ratio), a widely used marker of gut microbiota dysbiosis, was decreased significantly (11.44%→2.84). At the family level, HFD+IF notably reduced the relative abundance of Enterobacteriaceae compared with the HFD+AL group (P<0.05, Supplementary Figure 1). Figure 5B and 5C show the top 30 bacteria at the genus level. Compared with the HFD+AL group, the HFD+IF group significantly increased the relative abundance of Allobaculum (P<0.01), and also increased the levels of Bifidobacterium and Alloprevotella, but the difference was not statistically significant (P>0.05). All these are beneficial bacteria that produce short-chain fatty acids (SCFAs). The relative abundance of Alistipes and Bacteroides presented an increasing trend in the HFD+IF group, which has been shown to help reduce obesity.
Furthermore, LEfSe findings showed that Lactobacillus was the key microbiota in the LFD+IF group, whereas Allobaculum was considered the dominant microbiota in the HFD+IF group (Figure 6A–6C). Surprisingly, the relative abundance of Allobaculum was notably increased in all samples of the HFD+IF group, whereas it was extremely low in the other groups. Therefore, we speculated that Allobaculum might be the key bacteria responsible for the beneficial effects of IF on DIO mice.
Discussion
In recent years, IF, as a nondrug intervention measure to treat obesity, has aroused widespread concern in the scientific community and even the public. It has been shown to bring the same health benefits as continuous energy limitation, and is as easy to control as alternative means of continuous energy limitation [13–15].
In our study, IF reduced the weight of mice and reduced abdominal obesity, but did not reduce energy intake, which was highly consistent with previous research [12]. In addition, Kim et al. [16] designed an IF strategy with equal calories. The results showed that IF can promote metabolic balance and fight against diet-induced obesity and metabolic dysfunction, which were not dependent on the reduction of energy intake. Our findings showed that IF significantly ameliorated the lipid metabolism disorder in DIO mice. This was mainly reflected in the improvement of dyslipidemia and liver steatosis. Mice fed a HFD showed a tendency to develop fatty liver degeneration. The expression of some genes involved in lipid synthesis and transport in their livers increased, which was reversed by IF. The research results of Chung et al. [17] are similar to ours. They conducted a time-limited feeding intervention on postmenopausal obese mice and found that although the time-limited feeding mice ingested the same amount of high-fat forage as the free-diet mice, their liver lipid deposition was significantly reduced. They proposed that the prolonged fasting period prompted mice to take lipid oxidation metabolism as the main energy source, causing the liver to stop lipid synthesis, increase lipid oxidation, and then effectively eliminate and prevent liver steatosis [17]. However, our results were not consistent with their findings. IF did not significantly increase the expression of lipolysis-related genes in the liver, which may be due to the lack of detected gene types. In subsequent experiments, gene detection in other pathways related to lipolysis in the liver should be increased.
In this study, IF reduced the weight of white fat in the groin and epididymis of DIO mice. We also found that IF reduced the weight of brown fat between the scapula of DIO mice. However, Li et al. [12] used the Echo MRI mouse scanner to detect the body composition of nonanesthetized mice, and found that IF had a similar trend of increasing brown fat content. Our DIO mice were fasted intermittently. The results of H&E staining of white adipose tissue in the groin of mice showed that the adipocytes presented the structure of multiple vesicles, the number of lipid droplets increased, and the volume decreased. UCP1, a key factor in thermoregulation, is specifically expressed in brown fat cells and beige fat cells [18–20]. We used RT-qPCR and IHC gene detection methods to confirm the increased expression of UCP1 in white fat tissues of mice after IF. Taken together, our results suggested that beige fat appeared in the white fat of mice after the IF intervention. Kim et al. [16] proposed a potential mechanism by which IF upregulates the expression of vascular endothelial growth factor in white fat, which can selectively activate the M2-type macrophages in white adipose tissue, thus promoting conversion of white adipose to beige. Other research also supported the causal role of gut microbiota in the development of beige fat [21].Moreover, the white adipose tissue of mice fed a LFD had more significant polycystic structure and much more expression of UCP1, which suggested that LFD might also be the way to promote the conversion of white adipose to beige. The reason for the low weight of mice fed an LFD compared with mice fed a HFD was not only the decrease in food intake, but also the increase in energy consumption.
The occurrence of obesity is related to the change in the relative abundance of the 2 dominant bacteria in the gut microbiota, Firmicutes and Bacteroidetes [22]. In 2006, scientists first proposed that the F/B value in the gut microbiota of stout people and genetically obese mice (ob/ob) increased [23]. From then on, this pattern of composition has also been reported in overweight pregnant women, infants who become overweight later in childhood, and obese mice fed a HFD [22]. Therefore, the increased F/B value can be used as a biomarker of obesity. In our study, the F/B value of DIO mice increased significantly, whereas it decreased after IF. Meanwhile, IF significantly increased the relative abundance of
The relationship among inflammation, oxidative stress, metabolic disorder, and intestinal flora induced by a HFD may be LPS dependent [13,30,31]. LPS, also known as endotoxin, is the main component of the outer membrane of gram-negative bacteria. We found that the level of LPS in the plasma of DIO mice was slightly increased, defined as metabolic endotoxemia by Cani et al. [32]. Our findings suggested that IF could reduce LPS levels. LPS mainly originates in the intestine. Previous studies have found that increased intestinal permeability aggravates metabolic endotoxemia [30]. Alcohol intake, fixed stress, and radiation are among some factors that are known to promote intestinal leakage, increasing plasma LPS levels and changing the gut microbiota [30]. Changes in intestinal flora mediated by a HFD can significantly increase intestinal permeability by lowering the expression of genes encoding the tight junction proteins ZO-1 and tobramycin [30]. Our study found that IF tended to increase the abundance of
We confirmed that IF can reverse the gut microbiota disorder of DIO mice and convert white fat into beige fat, playing a role through the gut microbiota-beige fat axis. Furthermore, we found that IF can ameliorate metabolic endotoxemia in DIO mice. Therefore, we speculated that IF may also maintain the integrity of the intestinal barrier function by optimizing intestinal flora, reducing intestinal permeability and ensuring the reduction of LPS translocation. The reduction of LPS translocation can reduce the low-level, systemic, and chronic inflammation mediated by metabolic endotoxemia. This series of changes are thought to reduce obesity and improve metabolism. However, the above conjecture needs further verification. Taken together, our results suggested that
A limitation of this study was that only one form of IF (fasting every other day) was studied. Our results cannot be directly extrapolated to other forms of fasting. Several types of IF have been shown to improve obesity and related metabolic diseases in animal and human studies [35–39]. However, further study is required to understand their influence on gut microbiota. Even though our findings and previous studies have suggested that IF can reshape intestinal flora without requiring dietary changes, further work in elucidating the molecular mechanisms involved in such outcomes is warranted.
Conclusions
We confirmed that IF can improve fat metabolism, reduce fat accumulation, promote white fat formation, and improve gut microbiota disorder. We also found that IF can reduce metabolic endotoxemia and improve gut microbiota disorders in obese mice without reducing food intake.
Figures
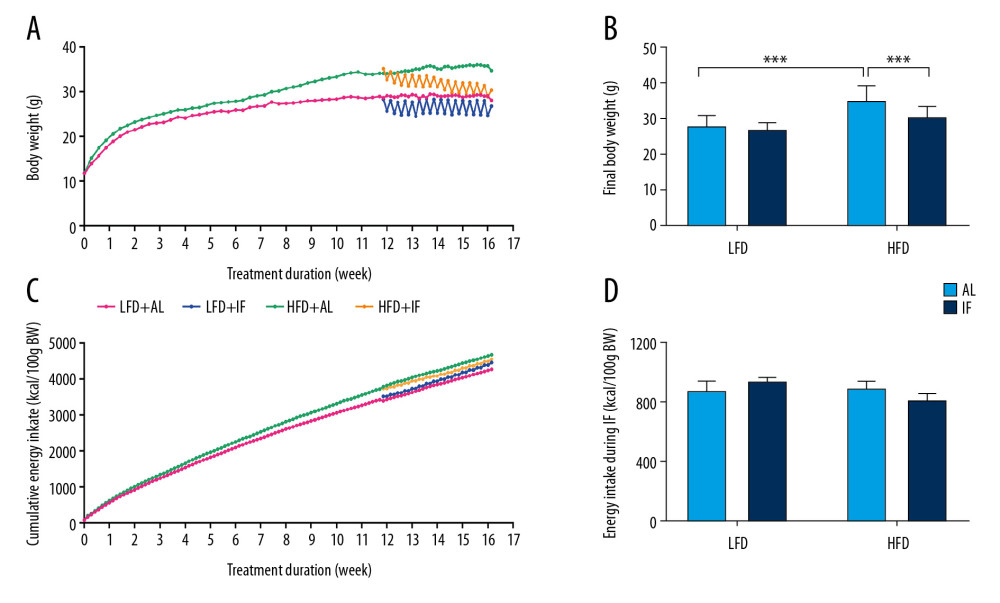 Figure 1. Effects of intermittent fasting on body weight and food intake in mice. (A) Weight change during the whole experiment (n=15). (B) Final body weight (n=15). (C) Cumulative energy intake over the course of the experiment (n=15). (D) Cumulative energy intake during 30 days of intermittent fasting or ad libitum intervention. Data were presented as mean±SD. Differences between groups were statistically analyzed using 1-way analysis of variance. * P<0.05, ** P<0.01, *** P<0.001.
 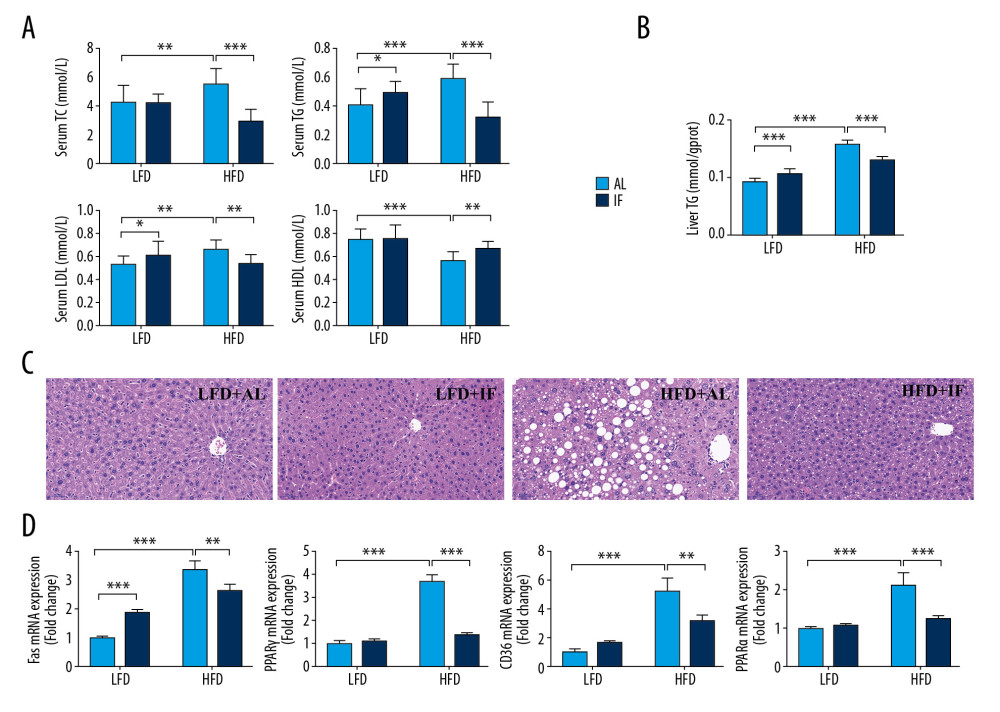 Figure 2. Effects of intermittent fasting on lipid metabolism in mice. (A) Levels of serum lipid include total cholesterol (TC), triglycerides (TG), low-density lipoprotein (LDL), and high-density lipoprotein (HDL) (n=12). (B) Concentration of liver TG (n=15). (C) Liver hematoxylin and eosin stained sections. Scale bar: 50 μm. (D) Expression of genes involved in lipid synthesis, transport, and lipolysis in the liver (n=3). Data were presented as mean±SD. Differences between groups were statistically analyzed using 1-way analysis of variance. * P<0.05, ** P<0.01, *** P<0.001.
 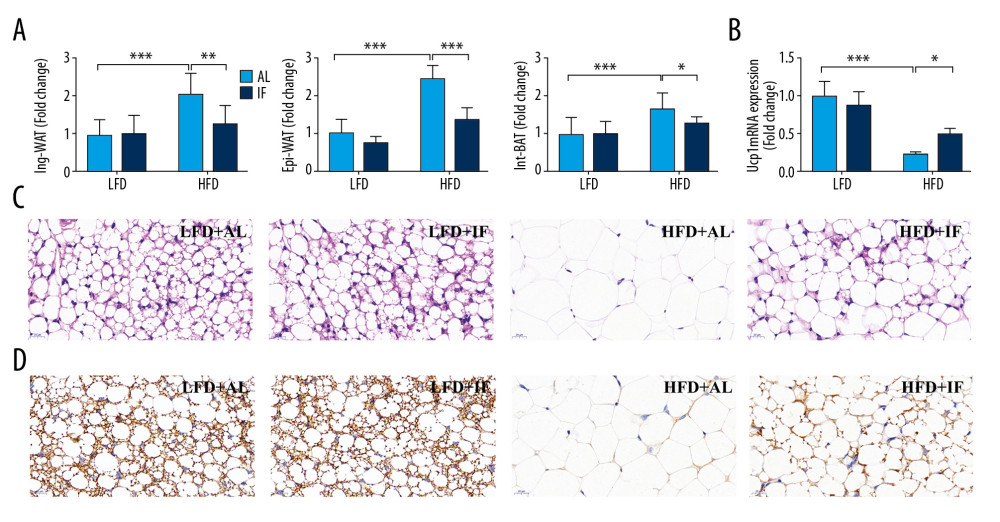 Figure 3. Effects of intermittent fasting on fat in mice. (A) Standardized fat/body weight ratios for different parts of fat, including inguinal white adipose tissue (Ing-WAT), epididymal white adipose tissue (Epi-WAT), and interscapular brown adipose tissue (Int-BAT) (n=10). (B) Ucp1 messenger ribonucleic acid (mRNA) expression in Ing-WAT (n=3). (C) Representative hematoxylin and eosin stained sections. Scale bar: 20 μm. (D) Representative Ucp1 immunohistochemically stained section. Scale bar: 20 μm. Data were presented as mean±SD. Differences between groups were statistically analyzed using 1-way analysis of variance. * P<0.05, ** P<0.01, *** P<0.001.
 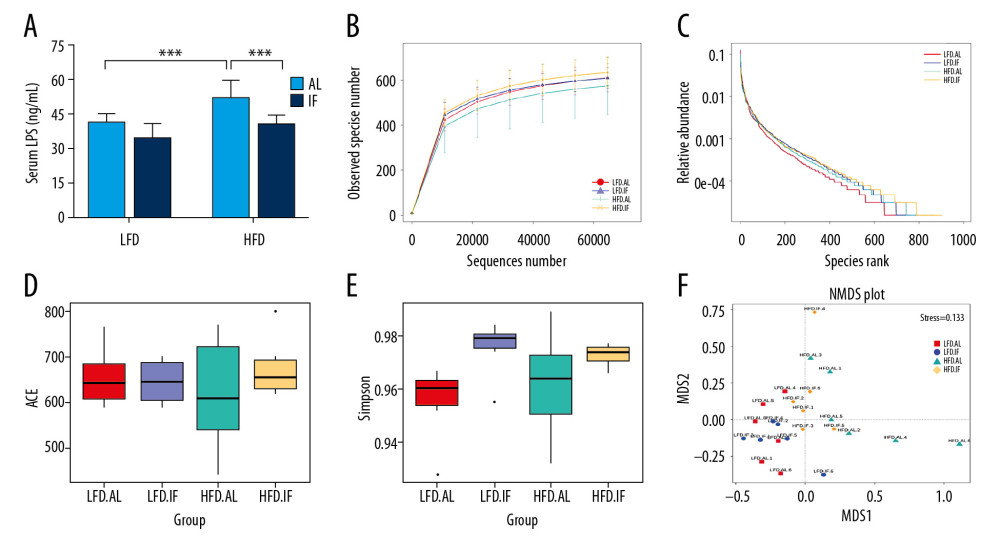 Figure 4. Effects of intermittent fasting on serum lipopolysaccharide (LPS) in mice and comparison of α diversity and β diversity in the gut microbiota of each group. (A) Serum LPS level (n=10). Data were presented as mean±SD. Differences between groups were statistically analyzed using 1-way analysis of variance. * P<0.05, ** P<0.01, *** P<0.001. (B, C) Rarefaction curves and operational taxonomic unit rank curves. (D, E) Abundance-based coverage estimator index and Simpson index (n=6). (F) Nonmetric multidimensional plot.
 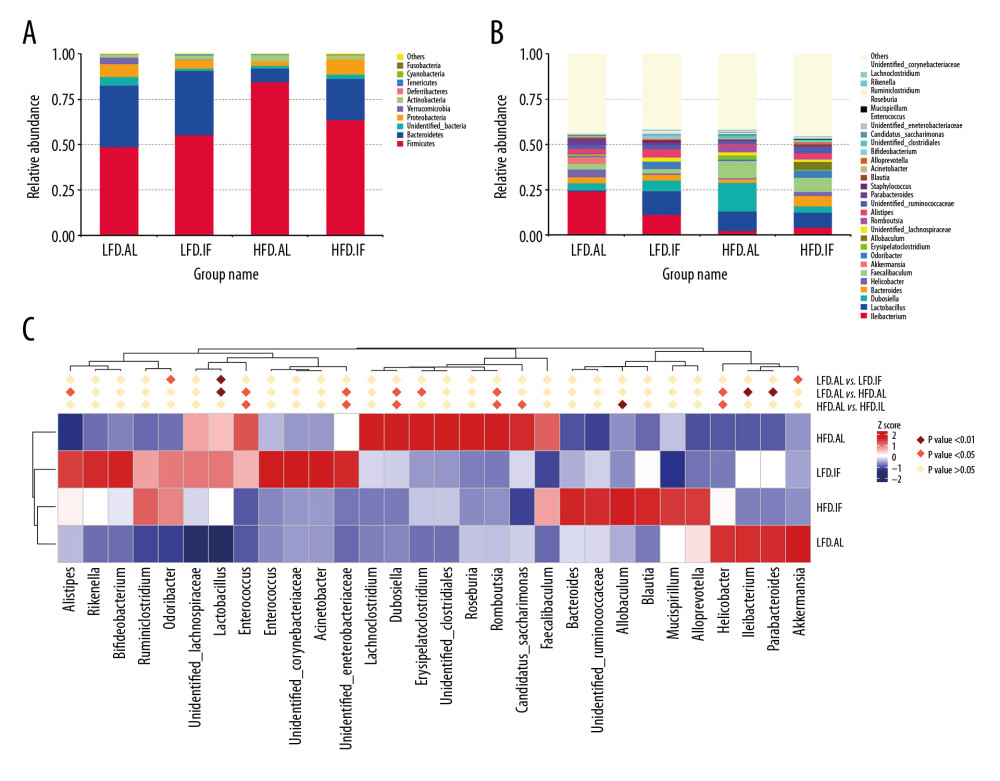 Figure 5. Distribution analysis of gut microbiota in each group. (A) Relative abundance of the top 10 bacteria at the phylum level. (B) Relative abundance of the top 30 bacteria at genus level. (C) Heat map of relative abundance of top 30 bacteria at genus level.
 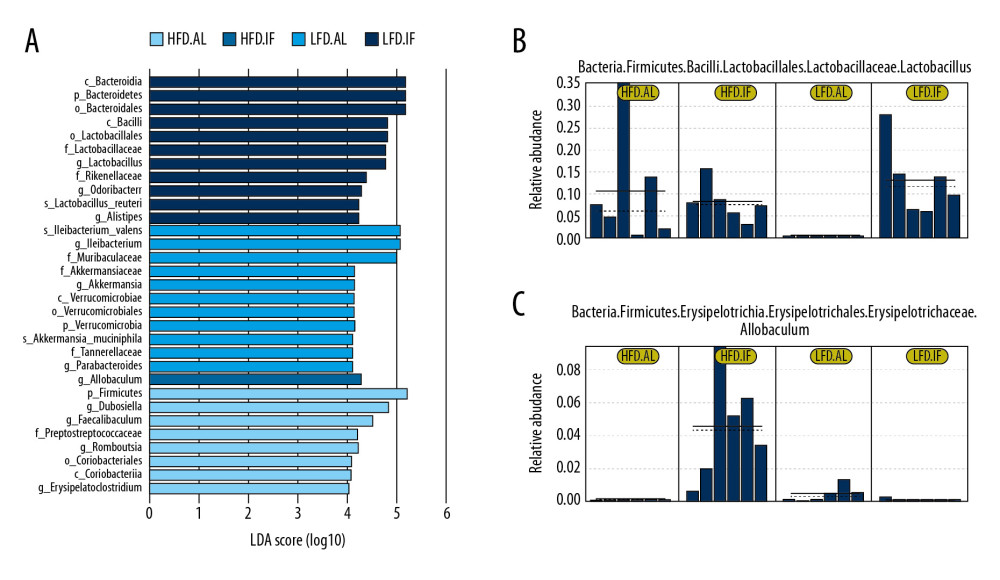 Figure 6. Linear discriminant analysis effect size (LEfSe) analysis. (A) Histogram of linear discriminant analysis score comparison among groups. (B, C) Relative abundance of Lactobacillus and Allobaculum from the LEfSe results. Solid and dashed lines indicate mean and median, respectively.
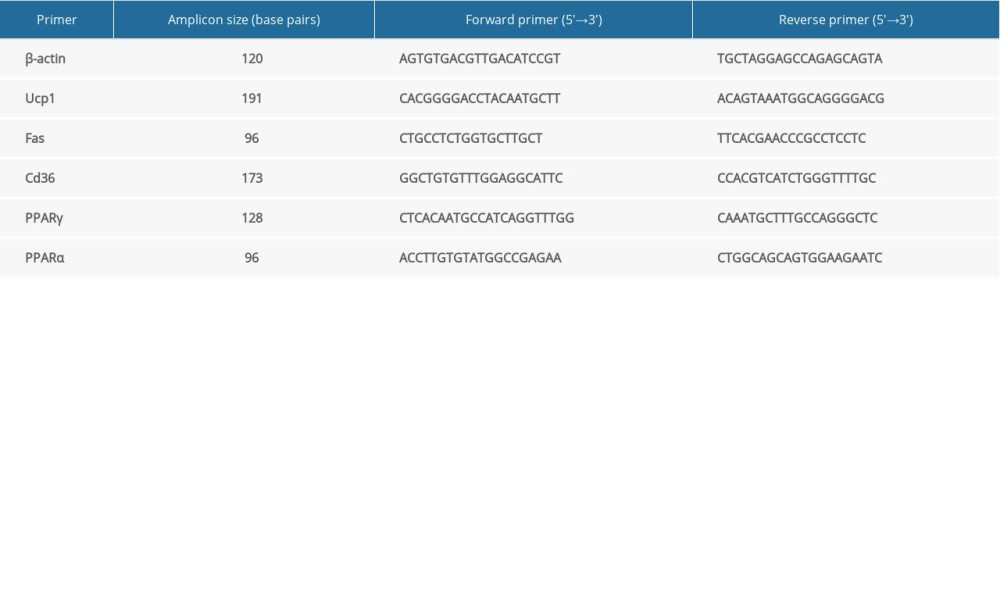
References
1. World Health Organization: Obesity and overweight, 2018 http://www.who.int/mediacentre/factsheets/fs311/en/index.html
2. Thom G, Mike L, Is there an optimal diet for weight management and metabolic health?: Gastroenterology, 2017; 152(7); 1739-51
3. Hill JO, Wyatt HR, Energy balance and obesity: Circulation, 2012; 126(1); 126-32
4. Parks BW, Nam E, Org E, Genetic control of obesity and gut microbiota composition in response to high-fat, high-sucrose diet in mice: Cell Metab, 2013; 17(1); 141-52
5. Stockman MC, Thomas D, Burke J, Intermittent fasting: Is the wait worth the weight?: Curr Obes Rep, 2018; 7(2); 172-85
6. Mattison JA, Colman RJ, Beasley TM, Caloric restriction improves health and survival of rhesus monkeys: Nat Commun, 2017; 8; 14063
7. Fontana L, Promoting health and longevity through diet: From model organisms to humans: Cell, 2015; 161(1); 106-18
8. Longo VD, Fasting, circadian rhythms, and time-restricted feeding in healthy lifespan: Cell Metab, 2016; 23(6); 1048-59
9. de Cabo R, Mattson MP, Effects of Intermittent fasting on health, aging, and disease: N Engl J Med, 2020; 382(3); 298
10. Patterson RE, Metabolice Effects of intermittent fasting: Annu Rev Nutr, 2017; 37; 371-93
11. Stekovic S, Hofer SJ, Tripolt N, Alternate day fasting improves physiological and molecular markers of aging in healthy, non-obese humans: Cell Metab, 2019; 30(3); 462-76.e5
12. Li G, Xie C, Lu S, Intermittent fasting promotes white adipose browning and decreases obesity by shaping the gut microbiota: Cell Metab, 2017; 26(5); 801
13. Rynders CA, Thomas EA, Zaman A, Effectiveness of intermittent fasting and time-restricted feeding compared to continuous energy restriction for weight loss: Nutrients, 2019; 11(10); 2442
14. Harvie MN, Pegington M, Mattson MP, The effects of intermittent or continuous energy restriction on weight loss and metabolic disease risk markers: A randomized trial in young overweight women: Int J Obes, 2011; 35(5); 714-27
15. Harvie M, Wright C, Pegington M, The effect of intermittent energy and carbohydrate restriction v. daily energy restriction on weight loss and metabolic disease risk markers in overweight women: Br J Nutr, 2013; 110(8); 1534-47
16. Kim KH, Kim YH, Son JE, Intermittent fasting promotes adipose thermogenesis and metabolic homeostasis via VEGF-mediated alternative activation of macrophage: Cell Res, 2017; 27(11); 1309-26
17. Chung H, Chou W, Sears DD, Time-restricted feeding improves insulin resistance and hepatic steatosis in a mouse model of postmenopausal obesity: Metabolism, 2016; 65(12); 1743-54
18. Kajimura S, Spiegelman BM, Brown and beige fat: Physiological roles beyond heat generation: Cell Metab, 2015; 22(4); 546-59
19. Long JZ, Svensson KJ, Tsai L, A smooth muscle-like origin for beige adipocytes: Cell Metab, 2014; 19(5); 810-20
20. Suárez-Zamorano N, Fabbiano S, Chevalier C, Microbiota depletion promotes browning of white adipose tissue and reduces obesity: Nat Med, 2015; 21(12); 1497-501
21. Chevalier C, Stojanović O, Colin DJ, Gut microbiota orchestrates energy homeostasis during cold: Cell, 2015; 163(6); 1360-74
22. Zhao L, The gut microbiota and obesity: From correlation to causality: Nat Rev Microbiol, 2013; 11(9); 639-47
23. Ley RE, Turnbaugh PJ, Klein S, Microbial ecology: Human gut microbes associated with obesity: Nature, 2006; 444(7122); 1022-23
24. Kong C, Gao R, Yan X, Probiotics improve gut microbiota dysbiosis in obese mice fed a high-fat or high-sucrose diet: Nutrition, 2019; 60; 175-84
25. Rooks MG, Gut microbiota, metabolites and host immunity: Nat Rev Immunol, 2016; 16(6); 341-52
26. Yu C, Liu S, Chen L, Effect of exercise and butyrate supplementation on microbiota composition and lipid metabolism: J Endocrinol, 2019; 243(2); 125-35
27. de la Cuesta-Zuluaga J, Mueller NT, Álvarez-Quintero R, Higher fecal short-chain fatty acid levels are associated with gut microbiome dysbiosis, obesity, hypertension and cardiometabolic disease risk factors: Nutrients, 2018; 11(1); 51
28. Schwiertz A, Taras D, Schäfer K, Microbiota and SCFA in lean and overweight healthy subjects: Obesity, 2010; 18(1); 190-95
29. Cignarella F, Cantoni C, Ghezzi L, Intermittent fasting confers protection in CNS autoimmunity by altering the gut microbiota: Cell Metab, 2018; 27; 1222-35.e6
30. Cani PD, Bibiloni R, Knauf C, Changes in gut microbiota control metabolic endotoxemia-induced inflammation in high-fat diet-induced obesity and diabetes in mice: Diabetes, 2008; 57(6); 1470-81
31. Cani PD, Possemiers S, Van de Wiele T, Changes in gut microbiota control inflammation in obese mice through a mechanism involving GLP-2-driven improvement of gut permeability: Gut, 2009; 58(8); 1091-103
32. Cani PD, Amar J, Iglesias MA, Metabolic endotoxemia initiates obesity and insulin resistance: Diabetes, 2007; 56(7); 1761-72
33. Kelly CJ, Zheng L, Campbell EL, Crosstalk between microbiota-derived short-chain fatty acids and intestinal epithelial HIF augments tissue barrier function: Cell Host Microbe, 2015; 17(5); 662-71
34. Furman D, Campisi J, Verdin E, Chronic inflammation in the etiology of disease across the life span: Nat Med, 2019; 25(12); 1822-32
35. Gotthardt JD, Verpeut JL, Yeomans BL, Intermittent fasting promotes fat loss with lean mass retention, increased hypothalamic norepinephrine content, and increased neuropeptide Y gene expression in diet-induced obese male mice: Endocrinology, 2016; 157(2); 679-91
36. Joslin PMN, Bell RK, Obese mice on a high-fat alternate-day fasting regimen lose weight and improve glucose tolerance: J Anim Physiol Anim Nutr, 2017; 101(5); 1036-45
37. Varady KA, Impact of intermittent fasting on glucose homeostasis: Curr Opin Clin Nutr Metab Care, 2016; 19(4); 300-2
38. Yang W, Cao M, Mao X, Alternate-day fasting protects the livers of mice against high-fat diet-induced inflammation associated with the suppression of toll-like receptor 4/nuclear factor κB signaling: Nutr Res, 2016; 36(6); 586-93
39. Liu B, Page AJ, Hatzinikolas G, Intermittent fasting improves glucose tolerance and promotes adipose tissue remodeling in male mice fed a high-fat diet: Endocrinology, 2019; 160(1); 169-80
Figures
Figure 1. Effects of intermittent fasting on body weight and food intake in mice. (A) Weight change during the whole experiment (n=15). (B) Final body weight (n=15). (C) Cumulative energy intake over the course of the experiment (n=15). (D) Cumulative energy intake during 30 days of intermittent fasting or ad libitum intervention. Data were presented as mean±SD. Differences between groups were statistically analyzed using 1-way analysis of variance. * P<0.05, ** P<0.01, *** P<0.001.Figure 2. Effects of intermittent fasting on lipid metabolism in mice. (A) Levels of serum lipid include total cholesterol (TC), triglycerides (TG), low-density lipoprotein (LDL), and high-density lipoprotein (HDL) (n=12). (B) Concentration of liver TG (n=15). (C) Liver hematoxylin and eosin stained sections. Scale bar: 50 μm. (D) Expression of genes involved in lipid synthesis, transport, and lipolysis in the liver (n=3). Data were presented as mean±SD. Differences between groups were statistically analyzed using 1-way analysis of variance. * P<0.05, ** P<0.01, *** P<0.001.Figure 3. Effects of intermittent fasting on fat in mice. (A) Standardized fat/body weight ratios for different parts of fat, including inguinal white adipose tissue (Ing-WAT), epididymal white adipose tissue (Epi-WAT), and interscapular brown adipose tissue (Int-BAT) (n=10). (B) Ucp1 messenger ribonucleic acid (mRNA) expression in Ing-WAT (n=3). (C) Representative hematoxylin and eosin stained sections. Scale bar: 20 μm. (D) Representative Ucp1 immunohistochemically stained section. Scale bar: 20 μm. Data were presented as mean±SD. Differences between groups were statistically analyzed using 1-way analysis of variance. * P<0.05, ** P<0.01, *** P<0.001.Figure 4. Effects of intermittent fasting on serum lipopolysaccharide (LPS) in mice and comparison of α diversity and β diversity in the gut microbiota of each group. (A) Serum LPS level (n=10). Data were presented as mean±SD. Differences between groups were statistically analyzed using 1-way analysis of variance. * P<0.05, ** P<0.01, *** P<0.001. (B, C) Rarefaction curves and operational taxonomic unit rank curves. (D, E) Abundance-based coverage estimator index and Simpson index (n=6). (F) Nonmetric multidimensional plot.Figure 5. Distribution analysis of gut microbiota in each group. (A) Relative abundance of the top 10 bacteria at the phylum level. (B) Relative abundance of the top 30 bacteria at genus level. (C) Heat map of relative abundance of top 30 bacteria at genus level.Figure 6. Linear discriminant analysis effect size (LEfSe) analysis. (A) Histogram of linear discriminant analysis score comparison among groups. (B, C) Relative abundance of Lactobacillus and Allobaculum from the LEfSe results. Solid and dashed lines indicate mean and median, respectively. In Press
Clinical Research
Body Weight and Insulin Resistance Indicators Among ChildrenMed Sci Monit In Press; DOI: 10.12659/MSM.951434
Clinical Research
Comparison of Radiographic Cervical Sagittal Alignment Parameters in Patients With Nonspecific Neck Pain, D...Med Sci Monit In Press; DOI: 10.12659/MSM.952950
Clinical Research
Combined Fibrinogen and Urinary α1-Microglobulin as Predictors of Respiratory Tract Infection in Children w...Med Sci Monit In Press; DOI: 10.12659/MSM.951066
Database Analysis
Evaluation of Salivary Total Oxidant Status (TOS) and Total Antioxidant Status (TAS) in Orthodontic Patient...Med Sci Monit In Press; DOI: 10.12659/MSM.952052
Most Viewed Current Articles
17 Jan 2024 : Review article 14,175,576
Vaccination Guidelines for Pregnant Women: Addressing COVID-19 and the Omicron VariantDOI :10.12659/MSM.942799
Med Sci Monit 2024; 30:e942799
13 Nov 2021 : Clinical Research 3,756,620
Acceptance of COVID-19 Vaccination and Its Associated Factors Among Cancer Patients Attending the Oncology ...DOI :10.12659/MSM.932788
Med Sci Monit 2021; 27:e932788
14 Dec 2022 : Clinical Research 2,465,966
Prevalence and Variability of Allergen-Specific Immunoglobulin E in Patients with Elevated Tryptase LevelsDOI :10.12659/MSM.937990
Med Sci Monit 2022; 28:e937990
16 May 2023 : Clinical Research 708,651
Electrophysiological Testing for an Auditory Processing Disorder and Reading Performance in 54 School Stude...DOI :10.12659/MSM.940387
Med Sci Monit 2023; 29:e940387