14 February 2021: Database Analysis
Identification of Potential Biomarkers Associated with Prognosis in Gastric Cancer via Bioinformatics Analysis
Dong Li1ABCDEF*, Yi Yin2ACEG, Muqun He2BDF, Jianfeng Wang2BDFDOI: 10.12659/MSM.929104
Med Sci Monit 2021; 27:e929104
Abstract
BACKGROUND: Gastric cancer (GC) is one of the leading causes of cancer-related mortality worldwide. We aimed to identify differentially expressed genes (DEGs) and their potential mechanisms associated with the prognosis of GC patients.
MATERIAL AND METHODS: This study was based on gene profiling information for 37 paired samples of GC and adjacent normal tissues from the GSE118916, GSE79973, and GSE19826 datasets in the Gene Expression Omnibus database. Gene Ontology and Kyoto Encyclopedia of Genes and Genomes (KEGG) analyses were used to investigate the biological role of the DEGs. The protein–protein interaction (PPI) network was constructed by Cytoscape, and the Kaplan-Meier plotter was used for prognostic analysis.
RESULTS: We identified 119 DEGs, including 21 upregulated and 98 downregulated genes, in GC. The 21 upregulated genes were mainly enriched in extracellular matrix-receptor interaction, focal adhesion, and transforming growth factor-β signaling, while the 98 downregulated genes were significantly associated with gastric acid secretion, retinol metabolism, and metabolism of xenobiotics by cytochrome P450. Thirty hub DEGs were obtained for further analysis. Twenty-five of the 30 hub DEGs were significantly associated with the prognosis of GC, and 21 of the 25 hub DEGs showed consistent expression trends within the 3 profile datasets. KEGG reanalysis of these 21 hub DEGs showed that COL1A1, COL1A2, COL2A1, COL11A1, THBS2, and SPP1 were mainly enriched in the extracellular matrix-receptor interaction pathways.
CONCLUSIONS: We identified 6 genes that were significantly related to the prognosis of GC patients. These genes and pathways could serve as potential prognostic markers and be used to develop treatments for GC patients.
Keywords: Gene Expression Profiling, Tumor Markers, Biological, Computational Biology, Databases, Genetic, gene ontology, Gene Regulatory Networks, Protein Interaction Mapping, Protein Interaction Maps
Background
Gastric cancer (GC) is the fourth most common cancer in the world and the second in China, and the second leading cause of cancer-related death worldwide and in China [1,2]. In China, there were approximately 679 100 new cases of GC and 498 000 GC-related deaths in 2015 [3]. Based on histopathological classification, GC is separated into 3 main groups, adenocarcinoma, undifferentiated carcinoma, and signet ring-cell carcinoma, and more than 95% of cases are gastric adenocarcinomas. Most GC patients are asymptomatic in the early stages, and GC is frequently not diagnosed until the disease has already progressed to an advanced stage. Due to the difficulty of early diagnosis, rapid spread, and distant metastasis of GC, the prognosis of GC remains poor. Therefore, novel reliable prognostic biomarkers need to be identified to understand the molecular mechanisms of GC and to improve therapeutic outcomes.
Microarray analysis has been used for more than 10 years as a reliable technique to probe differentially expressed genes (DEGs) and identify potential clinical biomarkers. There are a large number of valuable datasets in public databases for exploring new research questions. In this study, we analyzed the differential expression patterns between GC tumor tissues and matched normal tissues to explore the hub genes and key pathways associated with GC prognosis. We used bioinformatics methods to investigate differential gene expression and to conduct functional enrichment analyses to identify potential molecular mechanisms in GC.
Material and Methods
MICROARRAY DATA INFORMATION:
We obtained GSE118916, GSE79973, and GSE19826 mRNA expression profiles from the Gene Expression Omnibus (GEO) database (http://www.ncbi.nlm.nih.gov/geo), a free public microarray/gene profile database [4–7]. The GSE118916, GSE79973, and GSE19826 datasets were respectively based on 15, 10, and 12 pairs of GC tissues and adjacent nontumor (normal) tissues, with gene expression profiles generated by the Affymetrix Human Gene Expression Array platform. The diagnosis of GC was independently confirmed for all patients by 2 pathologists using the criteria provided by the American Joint Committee on Cancer (AJCC) [8].
IDENTIFICATION OF DEGS:
Common DEGs from the 3 datasets were screened using the GEO2R online tool and Venn diagram software. DEGs were identified with |logFC| >2 and adjusted
GENE ONTOLOGY AND KYOTO ENCYCLOPEDIA OF GENES AND GENOMES ANALYSIS:
The DAVID database (https://david.ncifcrf.gov/) [9] was used to carry out Kyoto Encyclopedia of Genes and Genomes (KEGG) pathways and Gene Ontology (GO) enrichment analysis of identified DEGs, including those associated with molecular functions, cellular components, and biological processes [10]. GO terms and KEGG pathways with P<0.05 were selected as significant.
CONSTRUCTION OF PROTEIN–PROTEIN INTERACTION NETWORK AND MODULE ANALYSIS:
Protein–protein interaction (PPI) information was obtained through an online STRING analysis (http://string-db.org) [11]. Cytoscape software for additional analyses was used to identify hub DEGs and to construct the PPI network. The plug-in MCODE of Cytoscape was applied to detect significant modules in the PPI network. The cutoff criteria were set with degree cutoff=2, node score cutoff=0.2, maximum depth=100, and k-core=2 [12].
VALIDATION OF HUB DEGS:
The online Kaplan-Meier plotter database (https://kmplot.com/analysis/) was used to assess the prognostic value of hub DEGs among GC patients (P<0.05) [13]. There were 875 GC patients recruited for survival analysis. Hazard ratios, their 95% confidence intervals, and log-rank P values were calculated. The GEPIA server (http://gepia.cancer-pku.cn/) was used to further validate the expression of hub DEGs in GC tissues and normal tissues (P<0.05) [14].
Results
IDENTIFICATION OF DEGS IN GC:
We extracted 350, 579, and 340 DEGs from 37 paired GC and normal gastric tissues from GSE118916, GSE79973, and GSE19826, respectively. We identified 119 common DEGs in the 3 datasets by using online Venn diagram software. These DEGs included 21 upregulated genes (logFC >0) and 98 downregulated genes (logFC <0) (Table 1, Figure 1).
FUNCTIONAL ENRICHMENT ANALYSIS OF DEGS:
Functional enrichment analysis of the 119 DEGs was conducted using DAVID software. The DEGs were divided into 3 functional groups: biological processes, cellular components, and molecular functions. The GO analysis showed that for biological processes, upregulated DEGs were mainly related to collagen fibril organization, endodermal cell differentiation, negative regulation of angiogenesis, collagen biosynthetic process, skin morphogenesis, and protein heterotrimerization, while the downregulated DEGs were related to digestion, cellular aldehyde metabolic process, gastric acid secretion, potassium ion import, xenobiotic metabolic process, and oxidation-reduction process. For cellular components, upregulated DEGs were involved in collagen trimer, extracellular space, proteinaceous extracellular matrix (ECM), collagen type I trimer, bicellular tight junction, and apicolateral plasma membrane, and the downregulated DEGs were associated with extracellular space, extracellular exosome, basolateral plasma membrane, integral component of plasma membrane, apical plasma membrane, and extracellular region. For molecular function, upregulated DEGs were particularly enriched in ECM structural constituents and structural molecule activity, and downregulated DEGs were involved in inward-rectifier potassium channel activity, benzaldehyde dehydrogenase (NAD+) activity, hydrogen-potassium exchange ATPase activity, identical protein binding, chloride channel activity, and retinal dehydrogenase activity (Table 2).
The KEGG analysis results provided by DAVID software are shown in Table 3. The upregulated DEGs were mainly associated with the signaling pathways in ECM-receptor interaction, focal adhesion, transforming growth factor-β signaling pathway, leukocyte transendothelial migration, cell adhesion molecules, and tight junctions, while the downregulated DEGs were significantly enriched in gastric acid secretion, retinol metabolism, metabolism of xenobiotics by cytochrome P450, chemical carcinogenesis, drug metabolism-cytochrome P450, metabolic pathways, collecting duct acid secretion, and fructose and mannose metabolism.
PPI NETWORK AND CLUSTER ANALYSIS:
STRING and Cytoscape were used to construct the PPI network and conduct further explorations. A total of 119 DEGs (21 upregulated and 98 downregulated genes) were filtered into the PPI network, which contained 90 nodes and 162 edges (Figure 2A) and excluded 29 DEGs. We applied Cytoscape MCODE for further analysis to obtain 30 hub nodes among 90 nodes and 75 edges (Figure 2B). The 30 hub DEGs included 13 upregulated and 17 downregulated genes.
SURVIVAL ANALYSIS AND VALIDATION OF HUB DEGS:
To further analyze the effect of hub DEGs in GC, the Kaplan-Meier plotter was used to identify 30 hub DEGs associated with the prognosis of 875 GC patients. The results demonstrated 25 hub DEGs were significantly associated with the prognosis of GC patients, while CLDN1, GKN1, HDC, GIF, and FAP were not statistically significant (P>0.05, Table 4, Figure 3). The online GEPIA software was used to validate the expression of 25 hub DEGs between GC tissues and normal tissues. Twenty-one of the 25 hub DEGs showed significantly different expression and consistent expression trends in GSE118916, GSE79973, and GSE19826 (Table 5, Figure 4). A total of 11 out of 21 hub upregulated genes identified in the present study were also overexpressed (P<0.05), while the other 10 hub downregulated genes were also downregulated in the GEO dataset.
PATHWAY ENRICHMENT REANALYSIS AND STAGE ANALYSIS OF HUB DEGS:
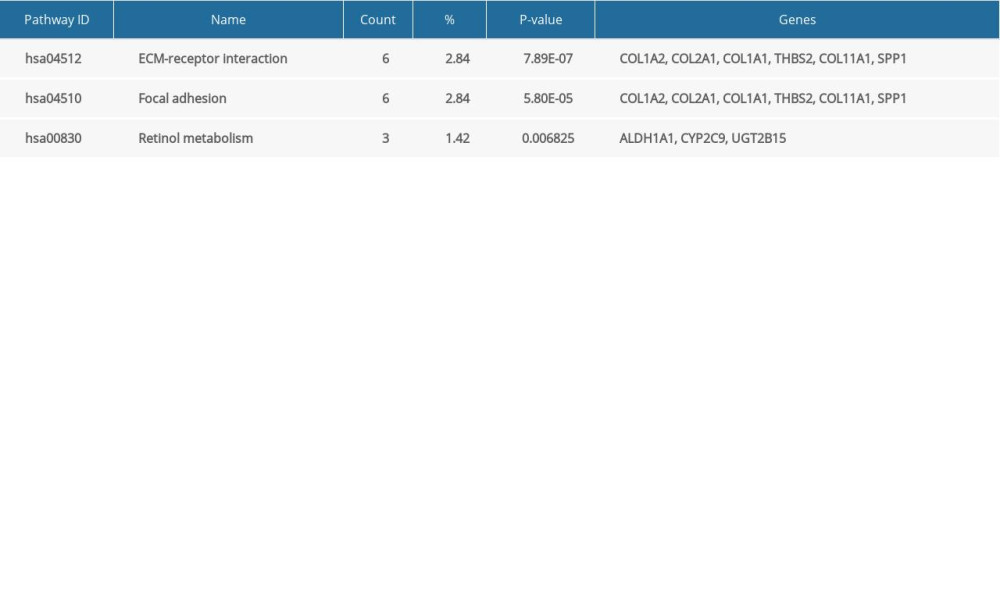
Twenty-one hub DEGs were reanalyzed by DAVID software to identify strongly associated pathways. The results showed that COL1A1, COL1A2, COL2A1, COL11A1, THBS2, and SPP1 were mainly enriched in the ECM-receptor interaction or focal adhesion pathways (Table 6). We used the online GEPIA software to validate the expression of these 6 hub DEGs in different GC stages. Statistical analysis showed significant differential expression of COL1A1, COL1A2, COL11A1, and THBS2, while COL2A1 and SPP1 expression was not significantly different across different GC stages (Figure 5).
Discussion
Although surgery, chemotherapy, radiation therapy, immunotherapy, and other treatment methods have improved in GC, the current state of treatment and prognosis for GC patients remains unsatisfactory due to the difficulty of early diagnosis. Many patients are not diagnosed until GC is at an advanced or inoperable stage. To identify more effective biomarkers of prognosis in GC, we analyzed the gene expression profiles (GSE118916, GSE79973, and GSE19826) of 37 paired GC and adjacent normal tissues from the GEO public database. We identified 119 DEGs (21 upregulated and 98 downregulated genes) by GEO2R and Venn diagram online software. To better understand the interactions among DEGs, we further analyzed gene functional enrichment using DAVID software. Then, we constructed the PPI network via the STRING online database and Cytoscape software. Thirty hub DEGs were screened by Cytoscape MCODE. Subsequently, we conducted survival analysis using the Kaplan-Meier plotter to study the relationship between 30 hub DEGs and GC prognosis. The results showed 25 of the 30 hub DEGs were significantly associated with GC prognosis (
Type I collagen is abundant in bone, cornea, dermis, and tendon. It consists of a heterotrimer of 2 chains of collagen type I alpha 1 (COL1A1) and 1 chain of collagen type I alpha 2 (COL1A2). Studies have demonstrated that abnormal expression of COL1A1 and COL1A2 is associated with tumor invasion and progression [15,16]. COL1A2 was found to be upregulated in colorectal cancer [17] and breast cancer [18]. COL1A2 was also found to be downregulated in bladder cancer, and it was suggested that inactivation of
COL2A1 is a fibrillar collagen found in cartilage and the vitreous humor of the eye [24]. Many studies have reported that
Collagen type XI alpha 1 chain (COL11A1) was found to be upregulated in various cancers, including colorectal [27], pancreatic [28], ovarian cancer [29], and gastric cancer. COL11A1 could be used as a diagnostic indicator between premalignant and malignant lesions in the stomach [30,31]. Recently, studies have demonstrated that COL11A1 suppression in HGC-27 cells significantly inhibited proliferation, migration, and invasion in vitro. COL11A1 might be an oncogene in GC, which may regulate multiple genes responsible for cell growth and/or invasion and may be a potential therapeutic target in future investigation [32].
Thrombospondin 2 (THBS2) belongs to the thrombospondin family and mediates cell-cell and cell-matrix interactions. Studies suggest that the THBS2 protein may be involved in cell adhesion and migration and possibly function as a potential inhibitor of tumor growth and angiogenesis. The expression and prognosis of THBS2 have been investigated in breast cancer [33], ovarian cancer [34], and lung cancer. THBS2 was markedly overexpressed in a number of datasets of non-small-cell lung carcinoma, including lung adenocarcinoma. THBS2 may play a double role in the lung adenocarcinoma progression, including antiangiogenic and oncogenic functions. Overexpression of THBS2 was associated with poorer survival in lung adenocarcinoma patients [35]. THBS2 expression was remarkably related with the TNM stage, AJCC stages, and clinical outcomes (
The protein encoded by secreted phosphoprotein 1 (
Our studies demonstrated that 6 genes (
The current study has several strengths. First, different bioinformatics analysis tools were used for cross-validation and reanalysis, and they verified the study results. Second, several hub DEGs, especially collagen genes, have been reported to be significantly associated with the prognosis of GC patients in other studies, and this previous research supports our results. However, the present study also has some limitations. The online Kaplan-Meier plotter database was only used to assess the prognostic value. We did not have more information for prognosis from associated factors, such as age, sex, and treatment, and we may have missed some valuable information. In addition, our findings need to be confirmed through molecular biology studies.
Conclusions
Our studies identified 6 hub DEGs (
Figures
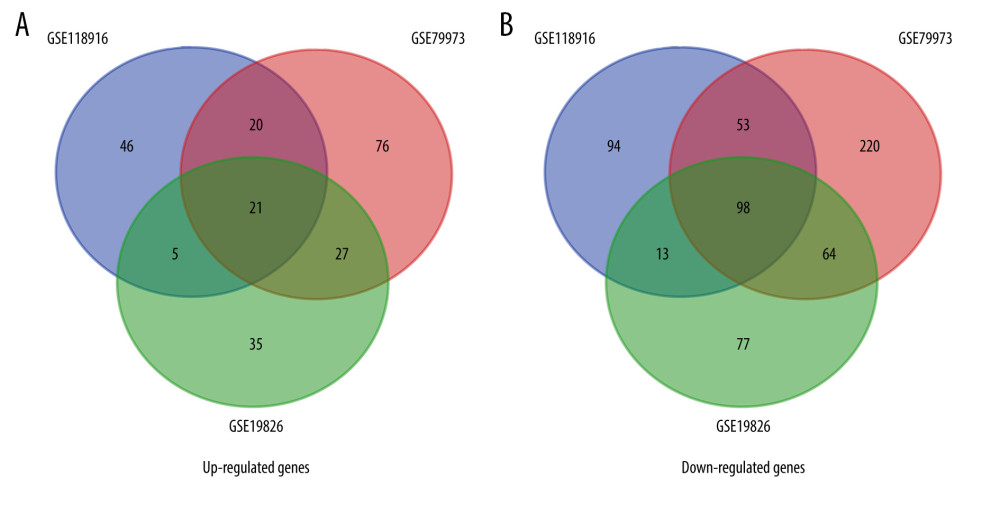 Figure 1. Venn diagrams of all screened differentially expressed genes (DEGs) identified from 3 gene expression profiles (GSE118916, GSE79973, and GSE19826). (A) Twenty-one upregulated genes. (B) Ninety-eight downregulated genes.
 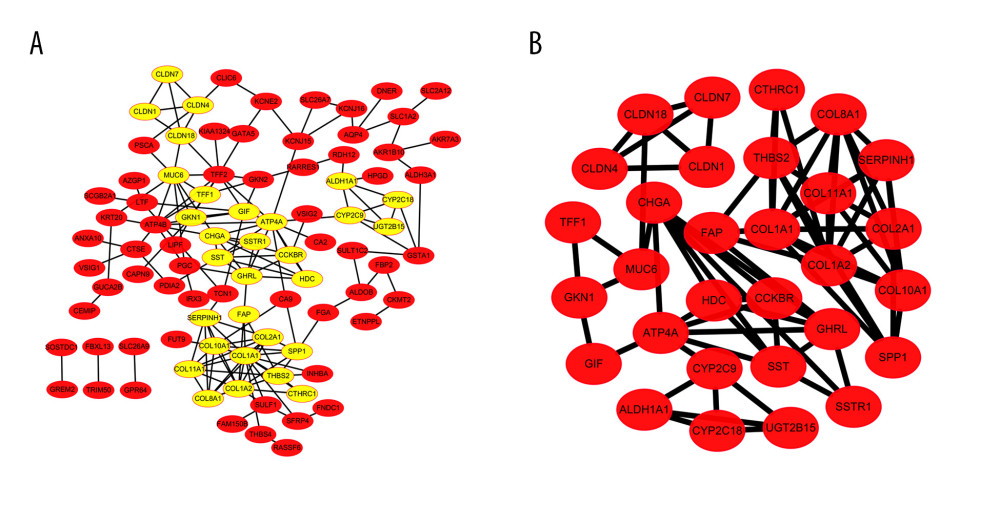 Figure 2. Differentially expressed genes (DEGs) protein–protein interaction (PPI) network analysis. (A) DEGs in PPI network complex by STRING and Cytoscape, which demonstrated 90 nodes and 162 edges and excluded 29 DEGs. (B) Module identified by Cytoscape MCODE plug-in. The nodes represent proteins; the edges represent protein interactions.
 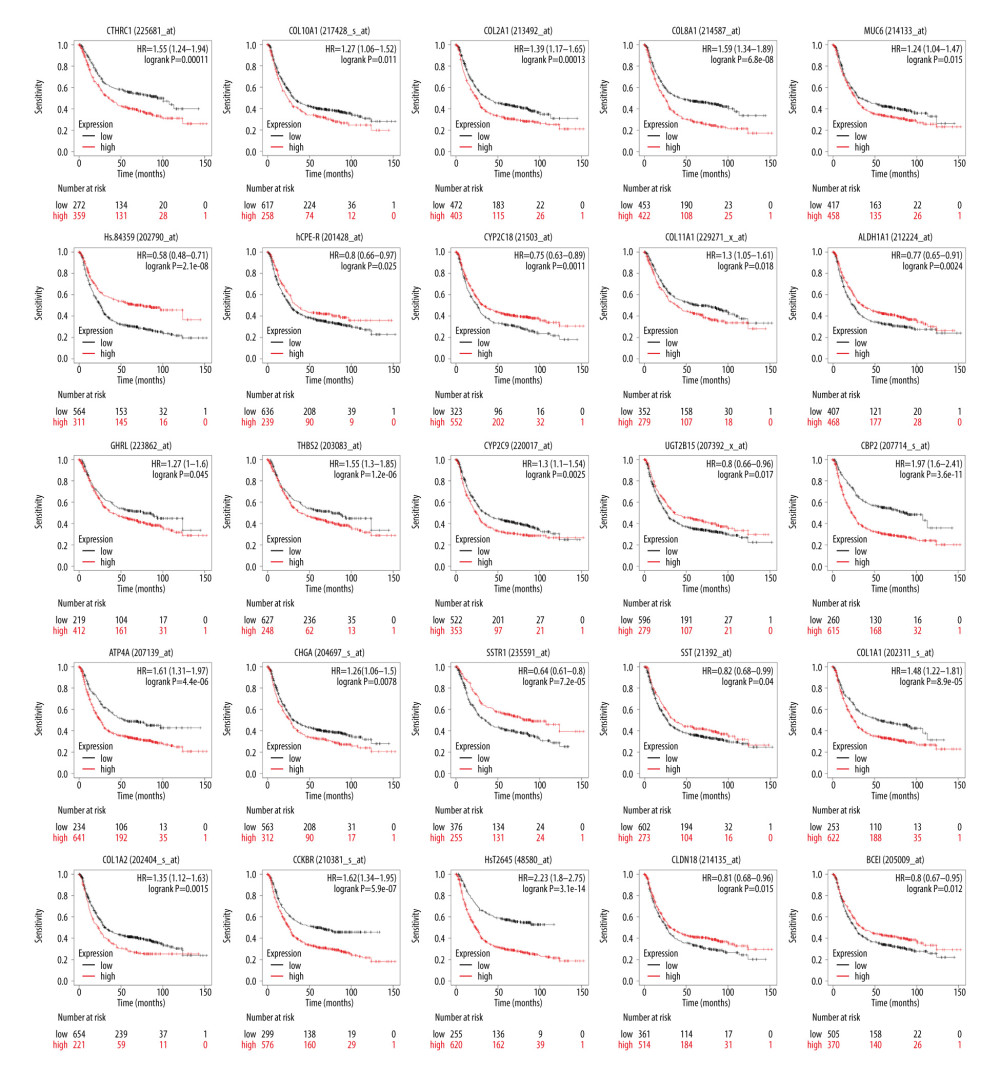 Figure 3. Overall survival analysis of 30 hub differentially expressed genes (DEGs). Twenty-five of 30 hub DEGs were significantly correlated with the survival of gastric cancer (GC) patients (P<0.05). Hs.84359 meant CLDN7; hCPE-R meant CLDN4; CBP2 meant SERPINH1; HsT2645 meant SPP1; and BCEI meant TFF1.
 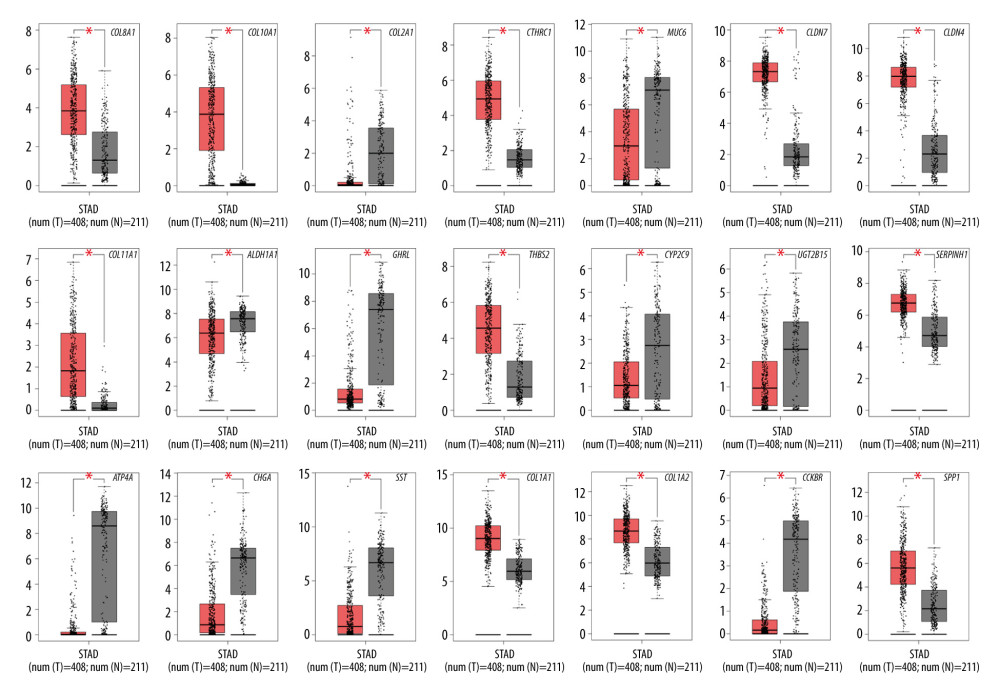 Figure 4. Validation of the expression of 25 hub differentially expressed genes (DEGs) by GEPIA website in gastric cancer (GC) tissues and normal tissues. The red box indicates tumor samples, and the gray box indicates normal samples.
 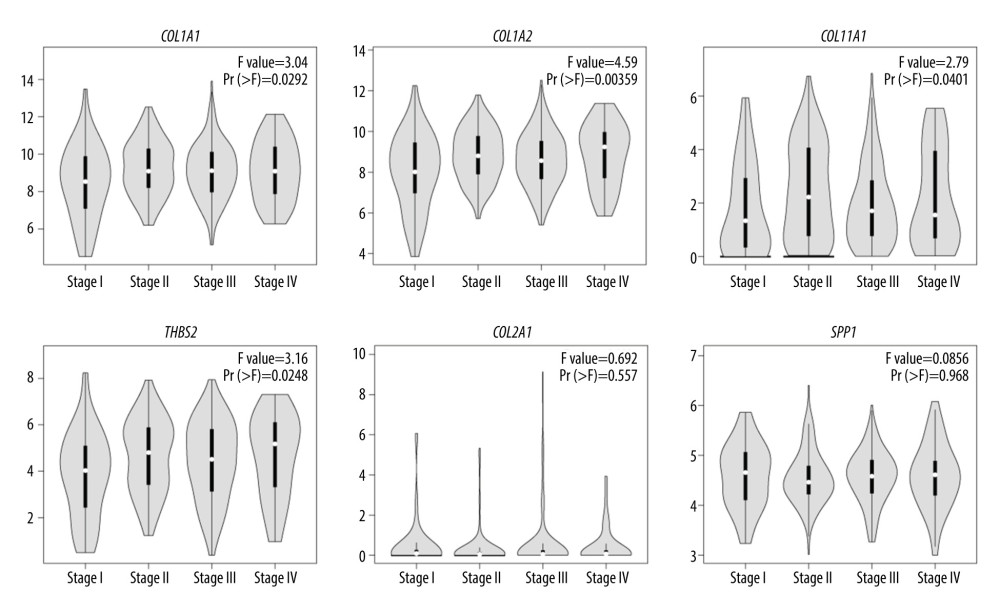 Figure 5. Pathological stage plot of gastric cancer (GC) hub differentially expressed genes (DEGs). COL1A1, COL1A2, COL11A1, and THBS2 showed significant differences, while COL2A1 and SPP1 were not significantly different at various stages.
 Tables
Table 1. All 119 commonly differentially expressed genes (DEGs; 21 upregulated and 98 downregulated genes) in 3 profile datasets between gastric cancer tissues and adjacent normal tissues.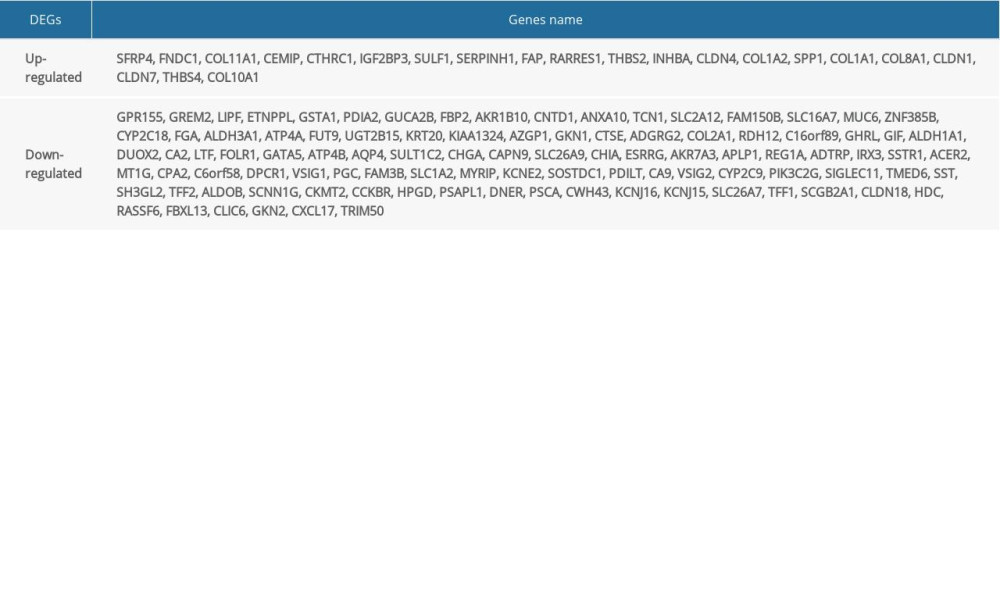 Table 2. Gene Ontology (GO) term enrichment analysis of differentially expressed genes (DEGs) in gastric cancer.
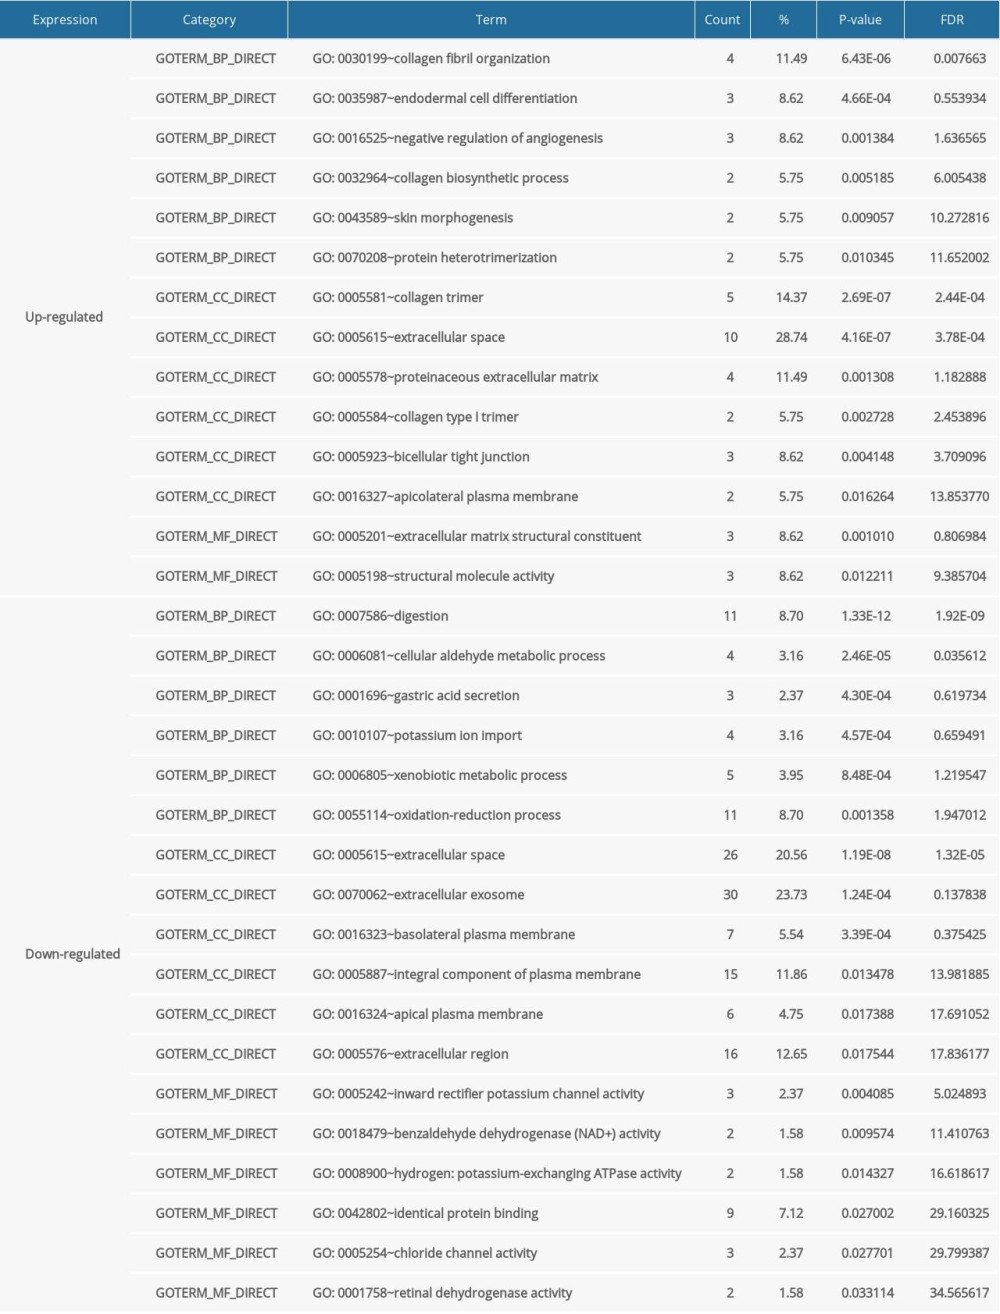 Table 3. Kyoto Encyclopedia of Genes and Genomes (KEGG) pathway analysis of differentially expressed genes (DEGs) in gastric cancer.
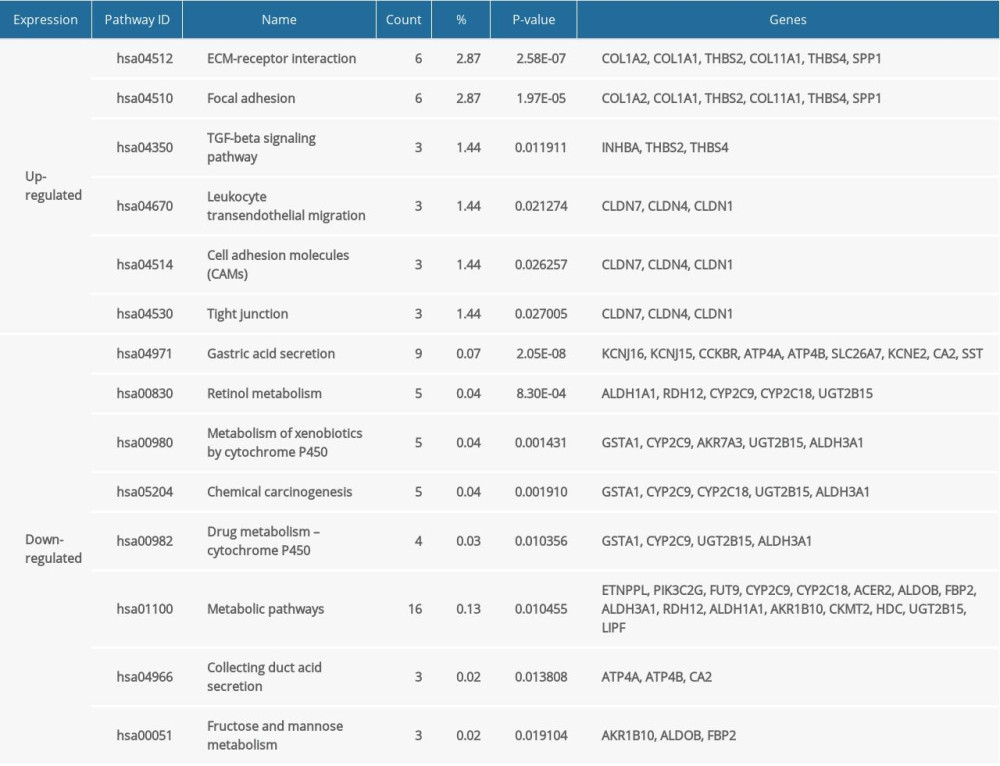 Table 4. Survival analysis of the 30 hub differentially expressed genes (DEGs). Twenty-five hub DEGs were significantly correlated with the survival of patients with gastric cancer (P<0.05) while 5 hub DEGs were not significant (P>0.05).
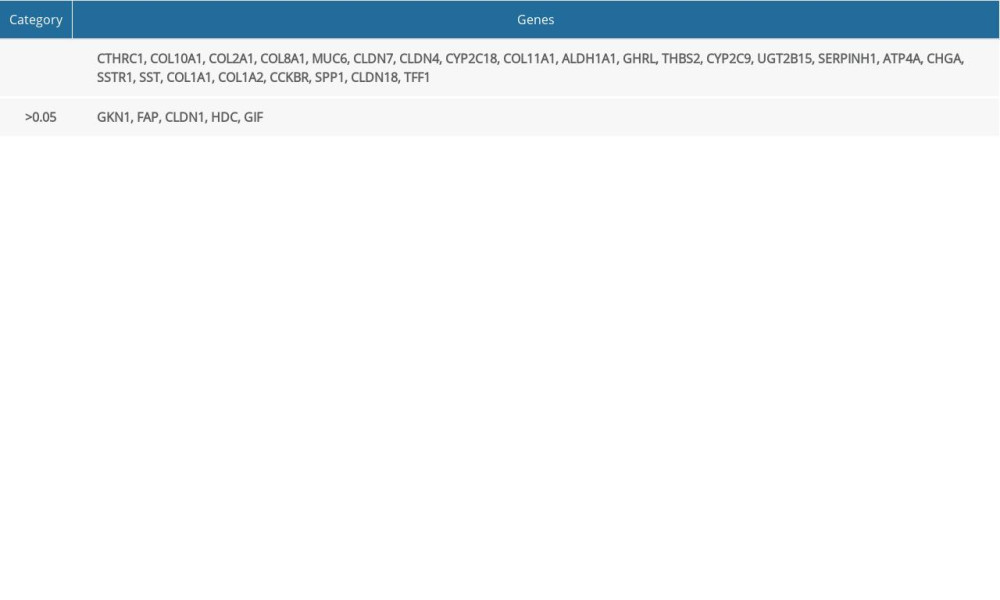 Table 5. Expression validation of 21 hub differentially expressed genes (DEGs; 11 upregulated and 10 downregulated genes).
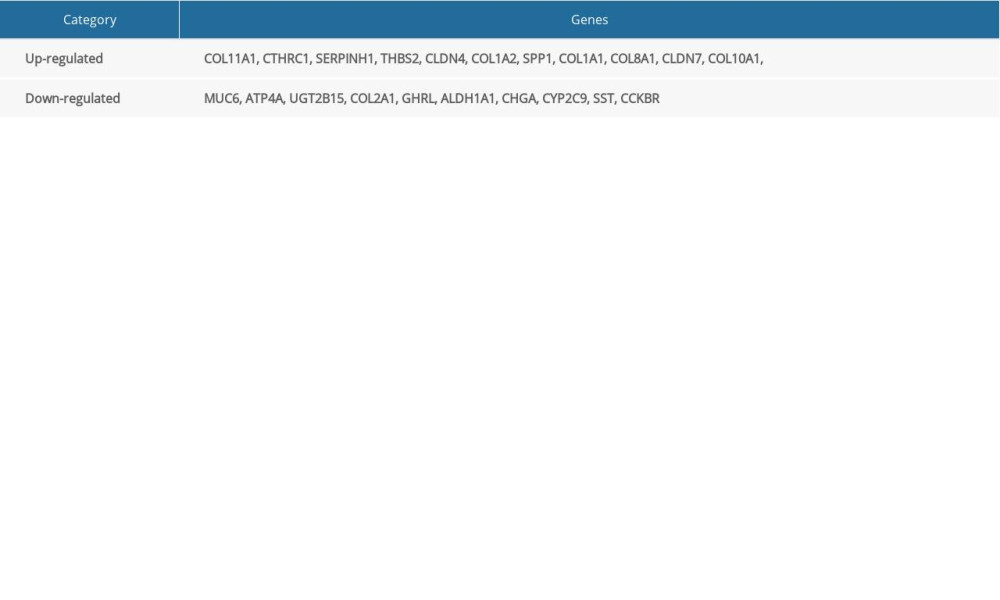 Table 6. Kyoto Encyclopedia of Genes and Genomes (KEGG) pathway reanalysis of 21 hub differentially expressed genes (DEGs).
References
1. Sitarz R, Skierucha M, Mielko J, Gastric cancer: Epidemiology, prevention, classification, and treatment: Cancer Manag Res, 2018; 10; 239-48
2. Van Cutsem E, Sagaert X, Topal B, Gastric cancer: Lancet, 2016; 388(10060); 2654-64
3. Chen W, Zheng R, Baade PD, Cancer statistics in China, 2015: Cancer J Clin, 2016; 66(2); 115-32
4. Li L, Zhu Z, Zhao Y, FN1, SPARC, and SERPINE1 are highly expressed and significantly related to a poor prognosis of gastric adenocarcinoma revealed by microarray and bioinformatics: Sci Rep, 2019; 9(1); 7827
5. Jin Y, He J, Du J, Overexpression of HS6ST2 is associated with poor prognosis in patients with gastric cancer: Oncol Lett, 2017; 14(5); 6191-97
6. He J, Jin Y, Chen Y, Downregulation of ALDOB is associated with poor prognosis of patients with gastric cancer: Onco Targets Ther, 2016; 9; 6099-109
7. Wang Q, Wen Y-G, Li D-P, Upregulated INHBA expression is associated with poor survival in gastric cancer: Med Oncol, 2012; 29(1); 77-83
8. Washington K: Ann Surg Oncol, 2010; 17(12); 3077-79
9. Huang Da W, Sherman BT, Lempicki RA, Systematic and integrative analysis of large gene lists using DAVID bioinformatics resources: Nat Protoc, 2009; 4(1); 44-57
10. Kanehisa M, Goto S, KEGG: Kyoto Encyclopedia of Genes and Genomes: Nucleic Acids Res, 2000; 28(1); 27-30
11. Szklarczyk D, Franceschini A, Wyder S, STRING v10: Protein-protein interaction networks, integrated over the tree of life: Nucleic Acids Res, 2015; 43; D447-52
12. Shannon P, Markiel A, Ozier O, Cytoscape: A software environment for integrated models of biomolecular interaction networks: Genome Res, 2003; 13(11); 2498-504
13. Szász AM, Lánczky A, Nagy Á, Cross-validation of survival associated biomarkers in gastric cancer using transcriptomic data of 1,065 patients: Oncotarget, 2016; 7(31); 49322-33
14. Tang Z, Li C, Kang B, GEPIA. A web server for cancer and normal gene expression profiling and interactive analyses: Nucleic Acids Res, 2017; 45(W1); W98-102
15. Lin P, Tian P, Pang J, Clinical significance of COL1A1 and COL1A2 expression levels in hypopharyngeal squamous cell carcinoma: Oncol Lett, 2020; 20(1); 803-9
16. Mori K, Enokida H, Kagara I, CpG hypermethylation of collagen type I alpha 2 contributes to proliferation and migration activity of human bladder cancer: Int J Clin Oncol, 2009; 34(6); 1593-602
17. Zou X, Feng B, Dong T, Up-regulation of type I collagen during tumorigenesis of colorectal cancer revealed by quantitative proteomic analysis: J Proteomics, 2013; 94; 473-85
18. Lin J, Goldstein L, Nesbit A, Influence of hormone receptor status on spinal metastatic lesions in patients with breast cancer: World Neurosurg, 2016; 85; 42-48
19. Zhuo C, Li X, Zhuang H, Elevated THBS2, COL1A2, and SPP1 expression levels as predictors of gastric cancer prognosis: Cell Physiol Biochem, 2016; 40(6); 1316-24
20. Wang J, Gao P, Song Y, Prognostic value of gastric cancer-associated gene signatures: Evidence based on a meta-analysis using integrated bioinformatics methods: J Cell Mol Med, 2018; 22(11); 5743-47
21. Li M, Wang J, Wang C, Microenvironment remodeled by tumor and stromal cells elevates fibroblast-derived COL1A1 and facilitates ovarian cancer metastasis: Exp Cell Res, 2020; 394(1); 112153
22. Zhu Y, Shi L, Chen P, Identification of six candidate genes for endometrial carcinoma by bioinformatics analysis: World J Surg Oncol, 2020; 18(1); 161
23. Hayashi M, Nomoto S, Hishida M, Identification of the collagen type 1 α 1 gene (COL1A1) as a candidate survival-related factor associated with hepatocellular carcinoma: BMC Cancer, 2014; 14; 108
24. Cheah KS, Stoker NG, Griffin JR, Identification and characterization of the human type II collagen gene (COL2A1): Proc Natl Acad Sci USA, 1985; 82(9); 2555-59
25. Okazaki S, Meguro A, Ideta R: Mol Vis, 2019; 25; 843-50
26. Go SL, Maugeri A, Mulder JJ, Autosomal dominant rhegmatogenous retinal detachment associated with an Arg453Ter mutation in the COL2A1 gene: Invest Ophthalmol Vis Sci, 2003; 44(9); 4035-43
27. Fischer H, Stenling R, Rubio C, Lindblom A, Colorectal carcinogenesis is associated with stromal expression of COL11A1 and COL5A2: Carcinogenesis, 2001; 22(6); 875-78
28. Badea L, Herlea V, Dima SO, Combined gene expression analysis of whole-tissue and microdissected pancreatic ductal adenocarcinoma identifies genes specifically overexpressed in tumor epithelia: Hepatogastroenterology, 2008; 55(88); 2016-27
29. Wu YH, Chang TH, Huang YF, COL11A1 promotes tumor progression and predicts poor clinical outcome in ovarian cancer: Oncogene, 2014; 33(26); 3432-40
30. Zhao Y, Zhou T, Li A, A potential role of collagens expression in distinguishing between premalignant and malignant lesions in stomach: Anat Rec (Hoboken), 2009; 292(5); 692-700
31. Gao X, Zhong S, Tong Y, Alteration and prognostic values of collagen gene expression in patients with gastric cancer under different treatments: Pathol Res Pract, 2020; 216(3); 152831
32. Li A, Li J, Lin J, COL11A1 is overexpressed in gastric cancer tissues and regulates proliferation, migration and invasion of HGC-27 gastric cancer cells in vitro: Oncol Rep, 2017; 37(1); 333-40
33. Perez-Rivas LG, Jerez JM, Fernandez-De Sousa CE, Serum protein levels following surgery in breast cancer patients: A protein microarray approach: Int J Clin Oncol, 2012; 41(6); 2200-6
34. Wang M, Wang J, Liu J, Systematic prediction of key genes for ovarian cancer by co-expression network analysis: J Cell Mol Med, 2020; 24(11); 6298-307
35. Weng TY, Wang CY, Hung YH, Differential expression pattern of THBS1 and THBS2 in lung cancer: Clinical outcome and a systematic-analysis of microarray databases: PLoS One, 2016; 11(8); e0161007
36. Tian Q, Liu Y, Zhang Y, THBS2 is a biomarker for AJCC stages and a strong prognostic indicator in colorectal cancer: J BUON, 2018; 23(5); 1331-36
37. Peng HY, Chang MC, Hu CM, Thrombospondin-2 is a highly specific diagnostic marker and is associated with prognosis in pancreatic cancer: Ann Surg Oncol, 2019; 26(3); 807-14
38. Li HJ, Han NN, Nan Y, Plasma osteopontin acts as a prognostic marker in acute intracerebral hemorrhage patients: Clin Chim Acta, 2020; 500; 208-12
39. Assidi M, Gomaa W, Prognostic value of osteopontin (SPP1) in colorectal carcinoma requires a personalized molecular approach: Tumour Biol, 2019; 41(9); 1010428319863627
40. Wang Y, Lu Y, Xu W, Prognostic value of osteopontin expression in esophageal squamous cell carcinoma: A meta-analysis: Pathol Res Pract, 2019; 215(10); 152571
41. Qiu J, Sun M, Wang Y, Chen B, Identification of hub genes and pathways in gastric adenocarcinoma based on bioinformatics analysis: Med Sci Monit, 2020; 26; e920261
42. Yin Y, Zhao Y, Li AQ, Si JM, Collagen: A possible prediction mark for gastric cancer: Med Hypotheses, 2009; 72(2); 163-65
Figures
 Figure 1. Venn diagrams of all screened differentially expressed genes (DEGs) identified from 3 gene expression profiles (GSE118916, GSE79973, and GSE19826). (A) Twenty-one upregulated genes. (B) Ninety-eight downregulated genes.
 Figure 2. Differentially expressed genes (DEGs) protein–protein interaction (PPI) network analysis. (A) DEGs in PPI network complex by STRING and Cytoscape, which demonstrated 90 nodes and 162 edges and excluded 29 DEGs. (B) Module identified by Cytoscape MCODE plug-in. The nodes represent proteins; the edges represent protein interactions.
 Figure 3. Overall survival analysis of 30 hub differentially expressed genes (DEGs). Twenty-five of 30 hub DEGs were significantly correlated with the survival of gastric cancer (GC) patients (P<0.05). Hs.84359 meant CLDN7; hCPE-R meant CLDN4; CBP2 meant SERPINH1; HsT2645 meant SPP1; and BCEI meant TFF1.
 Figure 4. Validation of the expression of 25 hub differentially expressed genes (DEGs) by GEPIA website in gastric cancer (GC) tissues and normal tissues. The red box indicates tumor samples, and the gray box indicates normal samples.
 Figure 5. Pathological stage plot of gastric cancer (GC) hub differentially expressed genes (DEGs). COL1A1, COL1A2, COL11A1, and THBS2 showed significant differences, while COL2A1 and SPP1 were not significantly different at various stages.
 Tables
 Table 1. All 119 commonly differentially expressed genes (DEGs; 21 upregulated and 98 downregulated genes) in 3 profile datasets between gastric cancer tissues and adjacent normal tissues.
 Table 2. Gene Ontology (GO) term enrichment analysis of differentially expressed genes (DEGs) in gastric cancer.
 Table 3. Kyoto Encyclopedia of Genes and Genomes (KEGG) pathway analysis of differentially expressed genes (DEGs) in gastric cancer.
 Table 4. Survival analysis of the 30 hub differentially expressed genes (DEGs). Twenty-five hub DEGs were significantly correlated with the survival of patients with gastric cancer (P<0.05) while 5 hub DEGs were not significant (P>0.05).
 Table 5. Expression validation of 21 hub differentially expressed genes (DEGs; 11 upregulated and 10 downregulated genes).
 Table 6. Kyoto Encyclopedia of Genes and Genomes (KEGG) pathway reanalysis of 21 hub differentially expressed genes (DEGs).
 Table 1. All 119 commonly differentially expressed genes (DEGs; 21 upregulated and 98 downregulated genes) in 3 profile datasets between gastric cancer tissues and adjacent normal tissues.
 Table 2. Gene Ontology (GO) term enrichment analysis of differentially expressed genes (DEGs) in gastric cancer.
 Table 3. Kyoto Encyclopedia of Genes and Genomes (KEGG) pathway analysis of differentially expressed genes (DEGs) in gastric cancer.
 Table 4. Survival analysis of the 30 hub differentially expressed genes (DEGs). Twenty-five hub DEGs were significantly correlated with the survival of patients with gastric cancer (P<0.05) while 5 hub DEGs were not significant (P>0.05).
 Table 5. Expression validation of 21 hub differentially expressed genes (DEGs; 11 upregulated and 10 downregulated genes).
 Table 6. Kyoto Encyclopedia of Genes and Genomes (KEGG) pathway reanalysis of 21 hub differentially expressed genes (DEGs).
 In Press
15 Apr 2024 : Laboratory Research
The Role of Copper-Induced M2 Macrophage Polarization in Protecting Cartilage Matrix in OsteoarthritisMed Sci Monit In Press; DOI: 10.12659/MSM.943738
07 Mar 2024 : Clinical Research
Knowledge of and Attitudes Toward Clinical Trials: A Questionnaire-Based Study of 179 Male Third- and Fourt...Med Sci Monit In Press; DOI: 10.12659/MSM.943468
08 Mar 2024 : Animal Research
Modification of Experimental Model of Necrotizing Enterocolitis (NEC) in Rat Pups by Single Exposure to Hyp...Med Sci Monit In Press; DOI: 10.12659/MSM.943443
18 Apr 2024 : Clinical Research
Comparative Analysis of Open and Closed Sphincterotomy for the Treatment of Chronic Anal Fissure: Safety an...Med Sci Monit In Press; DOI: 10.12659/MSM.944127
Most Viewed Current Articles
17 Jan 2024 : Review article
Vaccination Guidelines for Pregnant Women: Addressing COVID-19 and the Omicron VariantDOI :10.12659/MSM.942799
Med Sci Monit 2024; 30:e942799
14 Dec 2022 : Clinical Research
Prevalence and Variability of Allergen-Specific Immunoglobulin E in Patients with Elevated Tryptase LevelsDOI :10.12659/MSM.937990
Med Sci Monit 2022; 28:e937990
16 May 2023 : Clinical Research
Electrophysiological Testing for an Auditory Processing Disorder and Reading Performance in 54 School Stude...DOI :10.12659/MSM.940387
Med Sci Monit 2023; 29:e940387
01 Jan 2022 : Editorial
Editorial: Current Status of Oral Antiviral Drug Treatments for SARS-CoV-2 Infection in Non-Hospitalized Pa...DOI :10.12659/MSM.935952
Med Sci Monit 2022; 28:e935952


