15 July 2021: Database Analysis
Epithelial Splicing Regulatory Protein 1 Is Overexpressed in Breast Cancer and Predicts Poor Prognosis for Breast Cancer Patients
Xinyu Liu1ABCE, Qiangshan Wang2B, Siqi Song1B, Manman Feng1B, Xiaoya Wang1B, Ling Li1B, Ying Liu3ACDF, Chunying Shi1BEG*DOI: 10.12659/MSM.931102
Med Sci Monit 2021; 27:e931102
Abstract
BACKGROUND: Epithelial splicing regulatory proteins (ESRPs), including ESRP1 and ESRP2, are important proteins for alternative splicing of mRNAs and are reported to promote or inhibit the progression of some tumors. However, the effects of ESRPs in breast cancer are still unknown.
MATERIAL AND METHODS: In this study, we detected the transcriptional level and alterations of ESRP1 in patients with breast cancer based on the Oncomine, Gene Expression Profiling Interactive Analysis, Gene Expression-Based Outcome for Breast Cancer Online, and cBioPortal databases. Using immunohistochemistry and quantitative polymerase chain reaction, the expression pattern of ESRP1 in breast cancer was analyzed. Analysis of the clinicopathological characteristics and function of ESRP1 in breast cancer were actualized through the University of Alabama Cancer database and Database for Annotation, Visualization and Integrated Discovery. Using the Kaplan-Meier plotter, the prognostic values of ESRP1 in patients with breast cancer were analyzed. The Encyclopedia of RNA Interactomes database was used to predict miRNAs that regulated ESRP1.
RESULTS: We found that ESRP1 was significantly overexpressed in patients with breast cancer, compared with patients without breast cancer, and had statistically significant clinicopathological characteristics. Kaplan-Meier plotter analysis indicated that the elevated expression of ESRP1 was associated with poor prognosis in patients with breast cancer. Furthermore, hsa-miR-181c-5p was identified to be potentially involved in the regulation of ESRP1.
CONCLUSIONS: These results suggest that ESRP1 is a valuable target for the precise treatment of breast cancer and a potential biomarker for the prognosis of patients with breast cancer.
Keywords: Breast Neoplasms, Alternative Splicing, Gene Expression Profiling, Immunohistochemistry, RNA-Binding Proteins, Transcription Factors
Background
It has been reported that breast cancer (BC), a common type of cancer in women, had a worldwide incidence in 2018 of 11.6% among all cancer types, second only to lung cancer [1]. According to a report in the UK, approximately 31% of women will have BC during their lifetime [2]. BC mortality in countries of Europe and North America has declined since 1990 owing to the development of early diagnostic methods and effective cancer treatments [3]. However, BC mortality is increasing in many Asian, African, and Latin American countries and regions. BC morbidity and mortality are predicted to increase substantially in developing countries, with an estimated 55% and 58% increase, respectively, over the next 20 years [3,4]. At present, the combination of surgery, chemotherapy, and radiation therapy is still the criterion standard for the treatment of BC; however, a series of individualized treatments are being explored [5].
Currently, cancer stem cells are considered to be closely associated with the occurrence and maintenance of multiple cancers [6]. BC stem cells cause the overgrowth of tumor cells and distant metastases, which are involved in the increase in BC-related diseases, recurrence, and mortality. It was reported that the activation of BC stem cells is correlated with the upregulation of the epithelial-mesenchymal transition (EMT) in human epithelial breast cells [6]. EMT is the process of transformation of cells from an epithelial phenotype to a mesenchymal phenotype, which can cause BC epithelial cells to leave the primary niche, metastasize to distant regions, and resist chemotherapy and radiation [7–9]. During this process, epithelial splicing regulatory proteins (ESRPs) play an important role. ESRPs are considered to be epithelial-specific pre-mRNA alternative splicing factors. They are members of the heterogeneous nuclear ribonucleoproteins (hnRNP) family of RNA-binding proteins, including ESRP1 and ESRP2, which regulate splicing events associated with epithelial phenotypes [10]. The ESRP protein family regulates EMT-related activities, including cell movement, cytoskeletal dynamics, and intercellular adhesion, which involve other splicing factors [10–12]. Reports suggest that the high expression of ESRP1 can promote the progression of many cancers, including colorectal cancer [13], estrogen (ER)-positive BC [14], and ovarian cancer [15,16]. However, its homologue ESRP2 is described as a tumor suppressor in other malignancies such as prostate cancer [17].
Although the ESRP family has been shown to play important roles in many cancers, its bioinformatics analysis in BC has not been systematically explored. In this study, we systematically analyzed ESRPs based on online databases and demonstrated the expression level, clinicopathological characteristics, functional annotation, and prognostic value of ESRP1 in BC. Our report suggests that ESRP1 is a potential biomarker and precise therapeutic target for BC.
Material and Methods
ONCOMINE ANALYSIS:
The Oncomine [18] database (https://www.oncomine.org/resource/login.html) is related to cancer research and has more than 700 independent datasets, of which some data is publicly available. The Oncomine database can analyze the expression characteristics of gene families and members in different types of cancer. Therefore, we analyzed the expression characteristics of the ESRP family in various subtypes of BC. In this research, the P value was set to 1E-4 and the fold change was set to 2.
CANCER CELL LINE ENCYCLOPEDIA ANALYSIS:
The Cancer Cell Line Encyclopedia (CCLE) [19] database (https://portals.broadinstitute.org/ccle) is a public online database containing data from 947 cancer patients’ cell lines, which can be used for genomic data research, copy-number variation studies, and mutation data studies. The expression levels of ESRP1 in different cancer cell lines were detected by CCLE.
CELL CULTURE AND QUANTITATIVE POLYMERASE CHAIN REACTION DETECTION:
MCF-7 cells (human BC cells) were acquired from the Shanghai branch of the Chinese Academy of Sciences and grown in culture medium consisting of RPMI-1640 and 10% fetal bovine serum. MCF-10A cells (human normal breast epithelial tissue cells) were purchased from Shanghai Biotechnology Co., Ltd., enzyme research and grown in culture medium consisting of DMEM/F12 and 5% horse serum, 10 mg/mL insulin, 20 ng/mL EGF, 0.5 mg/mL hydrocortisone, and 100 ng/mL cholera toxin. We also bought reagents from Shanghai Biotechnology Co., Ltd., enzyme research. The cell culture conditions were 37°C and 5% carbon dioxide.
The total RNA of the MCF-7 and MCF-10A cell lines was extracted with a TRIzol™ Plus RNA Purification Kit (Invitrogen, 12183555). RNA was reverse-transcribed into cDNA using a SuperScript™ III First-Strand Synthesis SuperMix kit for reverse transcription-polymerase chain reaction (RT-PCR) (Invitrogen, 11752050). Next, real-time quantitative PCR (qPCR) was performed using a SYBR Green qPCR SuperMix-UDG kit (Invitrogen, 11733046). The primers used in qPCR for human ESRP1 (GeneBank accession No. NM--001034915) were forward 5′-CATGTACGTTGCTATCCAGGC-3′ and reverse 5′-CTCCTTAATGTCACGCACGAT-3′ (synthesized by Sangon Tech).
IMMUNOHISTOCHEMISTRY:
This research was approved by the Academic Committee of Qingdao University (QYFYWZLL 26028) and was conducted in accordance with the principles of the Declaration of Helsinki. All samples were approved for use in our research.
Immunohistochemistry samples were prepared as follows. The paraffin was removed from the 5-mm paraffin sections. Next, microwave antigen retrieval was performed following routine methods. The sections were treated with 3% H2O2 at room temperature for 10 min to inactivate endogenous enzymes and then were blocked with goat serum for 20 min at room temperature. Next, commercial rabbit polyclonal antibodies against ESRP1 (No. D164372-0025 from Sangon Biotech) were incubated at 1/100 dilution overnight at 4°C. After rinsing sections with phosphate-buffered saline (PBS), the goat anti-mouse IgG (IgG/Bio) was incubated for 30 min at 37°C. Next, after rinsing sections with PBS, streptavidin-horseradish peroxidase was incubated at 37°C for 30 min. Lastly, after rinsing sections with PBS, 3,3-diaminobenzidin was used to label the ESRP1-positive tissues for 3 min at room temperature, and hematoxylin was used to label the cell nuclei.
UNIVERSITY OF ALABAMA CANCER DATABASE ANALYSIS:
The University of Alabama Cancer (UALCAN) [20] database (http://ualcan.path.uab.edu/cgi-bin/TCGAExResultNew2.pl?genenam=ESRP1&ctype=BRCA) is a comprehensive and interactive web resource for analyzing cancer data, which can be used to analyze the expression characteristics of genes in different types of cancer and can be combined with other databases such as The Cancer Genome Atlas (TCGA) database. We used the UALCAN database to analyze the expression of ESRP1 in BC samples compared to that of normal tissue samples.
GENE EXPRESSION-BASED OUTCOME FOR BREAST CANCER ONLINE ANALYSIS:
By uploading the corresponding Affymetrix probes to the Gene Expression-Based Outcome for Breast Cancer Online (GOBO) [21] database (http://co.bmc.lu.se/gobo/gsa.pl), the transcription level of ESRP1 was analyzed. The GOBO Gene Set Analysis Tumors module allows a user to investigate the expression pattern of single genes or sets of genes across a large set of BCs analyzed by Affymetrix U133A arrays. The tumor dataset consists of 1881 samples with the following characteristics: All tumors (n=1881), ER-positive tumors (n=1225), ER-negative (n=395), untreated tumors (n=927), and tumor-associated macrophages-treated tumors (n=326).
SEARCH TOOL FOR THE RETRIEVAL OF INTERACTING GENES/PROTEINS DATABASE ANALYSIS:
The Search Tool for the Retrieval of Interacting Genes/Proteins (STRING) [22] database (https://string-db.org/cgi/network?taskId=bBFI2KUwm2K4&sessionId=bCWnxnWN8ki0) can research for known and predicted protein networks and analyze the indirect or direct effects of protein-protein interactions. The STRING database was used to construct a text-mining gene network related to ESRP1.
SURVIVAL ANALYSIS:
The Kaplan-Meier plotter [23] (https://kmplot.com/analysis/) can assess the effects of 54 000 genes on the survival rate of 21 cancer types, and its primary objective is to accomplish the discovery and validation of surviving biomarkers based on meta-analysis. We used this tool to analyze the role of ESRP1 in BC and the impact of ESRP1 on patient survival.
GENE EXPRESSION PROFILING INTERACTIVE ANALYSIS:
The Gene Expression Profiling Interactive Analysis (GEPIA) [24] database (GEPIA, http://gepia.cancer-pku.cn/detail.php?gene=ESRP1) is an interactive web server that uses standard processing pipelines to analyze the RNA sequencing expression data of many tumors and many normal samples from the TCGA and Genotype-Tissue Expression (GTEx) databases. We used GEPIA to analyze the expression level of ESRP1 in BC tissues.
GENE ONTOLOGY ENRICHMENT ANALYSIS:
The Database for Annotation, Visualization and Integrated Discovery (DAVID) [25] database (https://david.ncifcrf.gov/) is a biological information database that integrates biological data and analysis tools. Functional annotation of DAVID was used to analyze ESRP1 and text-mining genes to identify enriched biological themes, particularly Gene Ontology (GO) terms (biological processes, cellular components, and molecular functions), and visualize genes on the Kyoto Encyclopedia of Genes and Genomes (KEGG) pathway maps.
BREAST CANCER GENOME ATLAS ANALYSIS:
The Invasive Breast Carcinoma database (METABRIC, Nature 2012 & Nat Commun 2016, including 2509 samples) was selected to construct The Cancer Genome Atlas of ESRPs, based on the cBioPortal [26] database (https://www.cbioportal.org). Selected genomic profiles were as follows: mutations, putative copy-number alterations from DNAcopy, and mRNA expression (microarray) z-Scores relative to diploid samples.
ENCYCLOPEDIA OF RNA INTERACTOMES ANALYSIS:
The Encyclopedia of RNA Interactomes (ENCORI) [27] database (http://starbase.sysu.edu.cn/index.php) can analyze many interaction relationships, including miRNA-mRNA, miRNA-ncRNA, miRNA-mRNA, ncRNA-RNA, RNA-RNA, Rbiological process-ncRNA, and Rbiological process-mRNA interactions from CLIP-seq, degradome-seq, and RNA-RNA interactome data. In our study, ENCORI was used to predict miRNAs that regulated ESRP1 and showed the expression level of miRNAs. The options used in this study were as follows: CLIP data: medium stringency (≥3); Degradome data: with or without data; Pan-Cancer: 1 cancer type.
STATISTICAL ANALYSIS:
The comparison of mRNA expression of the ESRP family between BC and normal samples was detected using the
Results
TRANSCRIPTION LEVELS OF ESRPS IN BC:
To date, 2 members of the ESRP family (ESRP1 and ESRP2) have been reported in different types of cancer. However, little is known about the role of ESRP1 and ESRP2 in BC. To detect whether the ESRP family is involved in the progression of BC, the Oncomine database was used to compare the expression of ESRP1 and ESRP2 of BC samples and normal samples. A total of 369 unique analyses of ESRP1 and 386 unique analyses of ESRP2 were included in the Oncomine database (Figure 1A). Oncomine analysis showed that the mRNA expression level of ESRP1, but not that of ESRP2, was significantly elevated in 9 different BC datasets among different types of cancer. The mRNA expression level of ESRP1 in patients with BC was significantly upregulated in 9 datasets. Ma et al [28] reported that the mRNA expression level of ESRP1 was overexpressed in invasive ductal breast carcinoma and ductal breast carcinoma in situ epithelia (Figure 1B). The TCGA data (Table 1) showed that ESRP1 expression was significantly upregulated in intraductal cribriform breast adenocarcinoma, mixed lobular and ductal breast carcinoma, invasive lobular breast carcinoma, invasive breast carcinoma, and invasive ductal breast carcinoma (Figure 1C). Richardson et al [29] found that the mRNA expression of ESRP1 was significantly upregulated in ductal breast carcinoma (Figure 1D). In addition, Zhao et al [30] reported that the mRNA expression of ESRP1 was significantly upregulated in invasive ductal breast carcinoma (Figure 1E). However, the mRNA expression level of ESRP2 was not significantly elevated in BC (Figure 1F).
UPREGULATION OF ESRP1 EXPRESSION WAS CLOSELY ASSOCIATED WITH BC:
Using the Oncomine database, a meta-analysis of ESRP1 expression in BC was performed to confirm the significantly elevated expression of ESRP1 in general cases of BC, including 770 samples from 9 datasets (Figure 2). The pooled meta-analysis demonstrated that ESRP1 mRNA levels were prominently upregulated in 9 clinical cohorts (P=1.21E-13), indicating that the upregulation of ESRP1 expression was remarkably associated with BC. To demonstrate that ESRP1 was highly expressed in BC samples compared to normal samples, the verification of cells and tissues was performed. As shown in Figure 3A, the transcription level of ESRP1 mRNA in the BC cell line was overexpressed. The mRNA expression level of ESRP1 in MCF7 cells (human BC cells) was higher than that in MCF-10A cells (human normal breast epithelial tissue cells), as observed by qPCR (Figure 3B). In the GOBO analysis based on BC cell lines, the expression of ESRP1 in the basal-A and Luminal subtypes was higher than that in the basal-B subtype of BC, and the hormone receptor (HR)-sensitive and human epidermal growth factor receptor 2 (Her-2) subtypes expressed higher levels of ESRP1 than did the triple-negative subtype (Figure 3C). Furthermore, increased expression of ESRP1 in BC tissues was observed using the GEPIA database (Figure 4A, 4B), and we performed immunohistochemistry to verify that ESRP1 expression was upregulated in BC tissues. As shown in Figure 4C, we found that ESRP1 was overexpressed in BC tissues compared to normal tissues.
ANALYSIS OF ESRP1 EXPRESSION PATTERN IN BC PATIENTS WITH DIFFERENT CLINICAL CHARACTERISTICS:
Because the expression level of ESRP1 was significantly upregulated in BC, the UALCAN database was used to analyze the extent of ESRP1 expression patterns in patients with BC with different clinical characteristics.
As shown in Figure 5A-5E, we found that ESRP1 expression was significantly different based on age, sex, menopause status, race and lymph node metastasis status. Moreover, the mRNA expression levels of ESRP1 increased significantly among all stages of BC compared to those of normal samples, indicating that ESRP1 might play a crucial role in the occurrence and progression of BC (Figure 5F). As shown in Figure 5G, a significantly high expression of ESRP1 was observed in different subtypes of BC, such as Luminal, Her-2-positive, and triple-negative subtypes. In addition, ESRP1 expression was significantly elevated in TP53 mutation status and TP53 nonmutation status (Figure 5H).
HIGH EXPRESSION OF ESRP1 WAS CLOSELY CORRELATED TO POOR PROGNOSIS IN BC PATIENTS:
We further evaluated the prognostic value of ESRP1 in BC. High expression of ESRP1 mRNA was found to be significantly related to shorter relapse-free survival in all patients with BC (HR=1.73, P=4.4e-12) (Figure 6A). In particular, the analysis of different BC subtypes showed that the high expression of ESRP1 mRNA was significantly correlated with ER-positive (HR=1.57, P=0.0024) (Figure 6B), basal (HR=1.75, P=0.00076) (Figure 6D), Luminal A (HR=1.47, 0.0024) (Figure 6E), Luminal B (HR=1.38, P=0.04) (Figure 6F), and positive lymph node status (HR=1.44, P=0.004) (Figure 6G) subtypes of BC as well as with Her-2-negative (HR=1.85, P=6.2e-05) (Figure 6H). However, overexpression of ESRP1 had no significant correlation with survival of the ER-negative (HR=1.2, P=0.27) (Figure 6C) and Her-2-positive (HR=0.99, P=0.98) (Figure 6I) subtypes of BC.
THE PREDICTIVE FUNCTION AND PATHWAYS OF ESRP1 AND ITS FREQUENTLY ALTERED TEXT-MINING GENES IN PATIENTS WITH BC:
Using the cBioPortal database, the alterations of ESRP1 expression in BC were analyzed. As shown in Figure 7A, ESRP1 expression was altered in 563 (26%) of the 2173 BC samples. ESRP1 was mainly amplified and highly expressed in BC. As shown in Figure 7B, we then established a text-mining network for ESRP1, and the 40 most frequently altered genes (genes without text-mining relationships) were excluded. The functions of ESRP1 and the text-mining genes related to ESRP1 were predicted by GO and KEGG analyses in DAVID. Based on the GO terms of biological process, cellular component, and molecular function, we predicted the potential functions of target genes using GO enrichment analysis. We found that GO: 0006397 (mRNA processing), GO: 0008380 (RNA splicing), GO: 0008543 (fibroblast growth factor receptor signaling pathway), GO: 0043484 (regulation of RNA splicing), GO: 0043518 (negative regulation of DNA damage response, signal transduction by p53 class mediator), GO: 0000380 (alternative mRNA splicing, via spliceosome), GO: 0045944 (positive regulation of transcription from RNA polymerase II promoter), and GO: 0000398 (mRNA splicing, via spliceosome) were the biological processes significantly regulated by ESRP1 alterations in BC (Figure 8A). GO: 0005634 (nucleus), GO: 0005654 (nucleoplasm), and GO: 0005737 (cytoplasm) were the cellular components affected by changes in ESRP1 expression; and GO: 0000166 (nucleotide binding), GO: 0003723 (RNA binding), GO: 0044822 (poly A RNA binding), GO: 0003729 (mRNA binding), GO: 0003676 (nucleic acid binding), GO: 0043565 (sequence-specific DNA binding), GO: 0001227 (transcriptional repressor activity, RNA polymerase II transcription regulatory region sequence-specific binding), GO: 0003714 (transcription corepressor activity), GO: 0044212 (transcription regulatory region DNA binding), and GO: 0005515 (protein binding) were the molecular functions that were significantly controlled by ESRP1 alterations (Figure 8B, 8C).
KEGG analysis defined the pathways associated with the altered function of ESRP1 and frequently altered text-mining genes. KEGG analysis revealed 2 pathways related to the altered function of ESRP1 in BC (Figure 8D), including microRNAs in cancer and adherens junction pathways involved in the tumorigenesis and pathogenesis of BC (Figure 9).
IDENTIFICATION OF REGULATORY MIRNA AND THEIR EFFECTS ON PROGNOSIS IN BC:
A total of 60 miRNAs were predicted by the ENCORI platform to regulate ESRP1 (Table 2). Among them, 31 miRNA-ESRP1 pairs were negatively correlated. However, only 1 miRNA-ESRP1 pair predicted good prognosis for patients with BC. As shown in Figure 10A, the high expression of hsa-miR-181c-5p was closely associated with longer overall survival in BC. Collectively, hsa-miR-181c-5p may exert its anti-tumor function in BC by targeting ESRP1 in BC (Figure 10B), indicating the great potential of the hsa-miR-181c-5p-ESRP1 axis as a prognostic biomarker and therapeutic target of BC.
Discussion
BC is one of the most common cancers in women [31]. At present, personalized treatment of BC is being highly recommended in clinical practice. Both ER and Her-2 have been identified as therapeutic targets for BC, and numerous patients with BC have received targeted therapy and recovered from the disease [32–35]. However, the problem is that ER and Her-2 are currently the only identified biomarkers for clinical treatment [34,35]. For the treatment of BC and its various subtypes, the exploration of other valuable biomarkers is urgently needed. Fortunately, biomedical researchers have established different bioinformatics databases, such as Oncomine [36] and TCGA [37], and a series of potential biomarkers were predicted and identified as valuable therapeutic targets [38].
Recently, it has been reported that ESRP1 can promote tumor progression in cancers including colorectal cancer [14], ER-positive BC [15], and ovarian cancer [16,17]. However, ESRP2 can exert a tumor suppressive effect. For example, Mizutani et al demonstrated that ESRP2 inhibited the progression of clear cell renal cell carcinoma through the Arkadia-ESRP2 axis [39]. Our research showed that ESRP1 expression was significantly overexpressed in BC compared to in normal samples, which suggested the specific role of ESRP1 in BC, but not that of ESRP2. It has been reported that the occurrence of BC involves the activation of BC stem cells [40–43], which regulate EMT in human epithelial breast cells through the Ras-MAPK pathway [6]. Interestingly, ESRPs play important roles in EMT. The GEPIA database and immunohistochemistry analysis demonstrated that the ESRP1 mRNA expression level was significantly upregulated in BC. By grouping patients by clinicopathological characteristics, we further studied the expression patterns of ESRP1 in patients with BC and observed that the mRNA expression of ESRP1 was significantly upregulated in patients with BC by stage, sex, age, race, menopause status, subtypes, nodal metastasis status, and TP53 mutant.
Survival analysis indicated the prognostic value of ESRP1 in BC. Highly expressed ESRP1 was associated with poor prognosis in patients with BC. The research of Ishimoto et al. supports our results [44]. In patients with ER-positive, basal-like, Luminal A, Luminal B, and Her-2-negative subtypes of BC, and lymph node-positive status of BC, the high expression level of ESRP1 was related to poor prognosis, suggesting that ESRP1 might be a potential target for diagnosis and treatment in these BC subtypes. However, the meaningful roles of ESRP1 in ER-negative and Her-2-positive BC subtypes were not predicted.
We found that ESRP1 was mainly amplified and overexpressed in BC. To explore the mechanism of ESRP1 in BC, we constructed a gene text-mining network and performed GO enrichment analysis to find possible target proteins that interacted with ESRP1. MicroRNAs in cancer indicated that alterations of ESRP1 regulated CD44 to play an important role in BC. The basic mechanism for achieving functional genomic diversity is alternative RNA splicing, and the dysregulation of alternative splicing is increasingly involved in various human diseases, especially in cancer progression and survival [45–48]. Alternative splicing plays an extremely important role in EMT [49,50]. It has been reported that EMT is abnormally activated in cancer cells to mediate tumor recurrence and distant metastasis [51,52]. Alternative splicing of CD44 can lead to EMT and BC metastasis [9,49,53,54], and the regulatory mechanism of CD44 alternative splicing is related to 2 splicing factors, including heterologous ribonucleoprotein M (hnRNPM) and ESRP1, of which, hnRNPM is widely expressed and functions in a mesenchymal cell state-specific manner to adjust CD44 alternative splicing. This function of hnRNPM is regulated by competition with ESRP1, which is expressed in epithelial tissues but not in mesenchymal tissues [10,12,55]. ESRP1 and hnRNPM and have common guanine-uridine binding sites [8,56], and the activity of hnRNPM is inhibited by ESRP1 binding to the same guanine-uridine-rich cis-elements near CD44 variable exons [41]. It has been reported that the expression of ESRP1 leads to increased expression of CD44V isoforms. In addition, CD44V interacts with the xCT subunit of the glutamate-cystine transporter and makes it more stable, which results in the increased uptake of cysteine and the synthesis of glutathione [57]. Moreover, glutathione is considered as an antioxidant and confers the ability of resisting reactive oxygen species on cells. Therefore, the expression of ESRP1 increases the content of glutathione, which contributes to strengthening the proliferation of cancer cells [34].
It has been reported that microRNA expression is related to tumor occurrence, development, and treatment, indicating that these macromolecules may become potential diagnostic, prognostic, and predictive biomarkers [58]. We identified miRNAs that could negatively regulate ESRP1 by bioinformatics methods, thereby establishing that the miRNA-ESRP1 regulatory network may be a potentially prognostic biomarker and therapeutic target in BC.
Conclusions
In this study, we systematically analyzed the expression level, clinicopathological characteristics, function, and prognostic value of ESRP1 in BC. The mRNA expression level of ESRP1, but not of ESRP2, in BC tissue samples was significantly upregulated compared to that in normal samples. In addition, we established a gene text-mining network and performed GO enrichment analysis to explore the biological process, cellular component, and molecular function. KEGG analysis defined pathways related to the altered functions of ESRP1 and frequently altered text-mining genes. Furthermore, survival analysis predicted that ESRP1 overexpression was associated with poor prognosis in patients with BC. In addition, we identified that the hsa-miR-181c-5p-ESRP1 regulatory network may be a potential prognostic biomarker and therapeutic target for patients with BC. We believe our results suggest that ESRP1 is a potential and valuable biomarker and a crucial prognostic factor in BC.
Figures
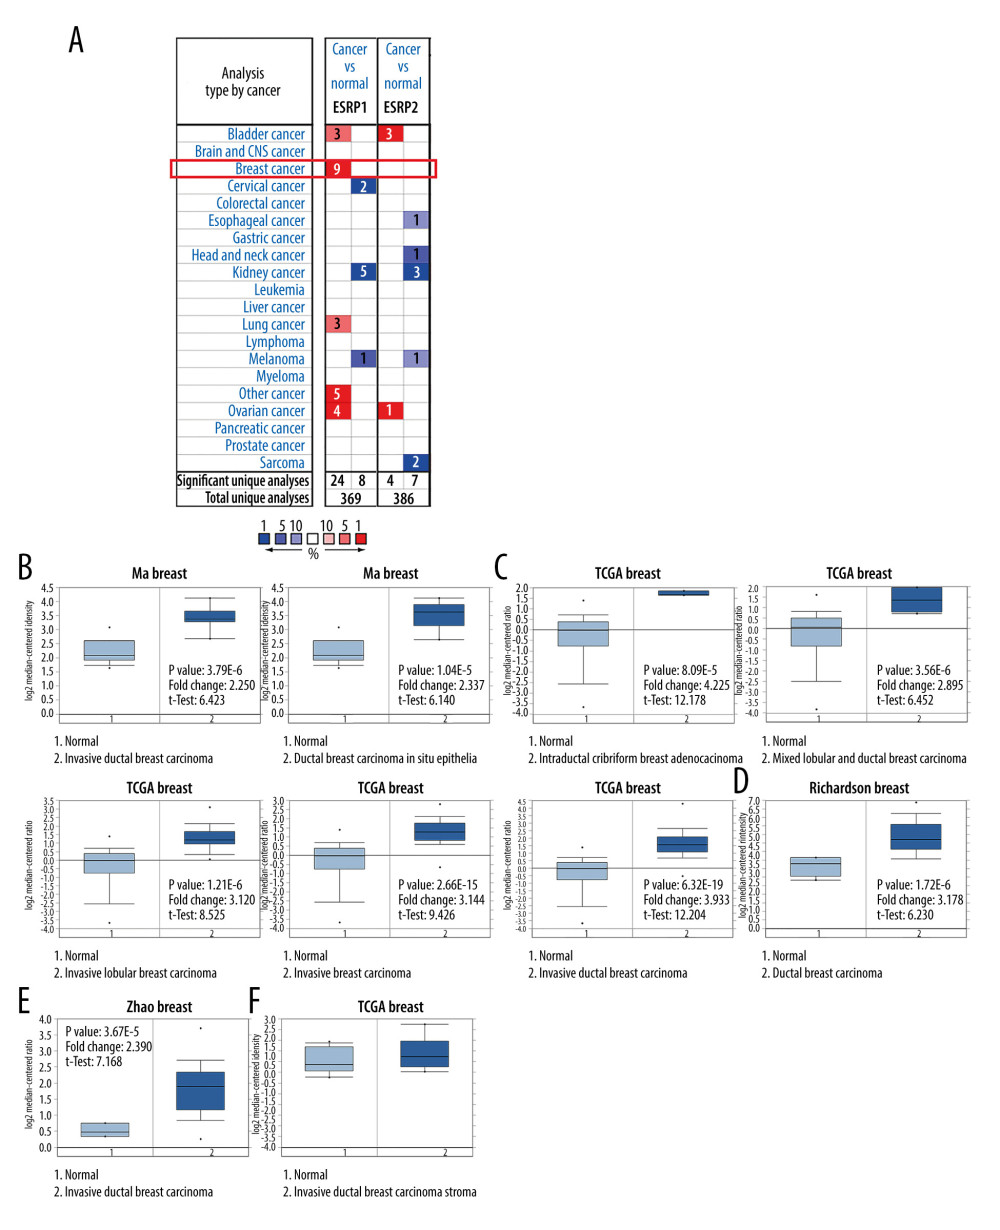 Figure 1. The mRNA expression patterns of ESRP members in different types of cancer. (A) The figure shows the mRNA expression of a statistically significant target gene compared to a normal tissue sample in different types of cancer based on the Oncomine database (https://www.oncomine.org/resource/login.html). The threshold setting: P value, 1E-4; fold change, 2. The number in each cell indicated the number of datasets that met the requirements of this type of cancer analysis. The more data, the more valuable it is. Cell color is determined by the best gene rank percentile for the analyses within the cell. Red color indicates an increased mRNA expression of the gene and blue color refers to decreased mRNA expression of the gene. The gene rank was analyzed by percentile of target gene in the top of 10% of genes measured in every research. The mRNA expression of ESRP1 in (B) Ma Breast, (C) TCGA Breast, (D) Richardson Breast, and (E) Zhao Breast. (F) The mRNA expression of ESRP2 in breast cancer.
 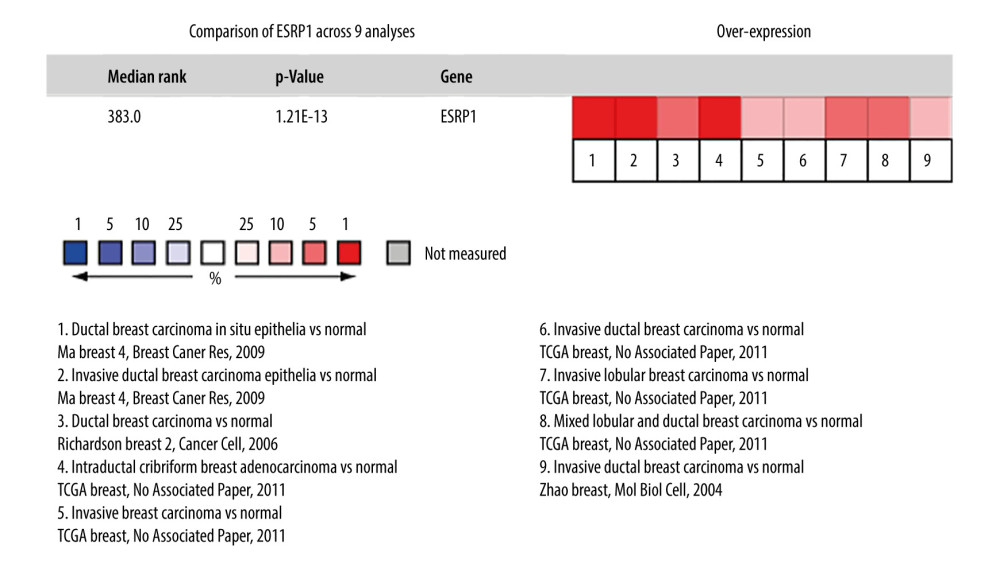 Figure 2. Meta-analysis of ESRP1 expression profile in breast cancer. The Oncomine database was used for meta-analysis of the expression profile of ESRP1 in breast cancer. The threshold setting: P value, 1E-4; fold change, 2. The rank for a gene is the median rank for that gene across each of the analyses and is presented by a different color. The intensity of the color indicates the corresponding level of ESRP1 expression compared to that of normal tissue. Red indicates an increase in the expression level of ESRP1 mRNA, whereas blue indicates a downregulation.
 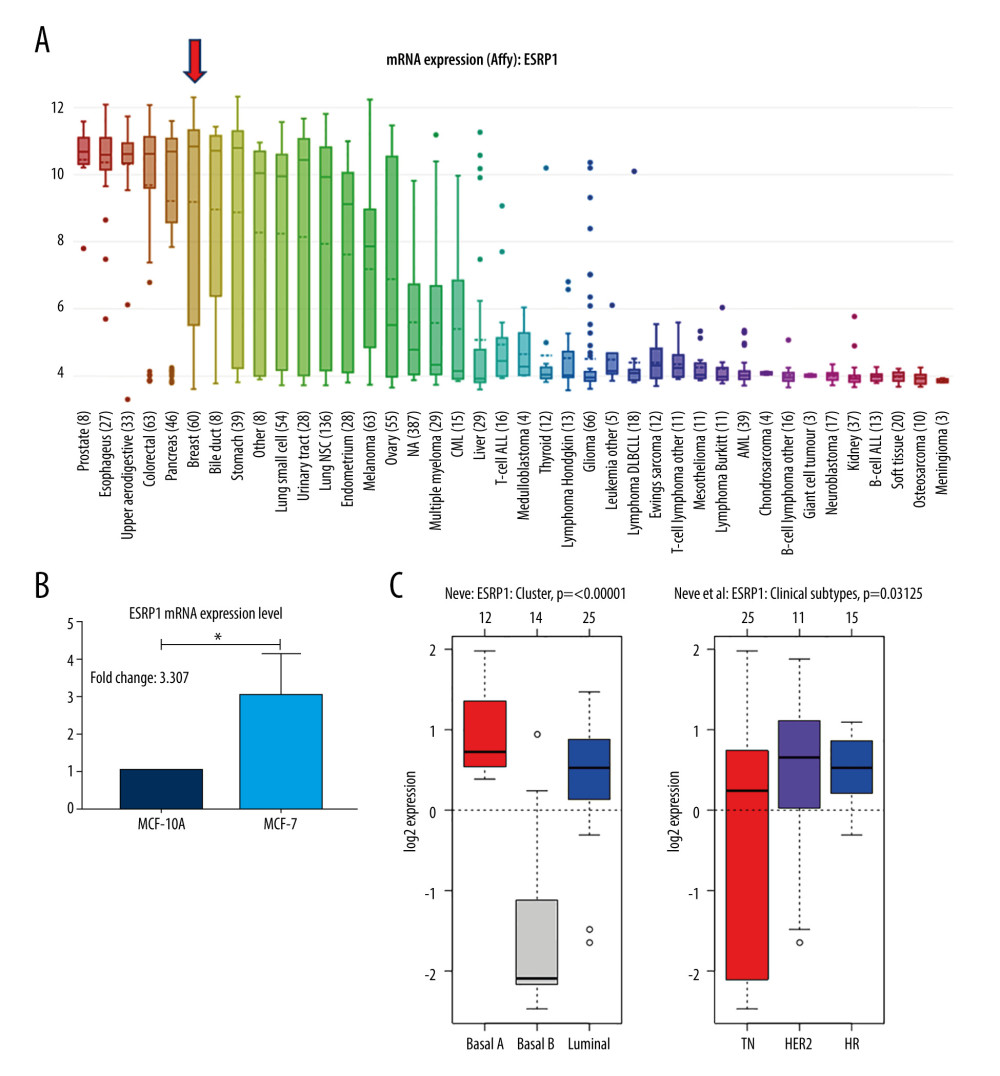 Figure 3. Analysis of ESRP1 expression in breast cancer cell lines and different molecular subtypes. (A) Analysis of mRNA expression level of ESRP1 in different types of cancer cell lines based on the Cancer Cell Line Encyclopedia (CCLE). (B) The mRNA expression level of ESRP1 in MCF-7 was higher than that in MCF-10A; * P<0.05. (C) The expression of ESRP1 in basal-like and Luminal A subtype were significantly higher than that of the Luminal B subtype of breast cancer, and the HR-sensitive subtype expressed higher level of ESRP1 than did triple-negative and Her-2 clinical subtypes (Gene Expression-Based Outcome for Breast Cancer Online, GOBO).
 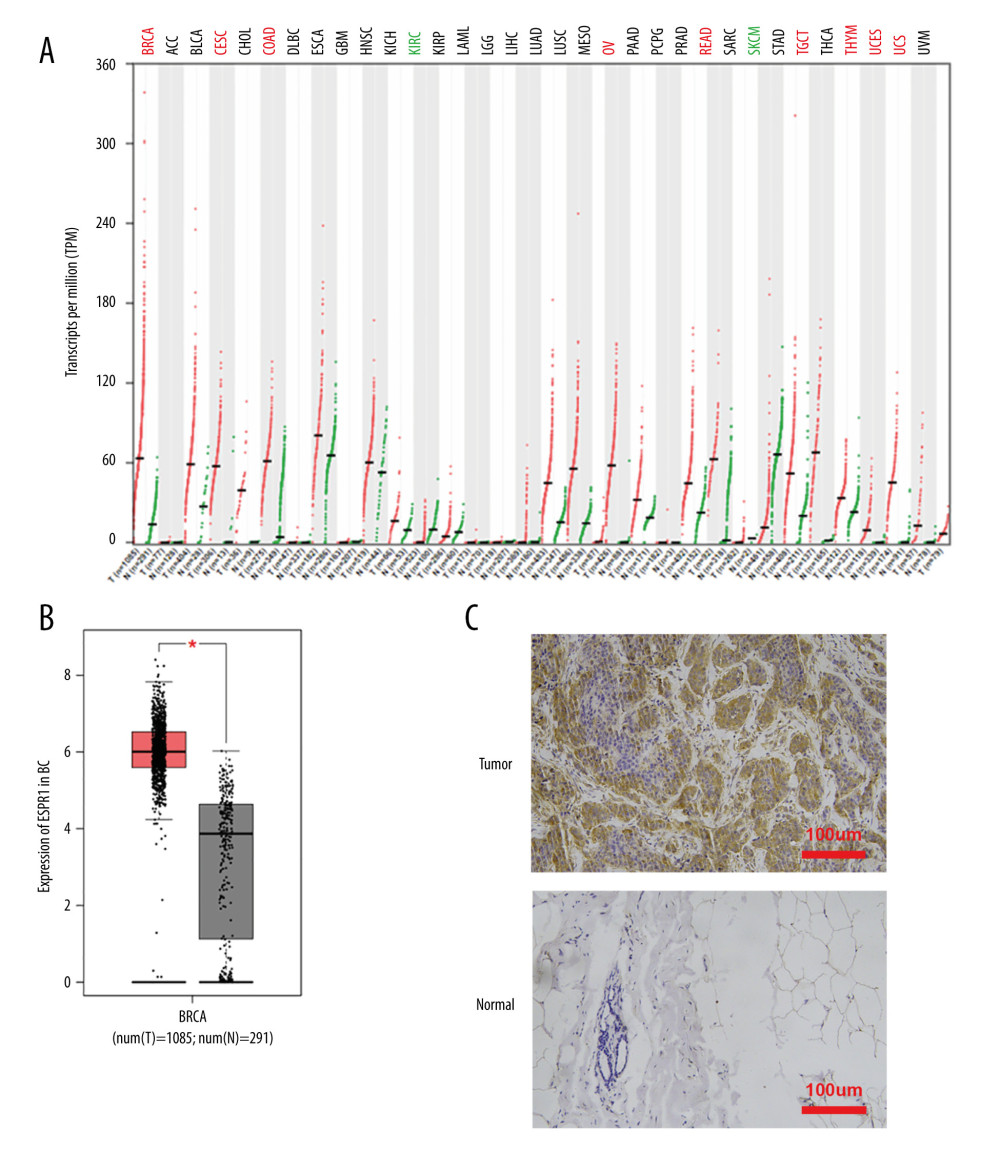 Figure 4. Analysis of ESRP1 expression in breast cancer tissue. (A) The expression profile of ESRP1 in 33 types of cancer tissues was analyzed by the Gene Expression Profiling Interactive Analysis (GEPIA) database. (B) The box plot was generated by GEPIA to show the expression of ESRP1 in breast cancer. Matched normal data: Matched The Cancer Genome Atlas (TCGA) normal and Genotype-Tissue Expression (GTEx) data. Tumor color, red; normal color, gray. * P<0.05. (C) The Expression of ESRP1 in breast cancer tissue compared to that in normal breast tissue by immunohistochemistry.
 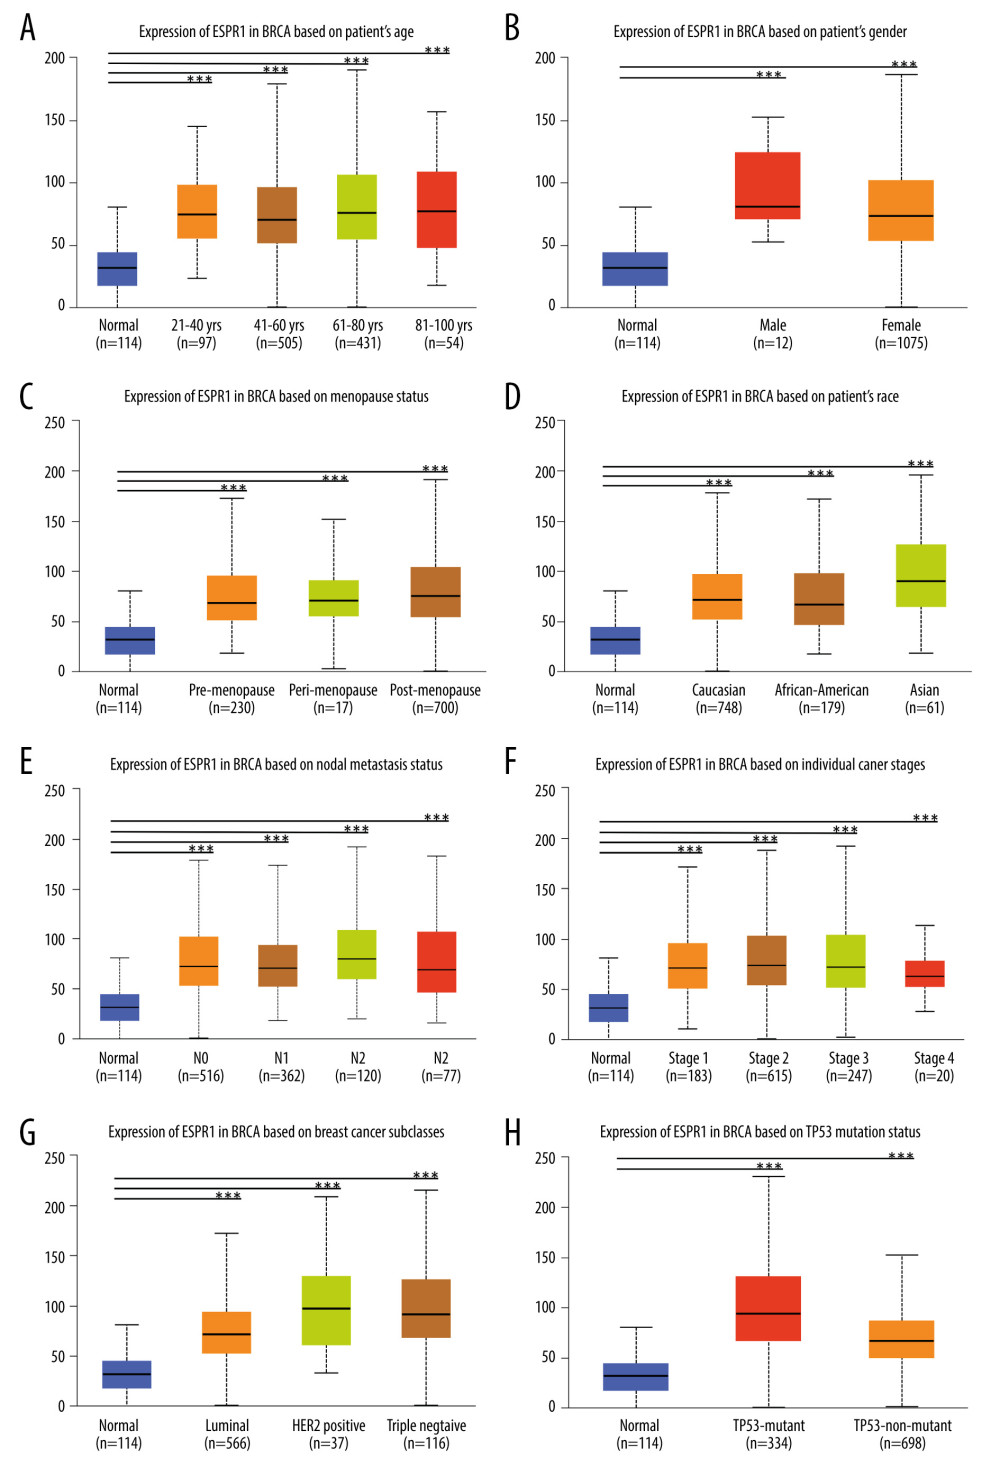 Figure 5. Association of ESRP1 expression with clinicopathological characteristics in breast cancer. University of Alabama Cancer (UALCAN) analysis showed the mRNA level of ESRP1 in breast cancer patients with distinct clinicopathological characteristics included (A) age, (B) sex, (C) menopause status, (D) race, (E) nodal metastasis status, (F) individual cancer stages, (G) subtypes, and (H) TP53 mutation status. * P<0.05, ** P<0.01, *** P<0.001.
 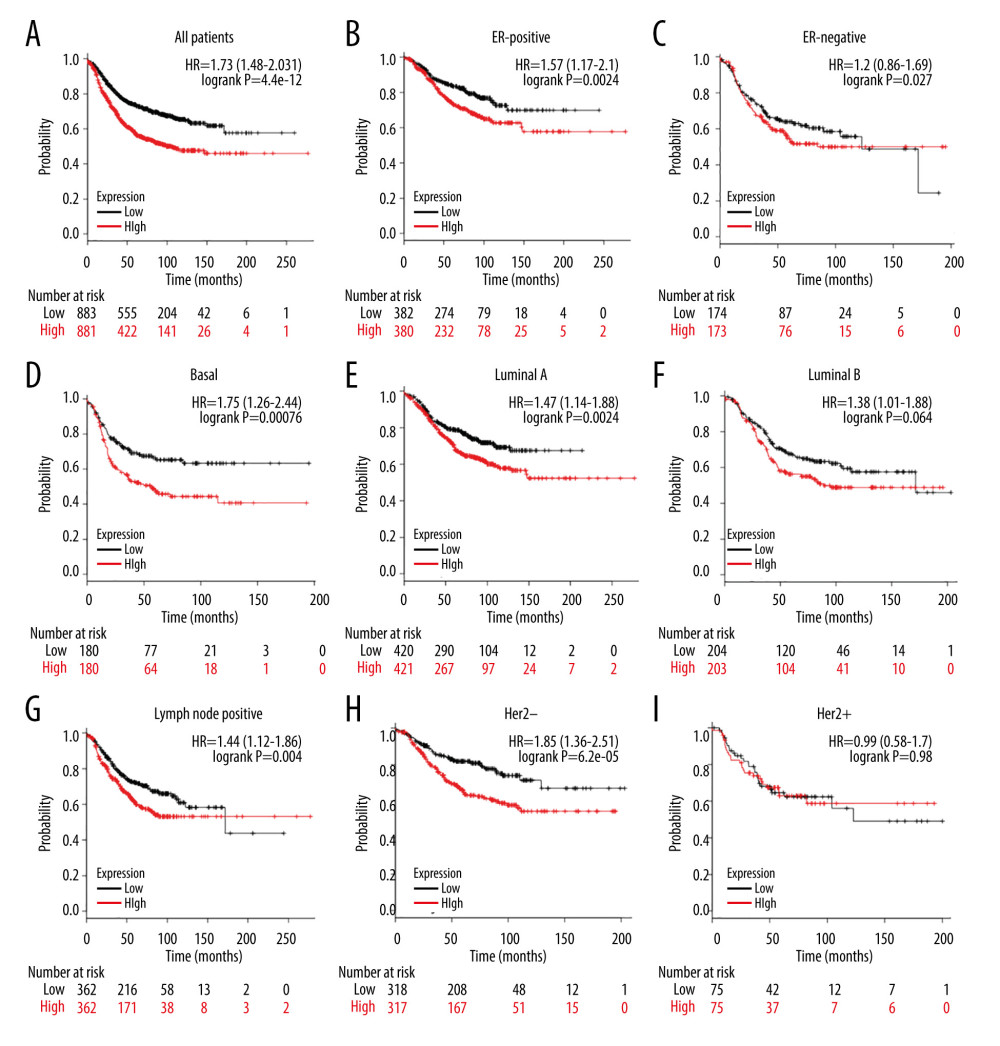 Figure 6. Analysis of ESRP1 prognostic value in breast cancer. The association of ESRP1 mRNA expression with relapse free survival was analyzed by the Kaplan-Meier plotter in (A) all patients with breast cancer, and different subtypes of BC, including (B) estrogen receptor-positive (ER-positive), (C) ER-negative, (D) basal-like, (E) Luminal A, (F) Luminal B, (G) lymph node-positive, (H) human epidermal growth factor receptor 2 (Her-2)-negative, and (I) Her-2-positive subtypes.
 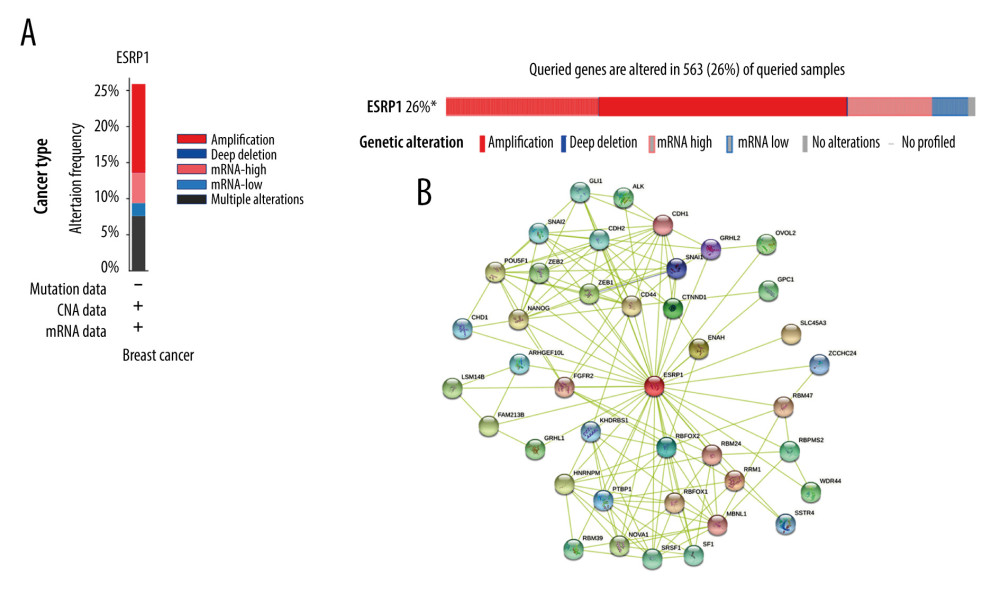 Figure 7. Alteration patterns and protein interactions of ESRP1 in breast cancer. (A) cBioPortal analysis showed the alteration patterns of ESRP1 in breast cancer. (B) The protein interaction network of ESRP1 was drawn by STRING analysis. The colored nodes in the network represent ESRP1 and its interactions.
 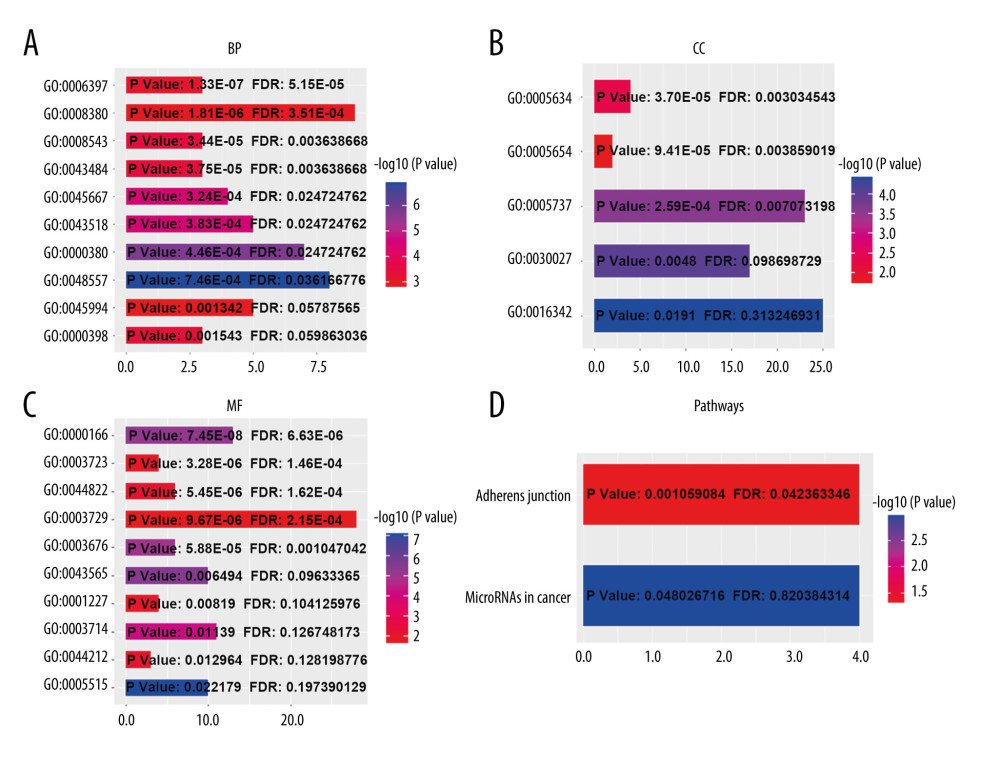 Figure 8. The functions of ESRP1 and text-mining genes significantly associated with ESRP1 alterations. The functions of ESRP1 and interaction genes significantly related to ESRP1 alterations were predicted by the analysis of Gene Ontology (GO) by Database for Annotation, Visualization and Integrated Discovery (DAVID). GO enrichment analyses were performed to predict the roles of target host genes based on 3 aspects, including (A) biological processes, (B) cellular components, and (C) molecular functions. (D) Kyoto Encyclopedia of Genes and Genomes (KEGG) analysis defined the pathways associated with the functions of ESRP1 alterations and the frequently altered interaction genes.
 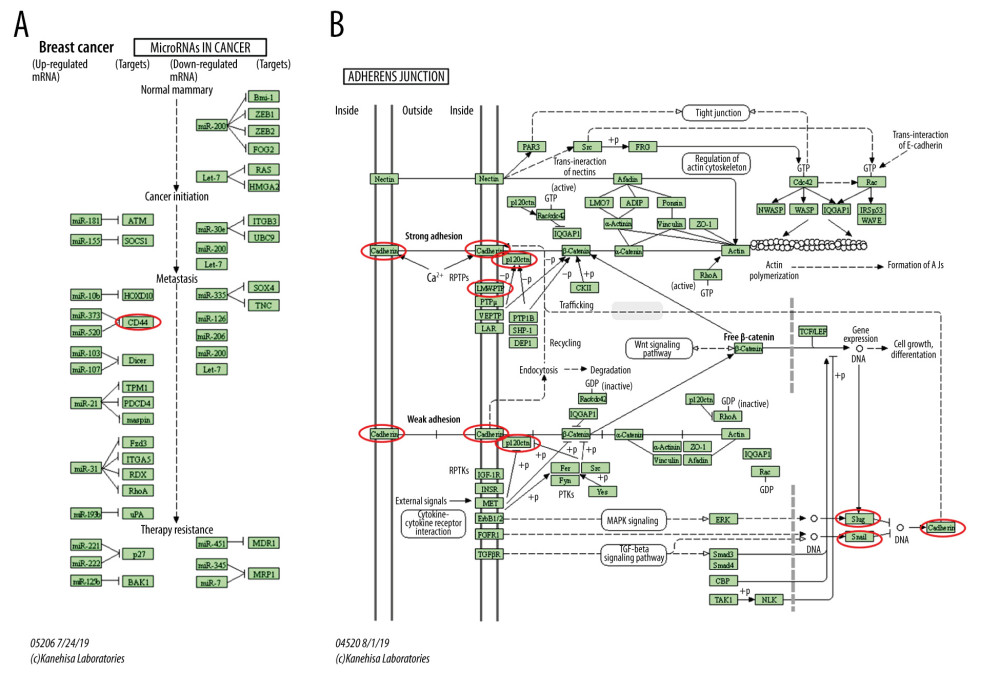 Figure 9. MicroRNAs and adherens junction regulated by ESRP1 alteration in BC. (A) microRNAs in breast cancer and (B) adherens junction pathways regulated by the ESRP1 alteration in breast cancer were analyzed by cBioPortal.
 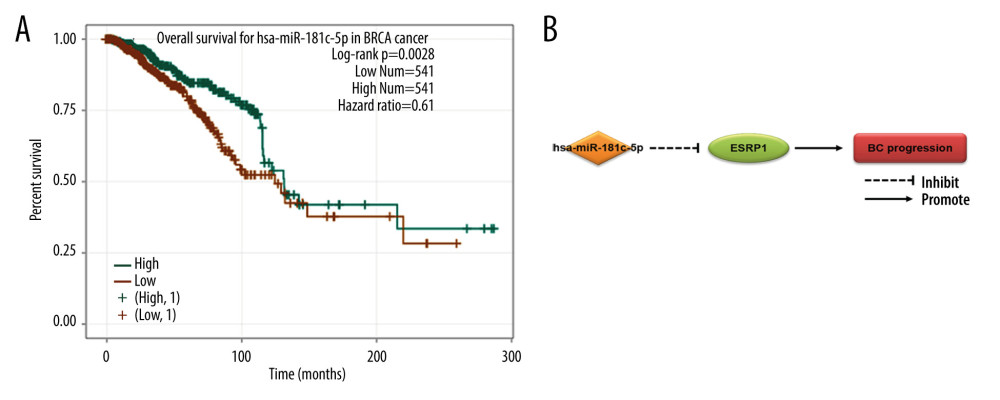 Figure 10. Effect of hsa-miR-181c-5p on prognosis of breast cancer patients and ESRP1 expression. (A) The association of hsa-miR-181c-5p with overall survival was analyzed by the Kaplan-Meier plotter in patients with breast cancer. (B) Model of hsa-miR-181c-5p-ESRP1 axis on breast cancer progression.
 References
1. Cancer Fact Sheets by International Agency for Research on Cancer (IARC) and World Health Organization (WHO) http://gco.iarc.fr/today/data/factsheets/cancers/20-Breast-fact-sheet.pdf
2. Cancer Research UK: Breast cancer incidence, 2017 http://www.cancerresearchuk.org/healthprofessional/cancer-)statistics/statistics-by-cancer-type/breast-cancer
3. Siegel RL, Miller KD, Cancer statistics 2019: Cancer J Clin, 2019; 69(1); 7-34
4. Villarreal-Garza C, Aguila C, Magallanes-Hoyos MC, Breast cancer in young women in Latin America: An unmet, growing burden: Oncologist, 2013; 18(12); 1298-306
5. Fredholm H, Eaker S, Frisell J, Breast cancer in young women: Poor survival despite intensive treatment: PLoS One, 2009; 4(11); e7695
6. Morel AP, Lièvre M, Thomas C, Generation of breast cancer stem cells through epithelial-mesenchymal transition: PLoS One, 2008; 3(8); e2888
7. Nieto MA, Huang RY, Jackson RA, Thiery JP, EMT: 2016: Cell, 2016; 166(1); 21-45
8. Brabletz T, To differentiate or not – routes towards metastasis: Nat Rev Cancer, 2012; 12(6); 425-36
9. De Craene B, Berx G, Regulatory networks defining EMT during cancer initiation and progression: Nat Rev Cancer, 2013; 13(2); 97-110
10. Warzecha CC, Sato TK, Nabet B, ESRP1 and ESRP2 are epithelial cell-type-specific regulators of FGFR2 splicing: Mol Cell, 2009; 33(5); 591-601
11. Dittmar KA, Jiang P, Park JW, Genome-wide determination of a broad ESRP-regulated posttranscriptional network by high-throughput sequencing: Mol Cell Biol, 2012; 32(8); 1468-82
12. Yang Y, Park JW, Bebee TW, Determination of a comprehensive alternative splicing regulatory network and combinatorial regulation by key factors during the epithelial-to-mesenchymal transition: Mol Cell Biol, 2016; 36(11); 1704-19
13. Fagoonee S, Picco G, Orso F, The RNA-binding protein ESRP1 promotes human colorectal cancer progression: Oncotarget, 2017; 8(6); 10007-24
14. Gökmen-Polar Y, Neelamraju Y, Goswami CP, Splicing factor ESRP1 controls ER-positive breast cancer by altering metabolic pathways: EMBO Rep, 2019; 20(2); e46078
15. Chen L, Yao Y, Sun L, Snail driving alternative splicing of CD44 by ESRP1 enhances invasion and migration in epithelial ovarian cancer: Cell Physiol Biochem, 2017; 43(6); 2489-504
16. Jeong HM, Han J, Lee SH, ESRP1 is overexpressed in ovarian cancer and promotes switching from mesenchymal to epithelial phenotype in ovarian cancer cells: Oncogenesis, 2017; 6(10); e389
17. Munkley J, Li L, Krishnan SRG, Androgen-regulated transcription of ESRP2 drives alternative splicing patterns in prostate cancer: Elife, 2019; 8; e47678
18. Rhodes DR, Kalyana-Sundaram S, Mahavisno V, Oncomine 3.0: Genes, pathways, and networks in a collection of 18,000 cancer gene expression profiles: Neoplasia, 2007; 9(2); 166-80
19. Ghandi M, Huang FW, Jané-Valbuena J, Next-generation characterization of the Cancer Cell Line Encyclopedia: Nature, 2019; 569(7757); 503-8
20. Chandrashekar DS, Bashel B, Balasubramanya SAH, UALCAN: A portal for facilitating tumor subgroup gene expression and survival analyses: Neoplasia, 2017; 19; 649-58
21. Ringnér M, Fredlund E, Häkkinen J, GOBO: Gene expression-based outcome for breast cancer online: PLoS One, 2011; 6(3); e17911
22. von Mering C, Huynen M, Jaeggi D, STRING: A database of predicted functional associations between proteins: Nucleic Acids Res, 2003; 31; 258-61
23. Győrffy B, Surowiak P, Budczies J, Lánczky A, Online survival analysis software to assess the prognostic value of biomarkers using transcriptomic data in non-small-cell lung cancer: PLoS One, 2013; 8; e82241
24. Tang Z, Li C, Kang B, GEPIA: A web server for cancer and normal gene expression profiling and interactive analyses: Nucleic Acids Res, 2017; 45; W98-102
25. Dennis G, Sherman BT, Hosack DA, DAVID: Database for annotation, visualization, and integrated discovery: Genome Biol, 2003; 4; P3
26. Cerami E, Gao J, Dogrusoz U, The cBio cancer genomics portal: An open platform for exploring multidimensional cancer genomics data: Cancer Discov, 2012; 2; 401-4
27. Li JH, Liu S, Zhou H, starBase v2.0: Decoding miRNA-ceRNA, miRNA-ncRNA and protein-RNA interaction networks from large-scale CLIP-Seq data: Nucleic Acids Res, 2014; 42; D92-97
28. Ma XJ, Dahiya S, Richardson E, Gene expression profiling of the tumor microenvironment during breast cancer progression: Breast Cancer Res, 2009; 11(1); R7
29. Richardson AL, Wang ZC, De Nicolo A, X chromosomal abnormalities in basal-like human breast cancer: Cancer Cell, 2006; 9(2); 121-32
30. Zhao H, Langerød A, Ji Y, Different gene expression patterns in invasive lobular and ductal carcinomas of the breast: Mol Biol Cell, 2004; 15(6); 2523-36
31. Siegel RL, Miller KD, Jemal A, Cancer statistics. 2016: Cancer J Clin, 2016; 66(1); 7-30
32. Jensen EV, DeSombre ER, Estrogen-receptor interaction: Science, 1973; 182(4108); 126-34
33. Slamon DJ, Clark GM, Wong SG, Human breast cancer: Correlation of relapse and survival with amplification of the HER-2/neu oncogene: Science, 1987; 235(4785); 177-82
34. Osborne CK, Tamoxifen in the treatment of breast cancer: N Engl J Med, 1998; 339(22); 1609-18
35. Dawood S, Broglio K, Buzdar AU, Prognosis of women with metastatic breast cancer by HER-2 status and trastuzumab treatment: An institutional-based review: J Clin Oncol, 2010; 28(1); 92-98
36. Rhodes DR, Yu J, Shanker K, ONCOMINE: A cancer microarray database and integrated data-mining platform: Neoplasia, 2004; 6(1); 1-6
37. The Cancer Genome Atlas Research Network, Comprehensive genomic characterization defines human glioblastoma genes and core pathways: Nature, 2008; 455(7216); 1061-68
38. Lu H, Shi C, Liu X, Identification of ZG16B as a prognostic biomarker in breast cancer: Open Med (Wars), 2020; 16(1); 1-13
39. Dontu G, Al-Hajj M, Abdallah WM, Stem cells in normal breast development and breast cancer: Cell Prolif, 2003; 36(Suppl 1); 59-72
40. Al-Hajj M, Wicha MS, Benito-Hernandez A, Prospective identification of tumorigenic breast cancer cells: Proc Natl Acad Sci USA, 2003; 100(7); 3983-88
41. Dontu G, El-Ashry D, Wicha MS, Breast cancer, stem/progenitor cells and the estrogen receptor: Trends Endocrinol Metab, 2004; 15(5); 193-97
42. Kakarala M, Wicha MS, Cancer stem cells: implications for cancer treatment and prevention: Cancer J, 2007; 13(5); 271-75
43. Yae T, Tsuchihashi K, Ishimoto T, Alternative splicing of CD44 mRNA by ESRP1 enhances lung colonization of metastatic cancer cell: Nat Commun, 2012; 3; 883
44. Ishimoto T, Nagano O, Yae T, CD44 variant regulates redox status in cancer cells by stabilizing the xCT subunit of system xc(−) and thereby promotes tumor growth: Cancer Cell, 2011; 19(3); 387-400
45. ENCODE Project Consortium, An integrated encyclopedia of DNA elements in the human genome: Nature, 2012; 489(7414); 57-74
46. Harrow J, Frankish A, Gonzalez JM, GENCODE: The reference human genome annotation for The ENCODE Project: Genome Res, 2012; 22(9); 1760-74
47. Liu S, Cheng C, Alternative RNA splicing and cancer: Wiley Interdiscip Rev RNA, 2013; 4(5); 547-66
48. Cieply B, Carstens RP, Functional roles of alternative splicing factors in human disease: Wiley Interdiscip Rev RNA, 2015; 6(3); 311-26
49. Brown RL, Reinke LM, Damerow MS, CD44 splice isoform switching in human and mouse epithelium is essential for epithelial-mesenchymal transition and breast cancer progression: J Clin Invest, 2011; 121(3); 1064-74
50. Warzecha CC, Jiang P, Amirikian K, An ESRP-regulated splicing programme is abrogated during the epithelial-mesenchymal transition: EMBO J, 2010; 29(19); 3286-300
51. Yang J, Weinberg RA, Epithelial-mesenchymal transition: at the crossroads of development and tumor metastasis: Dev Cell, 2008; 14(6); 818-29
52. Thiery JP, Acloque H, Huang RY, Nieto MA, Epithelial-mesenchymal transitions in development and disease: Cell, 2009; 139(5); 871-90
53. Reinke LM, Xu Y, Cheng C, Snail represses the splicing regulator epithelial splicing regulatory protein 1 to promote epithelial-mesenchymal transition: J Biol Chem, 2012; 287(43); 36435-42
54. Xu Y, Gao XD, Lee JH, Cell type-restricted activity of hnRNPM promotes breast cancer metastasis via regulating alternative splicing: Genes Dev, 2014; 28(11); 1191-203
55. Bebee TW, Park JW, Sheridan KI, The splicing regulators Esrp1 and Esrp2 direct an epithelial splicing program essential for mammalian development: Elife, 2015; 4; e08954
56. Huelga SC, Vu AQ, Arnold JD, Integrative genome-wide analysis reveals cooperative regulation of alternative splicing by hnRNP proteins: Cell Rep, 2012; 1(2); 167-78
57. Lofton-Day C, Model F, Devos T, DNA methylation biomarkers for blood-based colorectal cancer screening: Clin Chem, 2008; 54(2); 414-23
58. Iorio MV, Croce CM, MicroRNA dysregulation in cancer: Diagnostics, monitoring and therapeutics. A comprehensive review: EMBO Mol Med, 2012; 4(3); 143-59
Figures
 Figure 1. The mRNA expression patterns of ESRP members in different types of cancer. (A) The figure shows the mRNA expression of a statistically significant target gene compared to a normal tissue sample in different types of cancer based on the Oncomine database (https://www.oncomine.org/resource/login.html). The threshold setting: P value, 1E-4; fold change, 2. The number in each cell indicated the number of datasets that met the requirements of this type of cancer analysis. The more data, the more valuable it is. Cell color is determined by the best gene rank percentile for the analyses within the cell. Red color indicates an increased mRNA expression of the gene and blue color refers to decreased mRNA expression of the gene. The gene rank was analyzed by percentile of target gene in the top of 10% of genes measured in every research. The mRNA expression of ESRP1 in (B) Ma Breast, (C) TCGA Breast, (D) Richardson Breast, and (E) Zhao Breast. (F) The mRNA expression of ESRP2 in breast cancer.
 Figure 2. Meta-analysis of ESRP1 expression profile in breast cancer. The Oncomine database was used for meta-analysis of the expression profile of ESRP1 in breast cancer. The threshold setting: P value, 1E-4; fold change, 2. The rank for a gene is the median rank for that gene across each of the analyses and is presented by a different color. The intensity of the color indicates the corresponding level of ESRP1 expression compared to that of normal tissue. Red indicates an increase in the expression level of ESRP1 mRNA, whereas blue indicates a downregulation.
 Figure 3. Analysis of ESRP1 expression in breast cancer cell lines and different molecular subtypes. (A) Analysis of mRNA expression level of ESRP1 in different types of cancer cell lines based on the Cancer Cell Line Encyclopedia (CCLE). (B) The mRNA expression level of ESRP1 in MCF-7 was higher than that in MCF-10A; * P<0.05. (C) The expression of ESRP1 in basal-like and Luminal A subtype were significantly higher than that of the Luminal B subtype of breast cancer, and the HR-sensitive subtype expressed higher level of ESRP1 than did triple-negative and Her-2 clinical subtypes (Gene Expression-Based Outcome for Breast Cancer Online, GOBO).
 Figure 4. Analysis of ESRP1 expression in breast cancer tissue. (A) The expression profile of ESRP1 in 33 types of cancer tissues was analyzed by the Gene Expression Profiling Interactive Analysis (GEPIA) database. (B) The box plot was generated by GEPIA to show the expression of ESRP1 in breast cancer. Matched normal data: Matched The Cancer Genome Atlas (TCGA) normal and Genotype-Tissue Expression (GTEx) data. Tumor color, red; normal color, gray. * P<0.05. (C) The Expression of ESRP1 in breast cancer tissue compared to that in normal breast tissue by immunohistochemistry.
 Figure 5. Association of ESRP1 expression with clinicopathological characteristics in breast cancer. University of Alabama Cancer (UALCAN) analysis showed the mRNA level of ESRP1 in breast cancer patients with distinct clinicopathological characteristics included (A) age, (B) sex, (C) menopause status, (D) race, (E) nodal metastasis status, (F) individual cancer stages, (G) subtypes, and (H) TP53 mutation status. * P<0.05, ** P<0.01, *** P<0.001.
 Figure 6. Analysis of ESRP1 prognostic value in breast cancer. The association of ESRP1 mRNA expression with relapse free survival was analyzed by the Kaplan-Meier plotter in (A) all patients with breast cancer, and different subtypes of BC, including (B) estrogen receptor-positive (ER-positive), (C) ER-negative, (D) basal-like, (E) Luminal A, (F) Luminal B, (G) lymph node-positive, (H) human epidermal growth factor receptor 2 (Her-2)-negative, and (I) Her-2-positive subtypes.
 Figure 7. Alteration patterns and protein interactions of ESRP1 in breast cancer. (A) cBioPortal analysis showed the alteration patterns of ESRP1 in breast cancer. (B) The protein interaction network of ESRP1 was drawn by STRING analysis. The colored nodes in the network represent ESRP1 and its interactions.
 Figure 8. The functions of ESRP1 and text-mining genes significantly associated with ESRP1 alterations. The functions of ESRP1 and interaction genes significantly related to ESRP1 alterations were predicted by the analysis of Gene Ontology (GO) by Database for Annotation, Visualization and Integrated Discovery (DAVID). GO enrichment analyses were performed to predict the roles of target host genes based on 3 aspects, including (A) biological processes, (B) cellular components, and (C) molecular functions. (D) Kyoto Encyclopedia of Genes and Genomes (KEGG) analysis defined the pathways associated with the functions of ESRP1 alterations and the frequently altered interaction genes.
 Figure 9. MicroRNAs and adherens junction regulated by ESRP1 alteration in BC. (A) microRNAs in breast cancer and (B) adherens junction pathways regulated by the ESRP1 alteration in breast cancer were analyzed by cBioPortal.
 Figure 10. Effect of hsa-miR-181c-5p on prognosis of breast cancer patients and ESRP1 expression. (A) The association of hsa-miR-181c-5p with overall survival was analyzed by the Kaplan-Meier plotter in patients with breast cancer. (B) Model of hsa-miR-181c-5p-ESRP1 axis on breast cancer progression.
 Tables
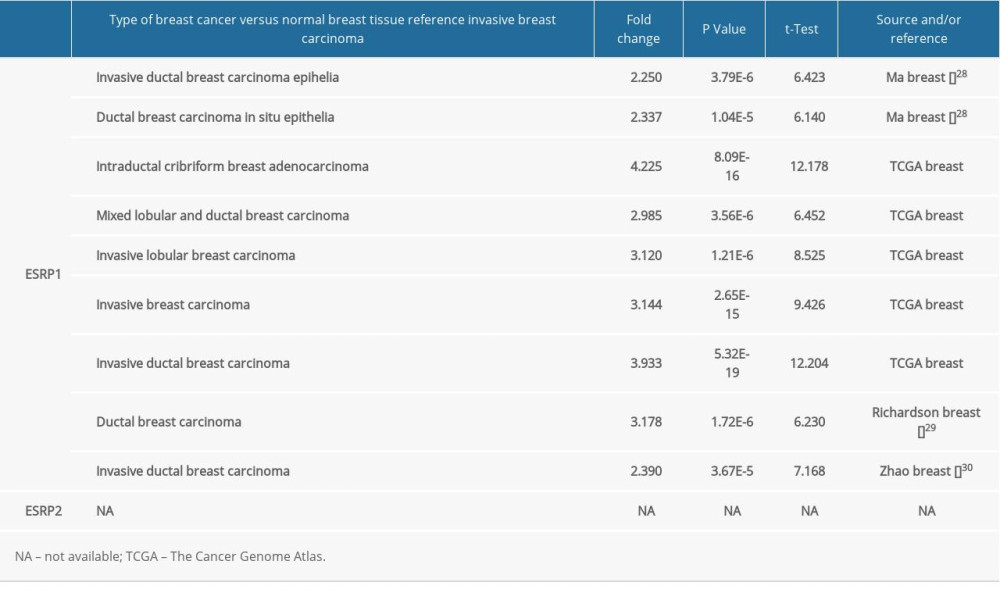 Table 1. The significant changes of ESRPs expression in transcription level between different types of breast cancer and normal breast tissues (Oncomine database).
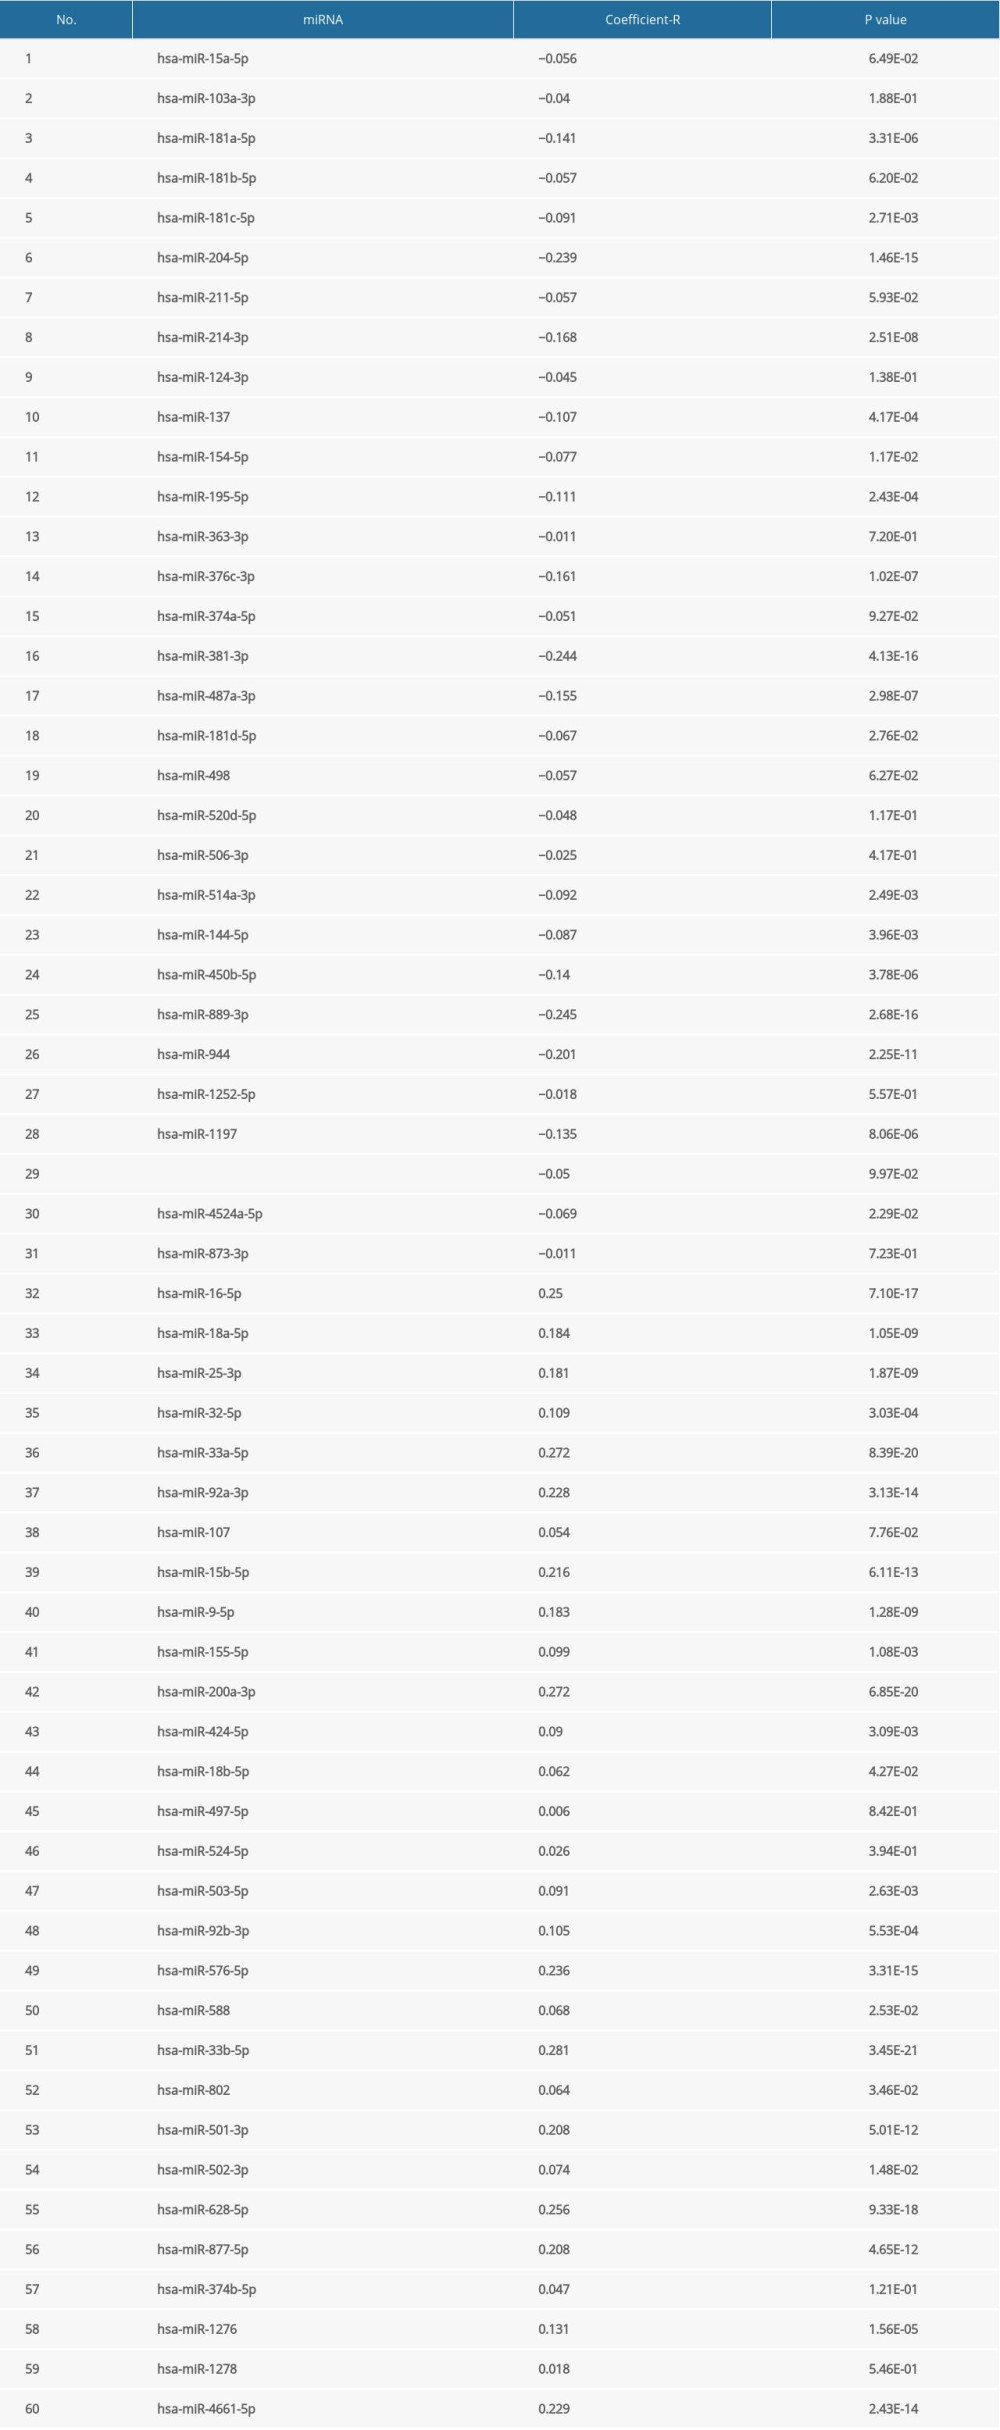 Table 2. Correlation between miRNA-ESRP1 pairs identified by the Encyclopedia of RNA Interactomes (ENCORI) database.
 Table 1. The significant changes of ESRPs expression in transcription level between different types of breast cancer and normal breast tissues (Oncomine database).
 Table 2. Correlation between miRNA-ESRP1 pairs identified by the Encyclopedia of RNA Interactomes (ENCORI) database.
 In Press
08 Mar 2024 : Clinical Research
Evaluation of Foot Structure in Preschool Children Based on Body MassMed Sci Monit In Press; DOI: 10.12659/MSM.943765
15 Apr 2024 : Laboratory Research
The Role of Copper-Induced M2 Macrophage Polarization in Protecting Cartilage Matrix in OsteoarthritisMed Sci Monit In Press; DOI: 10.12659/MSM.943738
07 Mar 2024 : Clinical Research
Knowledge of and Attitudes Toward Clinical Trials: A Questionnaire-Based Study of 179 Male Third- and Fourt...Med Sci Monit In Press; DOI: 10.12659/MSM.943468
08 Mar 2024 : Animal Research
Modification of Experimental Model of Necrotizing Enterocolitis (NEC) in Rat Pups by Single Exposure to Hyp...Med Sci Monit In Press; DOI: 10.12659/MSM.943443
Most Viewed Current Articles
17 Jan 2024 : Review article
Vaccination Guidelines for Pregnant Women: Addressing COVID-19 and the Omicron VariantDOI :10.12659/MSM.942799
Med Sci Monit 2024; 30:e942799
14 Dec 2022 : Clinical Research
Prevalence and Variability of Allergen-Specific Immunoglobulin E in Patients with Elevated Tryptase LevelsDOI :10.12659/MSM.937990
Med Sci Monit 2022; 28:e937990
16 May 2023 : Clinical Research
Electrophysiological Testing for an Auditory Processing Disorder and Reading Performance in 54 School Stude...DOI :10.12659/MSM.940387
Med Sci Monit 2023; 29:e940387
01 Jan 2022 : Editorial
Editorial: Current Status of Oral Antiviral Drug Treatments for SARS-CoV-2 Infection in Non-Hospitalized Pa...DOI :10.12659/MSM.935952
Med Sci Monit 2022; 28:e935952


