29 January 2022: Database Analysis
as a Potential Independent Prognostic Factor of Breast Cancer Related to Lipid Metabolism and Immune Microenvironment Based on TCGA Database Analysis
Shilin Li1CDE, Yi Fang1A*DOI: 10.12659/MSM.934597
Med Sci Monit 2022; 28:e934597
Abstract
BACKGROUND: Lipid metabolism has been proved to be related to the prognosis of breast cancer patients in previous studies, and the tumor immune microenvironment (TIME) plays an important role in tumorigenesis and development, but the dynamic regulation of these is still a challenge.
MATERIAL AND METHODS: This study used lipid metabolism-related pathways to score the gene expression of 980 breast cancer patients in the TCGA database. We used 4 pathways in HALLMARK related to lipid metabolism to score the genes in the database. The differentially expressed genes (DEGs) were further analyzed through survival analysis and Cox regression analysis, and MS4A1, which is associated with better prognosis, was finally determined to be a predictor. In-depth analysis found that MS4A1 was negatively correlated with patient age, clinical stage, tumor size, and distant metastasis. In the MS4A1 high-expression group, most genes were enriched in immune-related pathways, and CIBERSORT analysis found that MS4A1 expression was positively correlated with the abundance of 10 kinds of immune cells, such as CD8+T cells, which are related to the active immune status.
RESULTS: Our results suggest that MS4A1 expression can indicate the situation of lipid metabolism in breast cancer patients and reflect the status of the immune microenvironment.
CONCLUSIONS: MS4A1 has the potential to be an independent indicator of prognosis. Since the expression of MS4A1 is also related to the immune checkpoint mutation burden, detecting its expression level can also provide guidance for choosing treatment options.
Keywords: Breast Neoplasms, Lipid Metabolism, tumor microenvironment, Biomarkers, Tumor, Databases, Genetic, Female, Genome, Glycoproteins, Humans, Lymphocytes, Tumor-Infiltrating
Background
The incidence of breast cancer (BRCA) continues to increase. Breast cancer has a poor prognosis and is difficult to detect early, seriously endangering women’s physical and mental health. According to statistics [1], breast cancer has surpassed lung cancer in 2020, becoming the world’s deadliest cancer. In that year, the number of new breast cancer cases was 2.26 million worldwide. The number of female deaths because of cancer was 4.43 million, and 680 000 of them died from breast cancer. The current effective treatment methods mainly include surgery, chemotherapy, and endocrine therapy, but new biomarkers are needed to classify patients to facilitate individualized intervention and survival prediction, and provide new potential targets for future drug development.
Dysregulated lipid metabolism can lead to tumors, and it can also affect tumor cell proliferation, apoptosis, invasion, and metastasis [2–4]. Lipid metabolism is closely related to the occurrence and development of breast cancer: people with hypercholesterolemia and obesity have a significantly higher risk of estrogen receptor-alpha (ERα)-positive breast cancers [5–7]. 27-Hydroxycholesterol (27HC), an important factor in regulating the homeostasis of cholesterol and a selective estrogen receptor, has been experimentally verified to promote the occurrence and progression of breast cancer [8–11]. Clinical studies have further found that the use of statin therapy can improve the prognosis of breast cancer patients [12]. Classifying patients by assessing lipid metabolism and implementing interventions for lipid metabolism disorders can improve the prognosis. Furthermore, studies have found that disorders of lipid metabolism are also related to drug resistance during treatment [13].
The tumor microenvironment (TME) includes endothelial cells, pericytes, fibroblasts, adipocytes, resident and infiltrating immune cells, and extracellular matrix (ECM). ECM is mainly composed of collagen, elastin, fibronectin, laminin, and proteoglycan (PG). TME contains lipid metabolism components such as fatty acids and cholesterol, and these factors can promote tumor progression [14]. The tumor immune microenvironment (TIME) plays an important role in tumor treatment and tumor progression, which can reflect the immune conditions of tumor tissues, and provide potential targets for tumor treatment [15]. In TME, ECM is an important component, and ECM remodeling plays an important role in tumorigenesis and progression. The lysyl oxidase gene (LOX) acts in the cross-linking of elastin and collagen fibers as well as in the modulation of the structure and stiffness of tumor ECM. Studies have shown that in mouse models of breast cancer, drug therapy combined with LOX knockdown or suppression therapy can reduce tumor growth and metastasis and prolong survival [16–18]. LOX has been suggested as a promising option for the treatment of triple-negative breast cancer [19]. Moreover, LOX has prognostic value in breast cancer patients and plays a role in the formation of pre-metastatic niches in bone in ER-negative breast tumors, and patients with high levels of LOX often have a worse prognosis [20,21].
Similarly, in recent years it has been proposed the potential activity of Trabectedin (an anti-tumor compound already registered as second-line treatment of soft tissue sarcoma and for ovarian cancer) in breast cancer treatment, due to its ability to act as modulator of TME by reducing the number of tumor-associated macrophages [22,23]. Moreover, Trabectedin also showed the ability to promote the increase of timp1 expression (a matrix metalloproteases inhibitor), which can affect the activity and contributing to inhibition of cell invasiveness [24]. Studies have shown [25] that the active lipid metabolism can lead to local immunosuppression in TME and promote tumor growth.
Therefore, in the present study, we first used the 4 lipid metabolism-related pathways in HALLMARK (hallmark gene set) to score 980 patients in The Cancer Genome Atlas (TCGA), screened out differentially expressed genes, then comprehensively considered the survival prognosis, and screened out a biomarker,
Material and Methods
DATA COLLECTION:
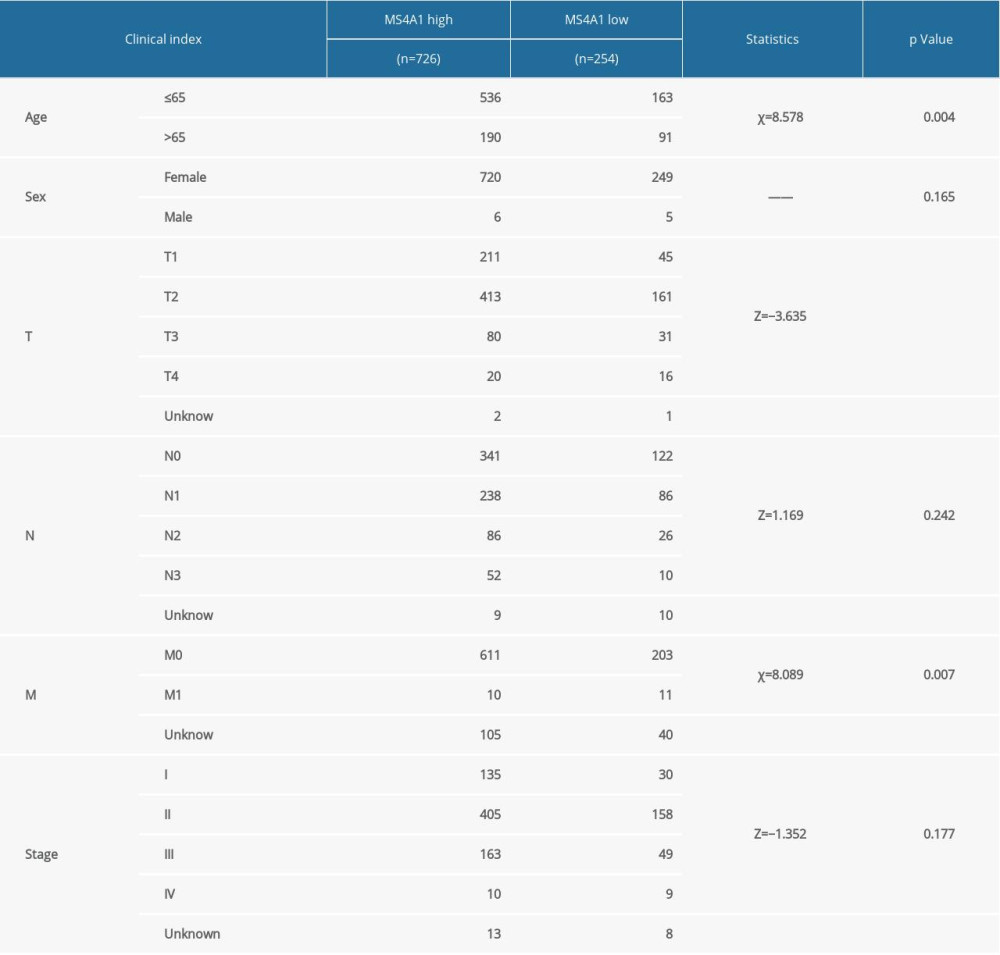
Transcriptome RNA-seq data of 1222 BRCA cases (excluding the duplicate cases and para-cancerous cases, leaving 1091 remaining cases), single-nucleotide variation data of 986 BRCA cases and the corresponding clinical data of 1097 cases were downloaded from the TCGA database (https://portal.gdc.cancer.gov/). We chose all 980 cases with complete transcriptome, single-nucleotide variation and clinical data through the R package “venn” (Figure 1). The clinical data of the 980 cases are summarized in Table 1. The mean age of these patients was 58.46 years old.
LIPID METABOLISM-RELATED PATHWAYS-SCORE AND SCREENING FOR DIFFERENTIALLY EXPRESSED GENES (DEGS):
The 4 lipid metabolism-related pathways in HALLMARK were downloaded from
We used the R (version 3.6.2) package “GSVA” to score 980 patients for representing the activity level of each patient in the 4 lipid metabolism-related pathways of HALLMARK (HALLMARK_CHOLESTEROL_HOMEOSTASIS, HALLMARK_ADIPOGENESIS, HALLMARK_FATTY_ACID_METABOLISM, and HALLMARK_BILE_ACID_METABOLISM). The median score calculated by GSVA package and the 4 median scores were: HALLMARK_CHOLESTEROL_HOMEOSTASIS: −0.043, HALLMARK_ADIPOGENESIS: −0.028, HALLMARK_FATTY_ACID_METABOLISM: −0.019, and HALLMARK_BILE_ACID_METABOLISM: 0.0004 (lower than or equal to the median value was defined as the low-expression group).
To find DEGs, we performed Wilson rank sum testing on gene expression. We set the cutoff as: logFc>0 and the median difference between the high expression group and the low expression group>0. At the same time, the statistical significance of FDR <0.05 (
We found the intersection between the upregulated genes in the high-score group and the low-score group, and performed the same operation in the downregulated genes. Then, we merged the 2 intersections. We finally found 17 common DEGs.
SURVIVAL ANALYSIS:
We used the R package “survival” and “survminer” to perform survival analysis to determine the prognostic value of these intersected DEGs. The cutoff value was determined through the function surv_cutpoint. Kaplan-Meier method (log rank as the statistical significance test) and univariate and Cox regression analysis were used for survival analysis.
COX REGRESSION ANALYSIS:
Univariate and multivariate Cox regression analysis showed that
ENRICHMENT ANALYSIS:
According to the cutoff value of expression level (cutoff value was 0.008887257), 980 cases were divided into an
CLUSTERPROFILE:
R packages “clusterProfiler” and “ggplot2” were used to find DEGs. We performed Wilcoxon signed ranks testing on gene expression, with the cutoff value set as LogFc>0 and the statistical significance of FDR <0.05 (
GENE SET VARIATION ANALYSIS (GSVA):
We used FDR <0.05 to define the DEGs. Then GO and KEGG enrichment analysis were performed with R packages “GSVA” and “ggplot2”.
GENE SET ENRICHMENT ANALYSIS (GSEA):
GO, HALLMARK, and KEGG gene sets were analyzed using GSEA 4.0.3 software. The whole transcriptome of all tumor cases was used for GSEA, and only gene sets with NOM
TUMOR-INFILTRATING IMMUNE CELL (TIC) PROFILE:
We used CIBERSORT [28] computation to estimate the TIC infiltration fraction in 980 cases. Pearson correlation was calculated between the proportions and MS4A1 expression. P<0.05 was selected for the following analysis.
SUB-NETWORK ANALYSIS:
We used Cytoscape (3.6.1) with the MCODE plug-in to perform sub-network analysis on the GOBP terms analyzed with GSEA, with the following parameter settings: degree cutoff 15, Mode Score cutoff 0.2, K-Core 15, Max Depth 100. We finally obtained 4 sub-networks.
HEATMAPS:
Heatmaps were used to present DEGs performed in the R package “pheatmap”. The 100 genes with most significant fold change are presented (50 genes with highest LogFc and 50 genes with lowest LogFc).
VOLCANO PLOTS:
Volcano plots were used to present DEGs performed in the R package “ggplot2”. The genes with |LogFc| >1 are colored and the genes with |LogFc| >2 are labeled.
Results
WE DETERMINED THE NUMBER OF CASES THAT NEEDED TO BE ANALYZED:
We chose all 980 cases with complete transcriptome, single-nucleotide variation, and clinical data (Figure 1). The clinical data of the 980 cases are summarized in Table 1.
SCORES WERE ASSOCIATED WITH LIPID METABOLISM-RELATED PATHWAYS IN HALLMARK:
Four lipid metabolism-related pathways in HALLMARK were used to obtain scores of 980 cases, and the median value was used to distinguish the high- and low-score groups. The DEGs between the high-score group and low-score group are presented in heatmaps and volcano plots (Figure 2 and Supplementary Figure 1). The 17 common genes are shown in Figure 3.
SCREEN CANDIDATE GENES BASED ON SURVIVAL PROGNOSIS:
To further screen biomarkers which can predict the prognosis, we analyzed the impact of these 17 DEGs on survival. We obtained 12 genes that were statistically significant in Kaplan-Meier analysis and Cox regression analysis. Survival curves of 12 genes with prognostic value are shown in Figure 4. We used the Spearman rank correlation coefficient to reflect the correlation between gene expression and scoring, displayed in the form of circle graphs (Figure 5). The length of the ribbon represents the value of the correlation coefficient.
COX REGRESSION ANALYSIS WAS PERFORMED TO FILTER VARIABLES:
We performed univariate Cox regression analysis of 12 DEGs again, this time incorporating clinical factors into variables: TNM staging and patient age. We found that there were 7 genes with protective effects on the prognosis: BGLAP, COL9A1, FAM129C, FCRL1, FGG, MS4A1 and PZP while AKR1B10, SPINK8, TAS2R31, POU3F2, and CRISP3 were risk factors for prognosis (Figure 6A). Further, we conducted multivariate Cox regression analysis, chose forward selection to filter variables, and drew forest maps (Figure 6B). It was obviously that MS4A1 was an independent protective factor for prognosis. Therefore, we finally determined MS4A1 as the target of further research.
ANALYSIS RESULTS OF 980 CASES GROUPED ACCORDING TO MS4A1 EXPRESSION:
We analyzed SNP, mRNA, and clinical data of 980 cases and the results are showed in Figure 4. According to the DNA data based on 980 cases, TP53 had the highest frequency of mutations (Figure 7A). We found the DEGs between MS4A1 high-expression group and low-expression group and the 100 genes with the most significant fold change value are shown in Figure 7B. We also analyzed the differences of MS4A1 expression in different clinical characters (Figure 8). The cases were divided into 2 groups, one younger than or equal to 65 years old and the other older than 65 years old. The expression of MS4A1 in the younger group was higher than in the older group. The expression of MS4A1 in patients with clinical stage I was higher than in patients with clinical stage IV. For TNM staging, the expression of MS4A1 differed between different T stages and different M stages, meaning that the expression of MS4A1 was higher in the group with smaller tumor diameter and the group without distant metastasis. According to the analysis results, there was no significant difference of MS4A1 expression in patients with different N stages.
THE DIFFERENTIAL EXPRESSION OF MS4A1 MAY BE RELATED TO IMMUNE-RELATED PATHWAYS:
Supplementary Figure 2A shows the differential expression of genes in 980 cases. We used the R package “clusterprofiler”. In GO analysis, the DEGs were enriched to the immune-related GO terms (eg, regulation of T cell activation and lymphocyte differentiation) (Figure 9A and Supplementary Figure 2B). The KEGG analysis also showed enriched immune-related pathways, such as Th1 and Th2 cell differentiation (Figure 9B and Supplementary Figure 2C). Based on the above analysis results, we concluded that most of the DEGs obtained after grouping according to the expression of MS4A1 are enriched in immune-related pathways, which indicated that the differential expression of MS4A1 may be related to immune status.
We used the R package “GSVA” for further enrichment analysis. We found that DEGs in GO, HALLMARK, and KEGG gene sets all displayed enrichment of immune-related pathways (Supplementary Figure 3).
We also performed GSEA, with similar results obtained as in the above 2 analysis methods: immune activity in the MS4A1 high-expression group was active (Figure 10). KEGG and HALLMARK results of GSEA enrichment analysis charts are displayed in Supplementary Figure 4. In GOBP-related pathways enrichment analysis, we particularly selected the terms related to T cell immunity, B cell immunity, and NK (natural killer) cell immunity to display in the chart (Figure 11A–11C). Due to the high level of redundancy in GOBP, we performed a sub-network analysis on the results of the pathway in GOBP. After setting the parameters, 4 sub-networks were finally obtained, 2 of which are related to immunity (one is related to T cells and the other is related to B cells), 1 is related to calcium transportation, and the other is related to the cytoskeleton (Figure 11D). These analysis results show that high expression of MS4A1 is related to active immunity.
RELATIONSHIP BETWEEN MS4A1 EXPRESSION AND THE PROPORTION OF TICS:
To explore the relationship between MS4A1 and the immune microenvironment, immune subsets were analyzed using the CIBERSORT algorithm. A barplot shows the proportion of 22 kinds of TICs in BRCA cases (Figure 12A). A heatmap shows the correlation between 22 kinds of TICs and Pearson coefficient used for significance testing (Figure 12B). The correlation between MS4A1 and 22 kinds of immune cells is shown in a circle graph. The length of the ribbon represents the correlation coefficient (Figure 12C). The 22 kinds of immune cells are T cells CD8, T cells CD4 naïve, T cells CD4 memory resting, T cells CD4 memory activated, T cells follicular helper, T cells regulatory (Tregs), T cells gamma delta, B cells naïve, B cells memory, plasma cells, NK cells resting, NK cells activated, monocytes, macrophages M0, macrophages M1, macrophages M2, dendritic cells resting, dendritic cells activated, mast cells resting, mast cells activated, eosinophils, and neutrophils. We found that the expression MS4A1 was positively related to macrophages M1 and CD8+T cells, which are related to immune activation, and are negatively related to macrophages M2 and Tregs, which are related to immunosuppression.
In Supplementary Figure 5, the correlation between 22 kinds of immune cells and MS4A1 are presented. The correlation coefficients (R) were: B cells memory (R=0.16, FDR<0.001), B cells naïve (R=0.35, FDR<0.001), dendritic cells activated (R=−0.01, FDR=−0.867), dendritic cells resting(R=0.21, FDR<0.001), eosinophils (R=0.01, FDR=0.874), macrophages M0 (R=−0.40, FDR<0.001), macrophages M1 (R=0.40, FDR<0.001), macrophages M2 (R=−0.46, FDR<0.001), mast cells resting (R=−0.12, FDR=0.002), monocytes (R>−0.01, FDR=0.952), neutrophils (R=−0.14, FDR<0.001), NK cells activated (R=0.04, FDR=0.389), NK cells activated (R=−0.18, FDR<0.001), plasma cells (R=−0.11, FDR=0.002), T cells CD4 memory activated (R=0.46, FDR<0.001), T cells CD4 memory resting (R=0.23, FDR<0.001), T cells CD4 naïve (R<0.01, FDR=0.979), T cells CD8(R=0.42, FDR<0.001), T cells follicular helper (R=0.46, FDR<0.001), T cells gamma delta (R=0.36, FDR<0.001), and T cells regulatory (Tregs) (R−0.07, FDR=0.057). A total of 16 kind of immune cells were correlated with MS4A1. We found that the expression of MS4A1 was positively correlated with components related to immune activation such as CD8+ T cell and T cells CD4 memory activated and was is negatively correlated with macrophages M2, which are related to immunosuppression. These results indicated that the high expression of MS4A1 was associated with active immunity.
The boxplot (Figure 13A) presents differences in the infiltration of immune cells between MS4A1 high-expression group and low-expression group. There were 14 kinds of cells with different infiltration between the 2 groups. Among them, 10 kinds of cells are positively correlated with MS4A1 expression (eg, CD8+ T cell and T cells CD4 memory activated), while other 4 kinds of cells are negatively correlated with MS4A1 expression (eg, macrophages M0 and macrophages M2). We conclude that the high expression of MS4A1 is related to active immunity. The analysis and correlation analysis results showed a total of 14 common immune cell profiles are related to the expression of MS4A1 (Figure 13B).
DIFFERENTIAL EXPRESSION OF MS4A1 AND IMMUNE CHECKPOINT-RELATED GENES:
To provide potential drug targets for clinical treatment, we further explored the correlation between MS4A1 expression and immune checkpoint-related genes (Supplementary Figure 5) (genes annotated in gray are not statistically significant). We found that the MS4A1 high-expression group had higher expression of immune checkpoint-related genes, which indicated that the patients with high expression of MS4A1 may be sensitive to immunotherapy.
Discussion
In this study, we tried to find genes from the TCGA database that are related to lipid metabolism and that have prognostic value.
In our study, the expression of
TME is particularly important in the occurrence and progression of tumors, and metabolic disorders can affect TME [40]. LOX (acting in the cross-linking of elastin and collagen fibers as well as in the modulation of the structure and stiffness of tumor ECM) was also discovered to be an indicator of prognosis and metastasis [20,21]. Use of Trabectedin, which is an anti-tumor compound that can adjust multiple components in TME, including tumor-associated macrophages, has been suggested in breast cancer treatment [22–24]. Many studies have confirmed that the immune components in TME are particularly important in the occurrence and development of tumors. Although breast cancer is not generally considered to be a highly immunogenic cancer, there is still a rich tumor immune microenvironment in some subtypes of breast cancer. The adaptive immune system, macrophages, and other innate immune cells in breast cancer also play important roles [41]. Some studies have found that in triple-negative breast cancer patients, TILs (tumor-infiltrating lymphocytes) are associated with better prognosis, especially prolonging recurrence-free survival, and can be used as tumor prognostic markers [42–44]. Thus, most patients with active immune response will obtain better treatment effect and prognosis.
We grouped 980 cases according to the differential expression of
CD20 encoded by
For the pathways related to calcium channels and cytoskeleton in the enriched sub-network analysis, we speculate it may be due to the calcium ion transportation and cytoskeleton remodeling involved in the process of immune microenvironment regulation. Cytoskeleton changes are related to immune synapse formation. These physiological processes play important roles in the function of the immune system [57–59].
A limitation of the present study is that we only used data from a single database. In addition, due to the limitation of objective conditions, no relevant experimental verification was carried out. We will address these limitations in future related research and look forward to making further discoveries.
Conclusions
After a series of analyses of relevant data from the TCGA database, we found that MS4A1 not only reflects the lipid metabolism level of breast cancer patients, but also serves as a potential independent prognostic factor. Our research provides a new biomarker for clinical treatment, which helps to distinguish the different conditions of patients, so as to better carry out individualized treatment and maximize the treatment effect.
Figures
![Looking for samples with all 3 pieces of information (mRNA, clinical features, single-nucleotide mutations [SNP]), a total of 980 cases were obtained.](https://jours.isi-science.com/imageXml.php?i=medscimonit-28-e934597-g001.jpg&idArt=934597&w=1000) Figure 1. Looking for samples with all 3 pieces of information (mRNA, clinical features, single-nucleotide mutations [SNP]), a total of 980 cases were obtained.
Figure 1. Looking for samples with all 3 pieces of information (mRNA, clinical features, single-nucleotide mutations [SNP]), a total of 980 cases were obtained. 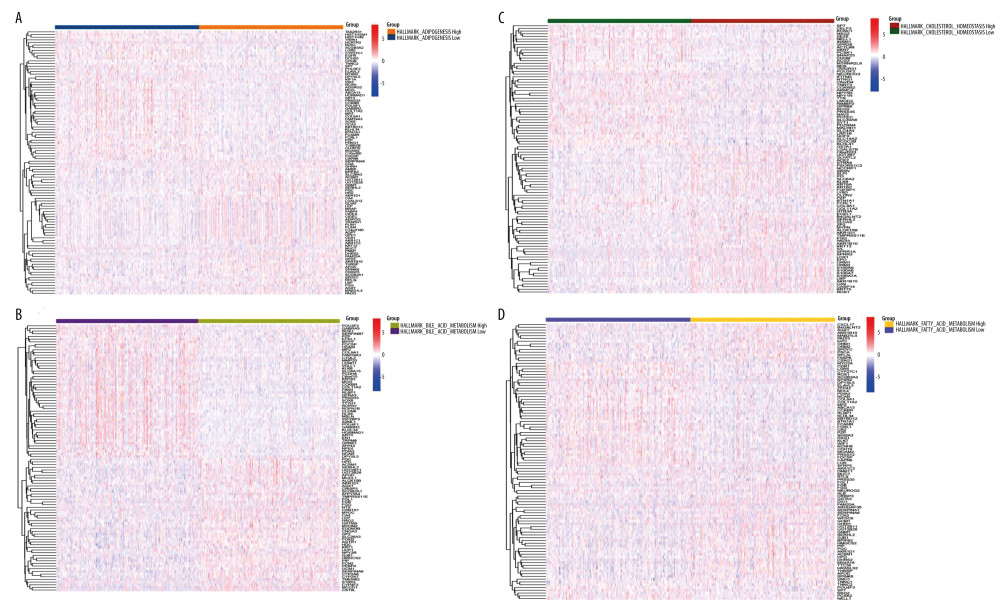 Figure 2. Four lipid metabolism-related pathways in HALLMARK were used as scoring standards. (A) Using the median value of HALLMARK_CHOLESTEROL_HOMEOSTASIS score as the standard, we performed differential gene expression analysis for the high group and the low group. (B) Using the median value of HALLMARK_ADIPOGENESIS score as the standard, we performed differential gene expression analysis for the high group and the low group. (C) Using the median value of HALLMARK_FATTY_ACID_METABOLISM score as the standard, we performed differential gene expression analysis for the high group and the low group. (D) Using the median value of HALLMARK_BILE_ACID_METABOLISM score as the standard, we performed differential gene expression analysis for the high group and the low group.
 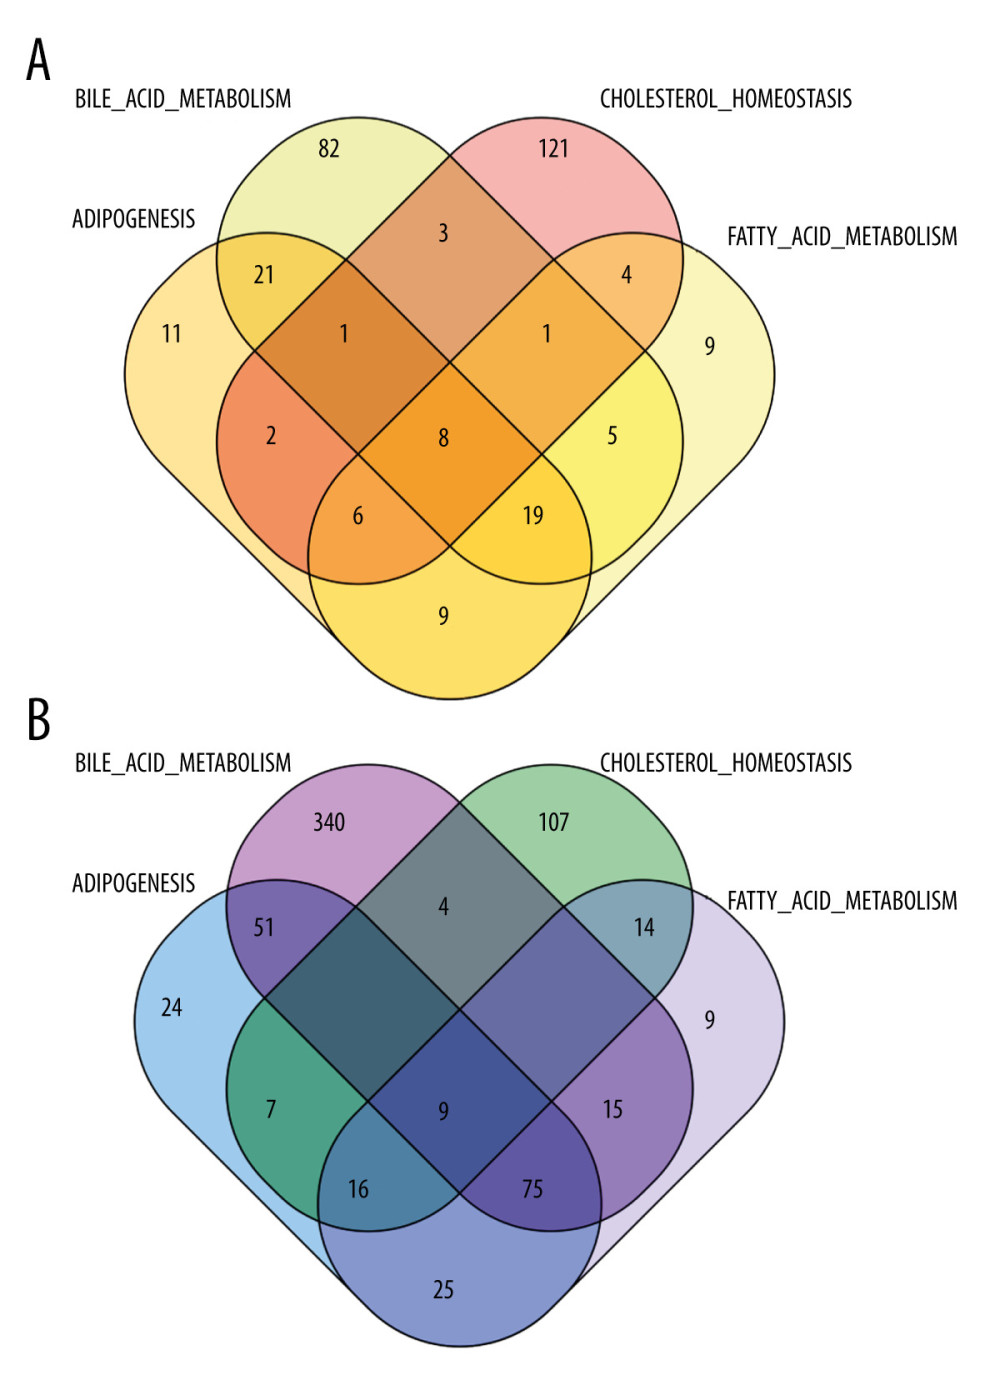 Figure 3. (A) We took the intersection of DEGs in the high-score group and obtained 8 genes. (B) We took the intersection of DEGs in the low-score group and l obtained 9 genes.
 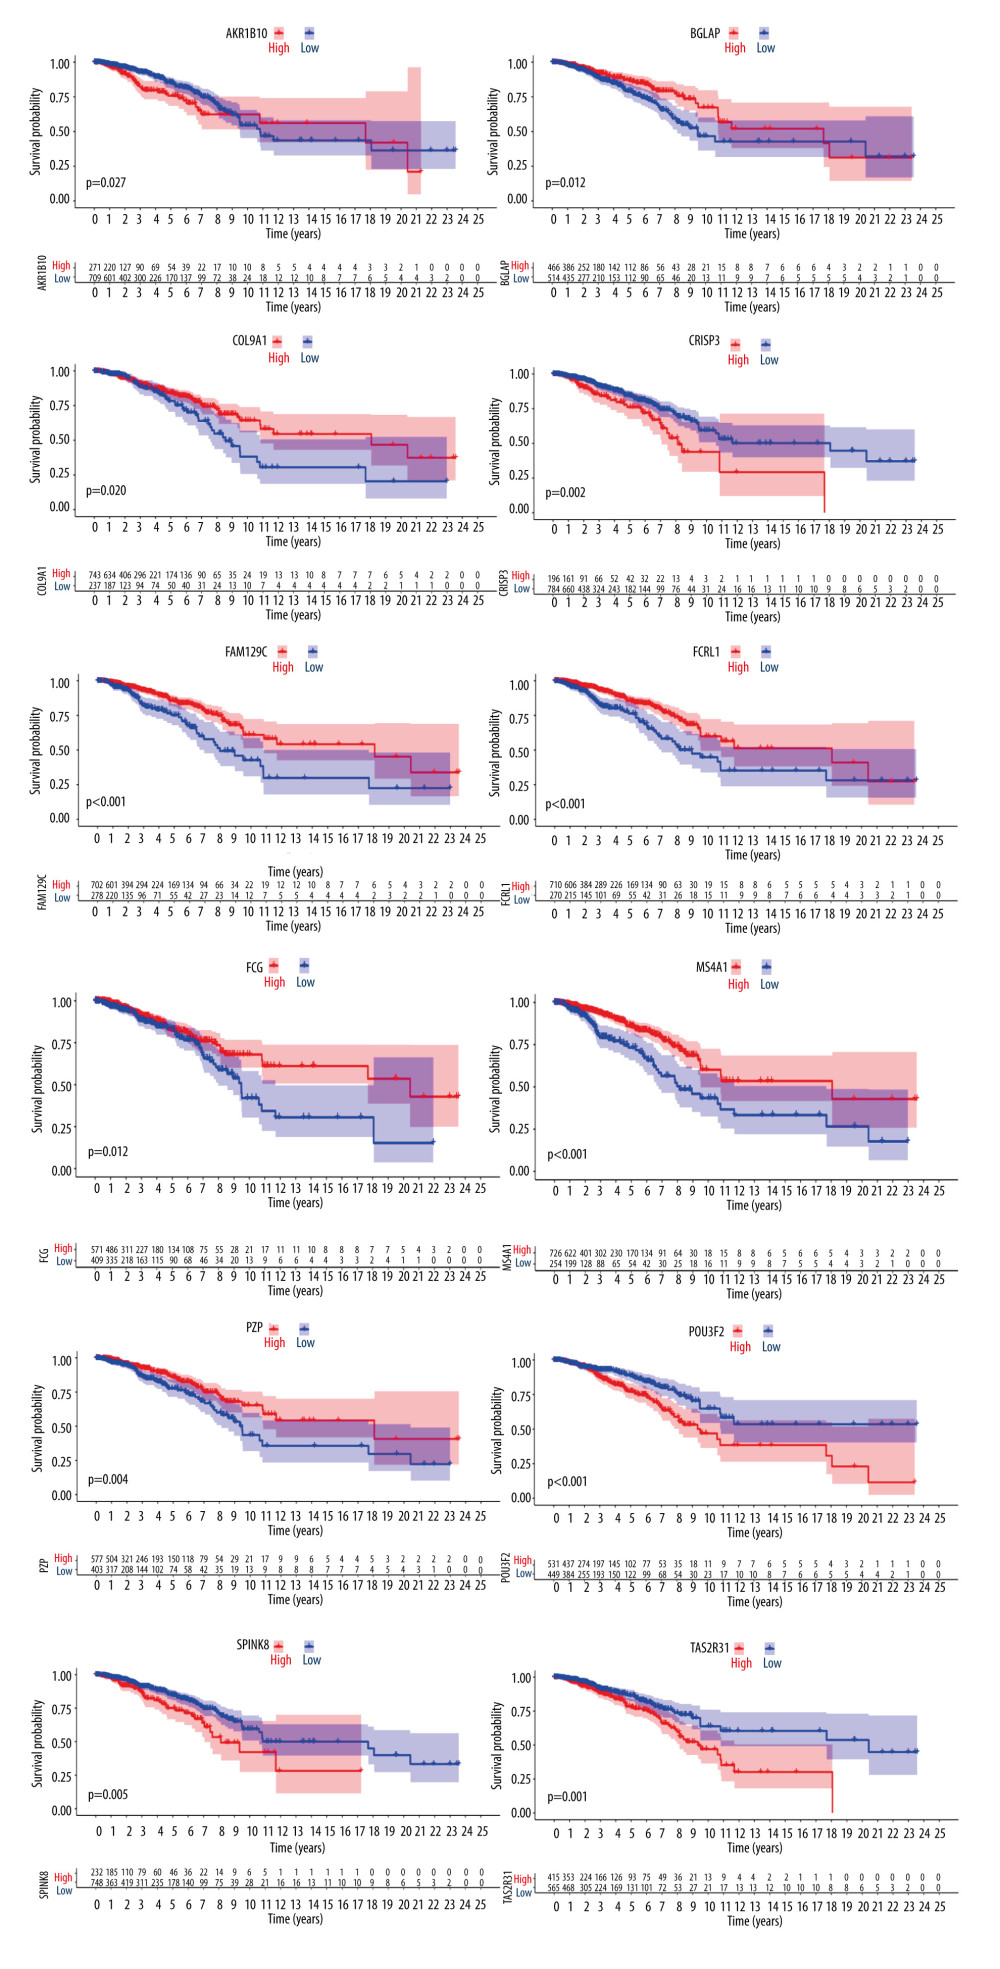 Figure 4. Differences in the expression of 12 genes leading to differences in survival.
 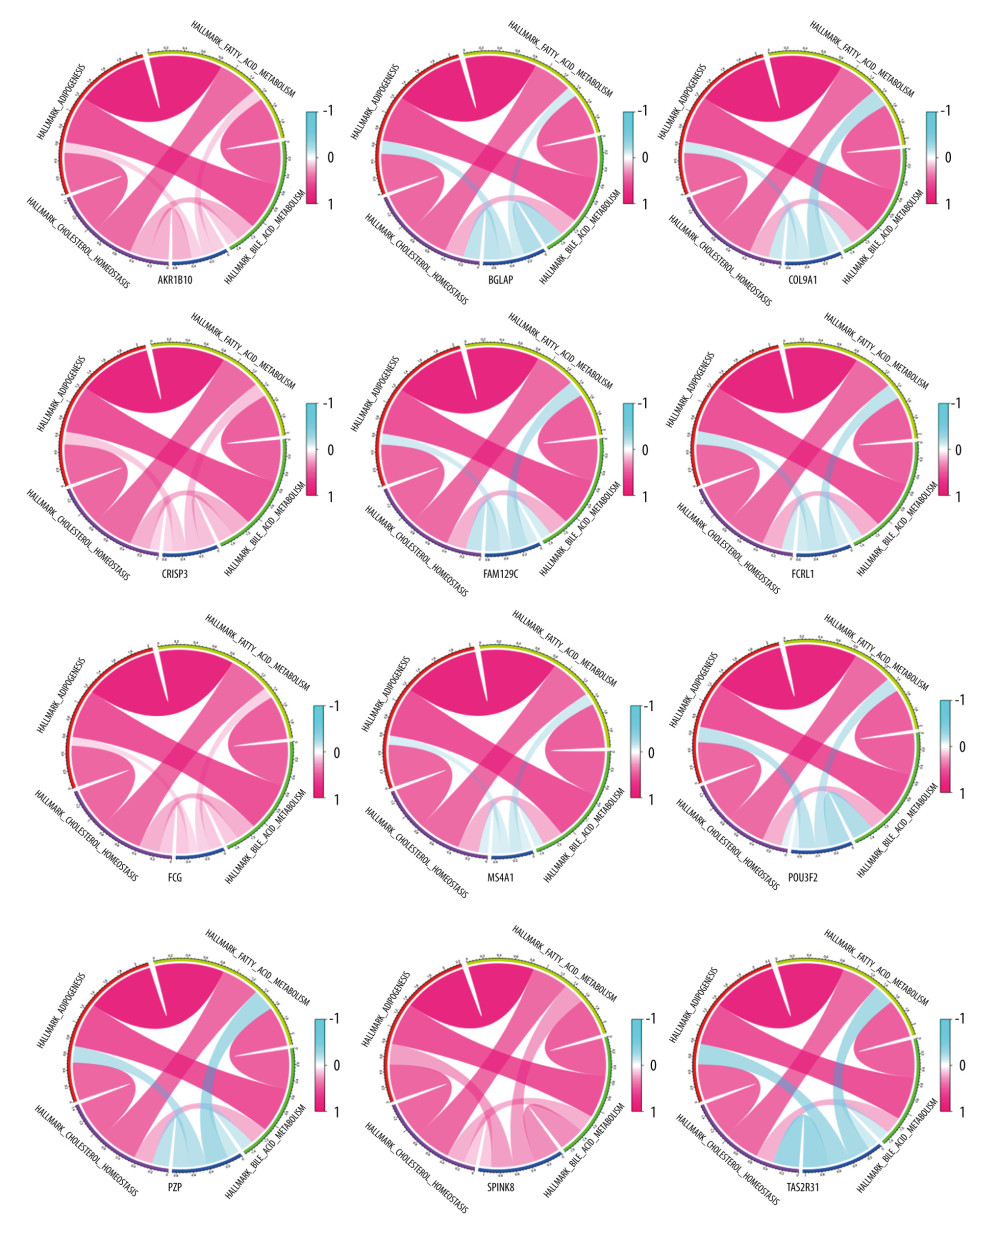 Figure 5. Correlation between 12 genes and 4 scoring pathways. The length of the ribbon indicates the size of the correlation.
 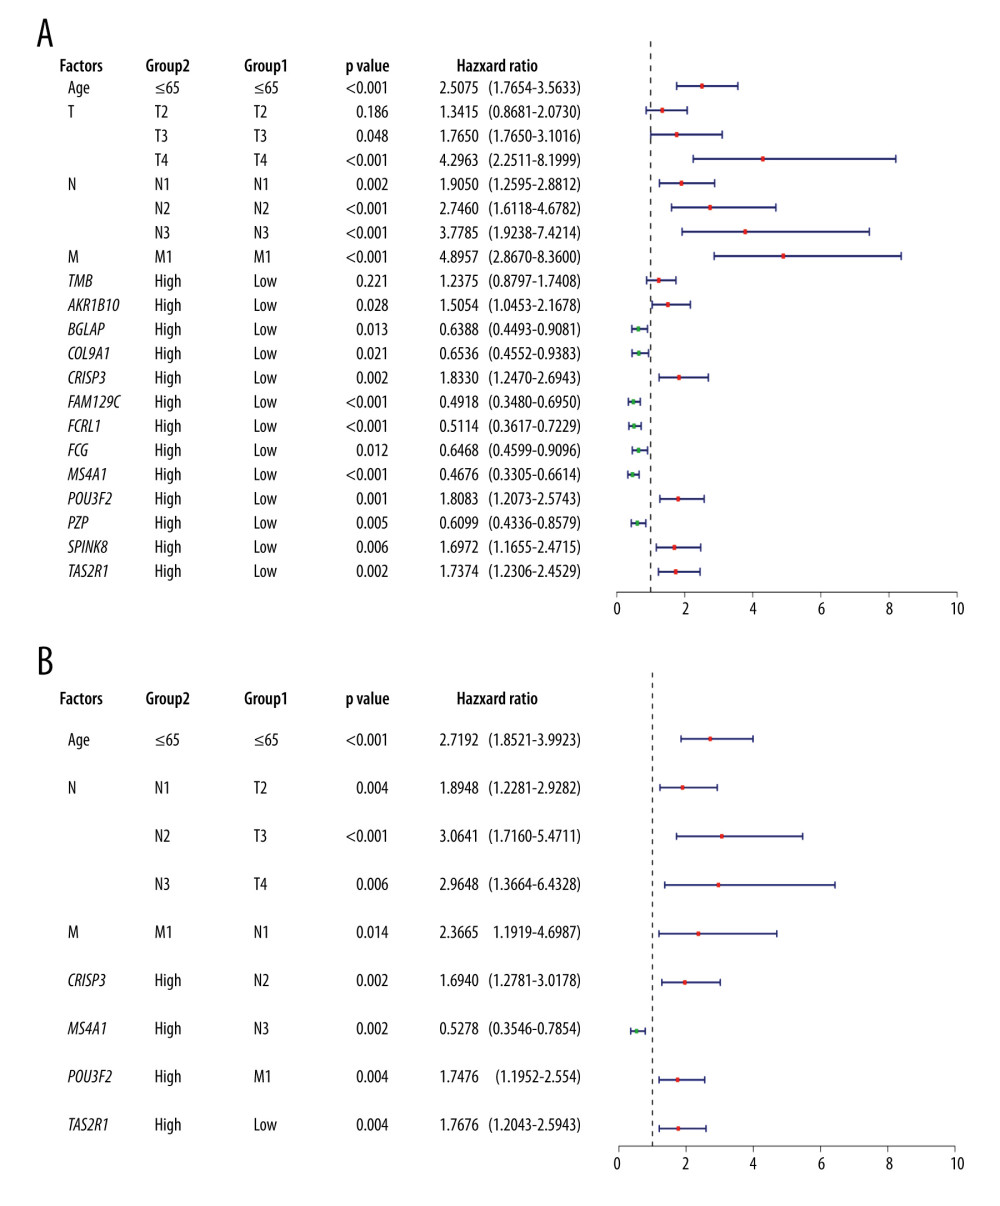 Figure 6. (A) Univariate Cox regression analysis incorporating age, TNM stage, and 12 DEGs into variables. (B) Multivariate Cox regression analysis. Because of the large number of variables, we used forward selection. MS4A1 was the only protective factor.
 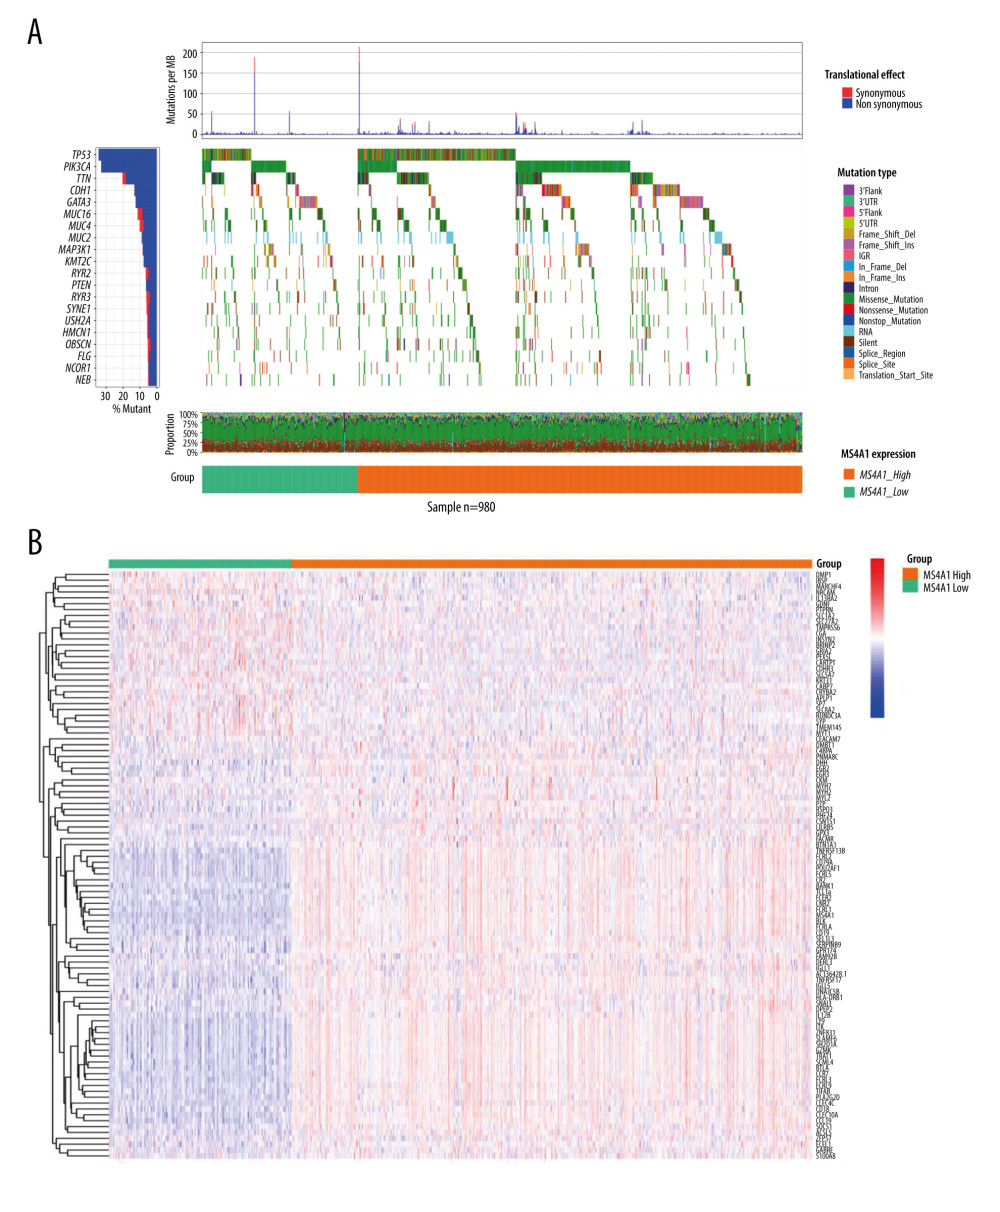 Figure 7. (A) Single-nucleotide variation of MS4A1 high-expression group and low-expression group. (B) Transcriptome level results of MS4A1 high-expression group and low-expression group.
 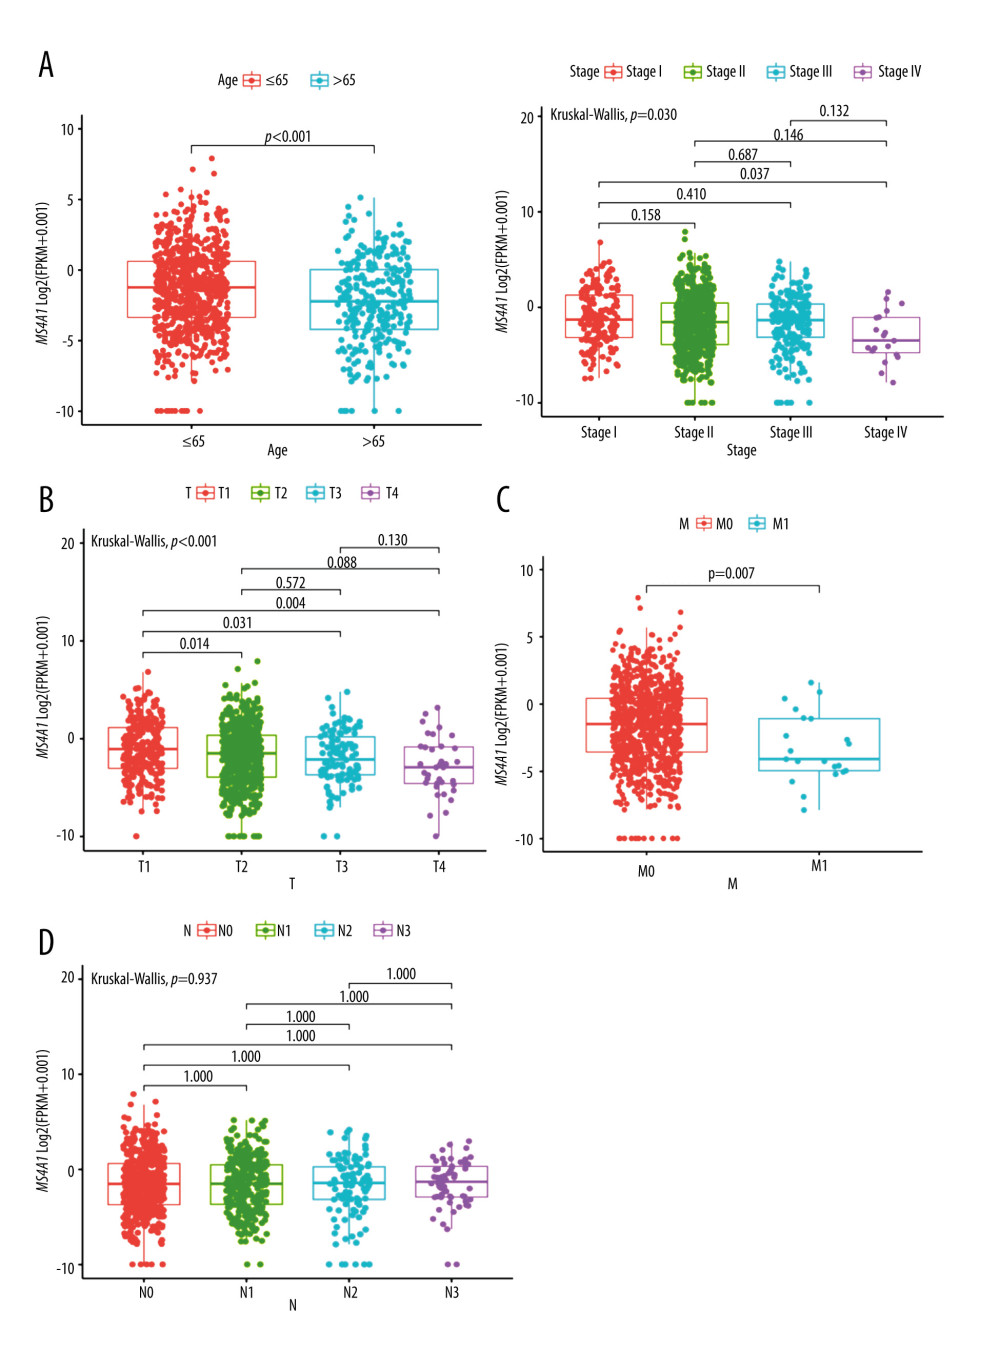 Figure 8. (A) MS4A1 expression in different age groups and among different stage groups. (B) MS4A1 expression among different T (Topography) groups. (C) MS4A1 expression among different M (Metastasis) groups. (D) MS4A1 expression among different N (Lymph Node) groups.
 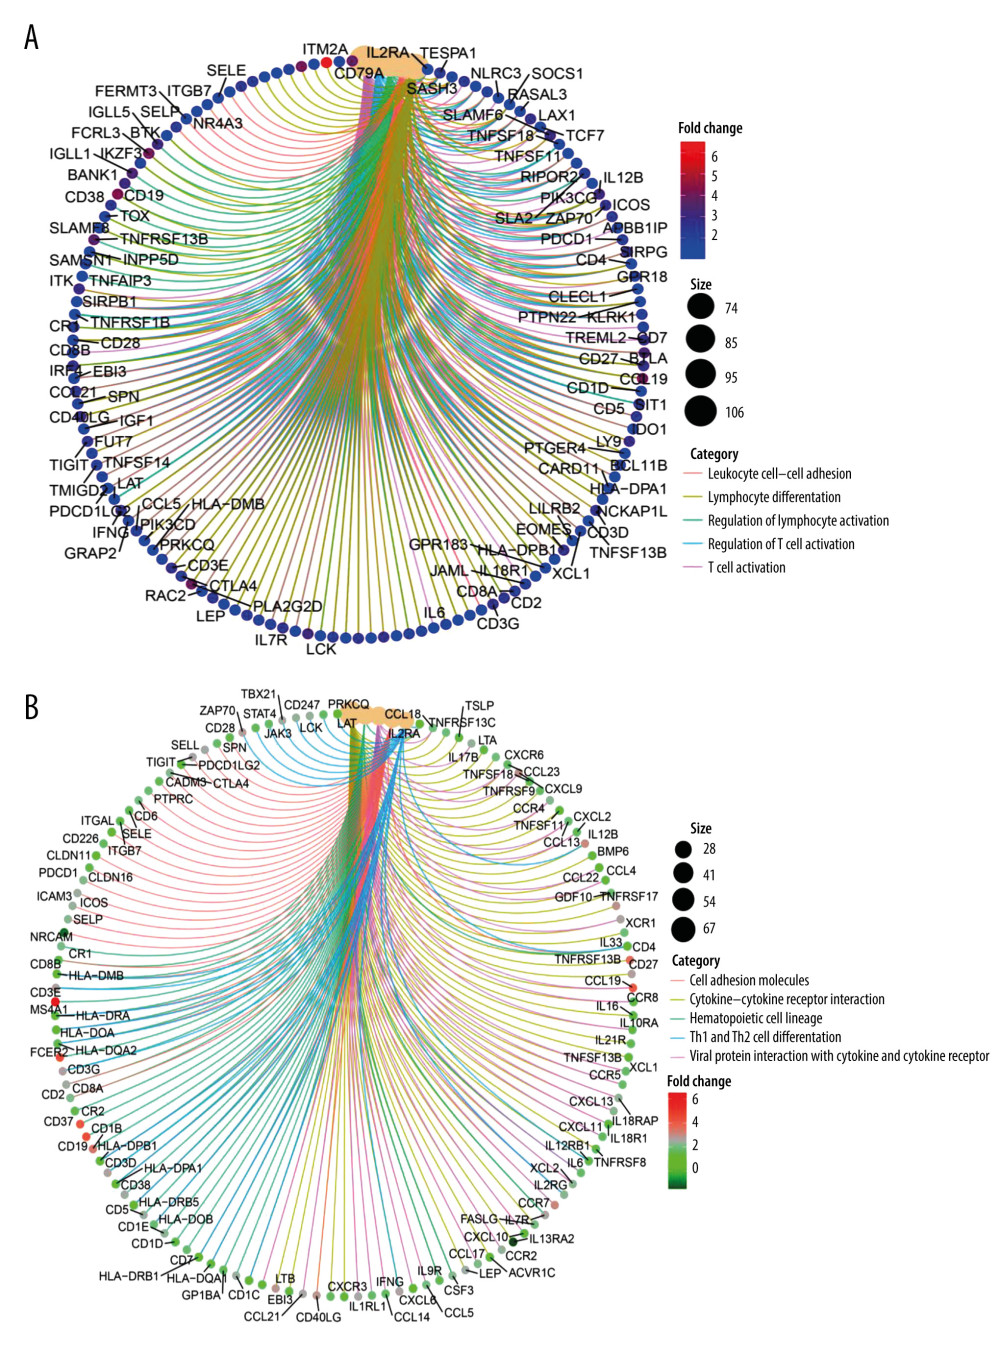 Figure 9. (A) We used R language with the clusterProfiler package to perform GO enrichment analysis and created a circle graph. (B)4We used R language with the clusterProfiler package to perform KEGG enrichment analysis and created a circle graph.
 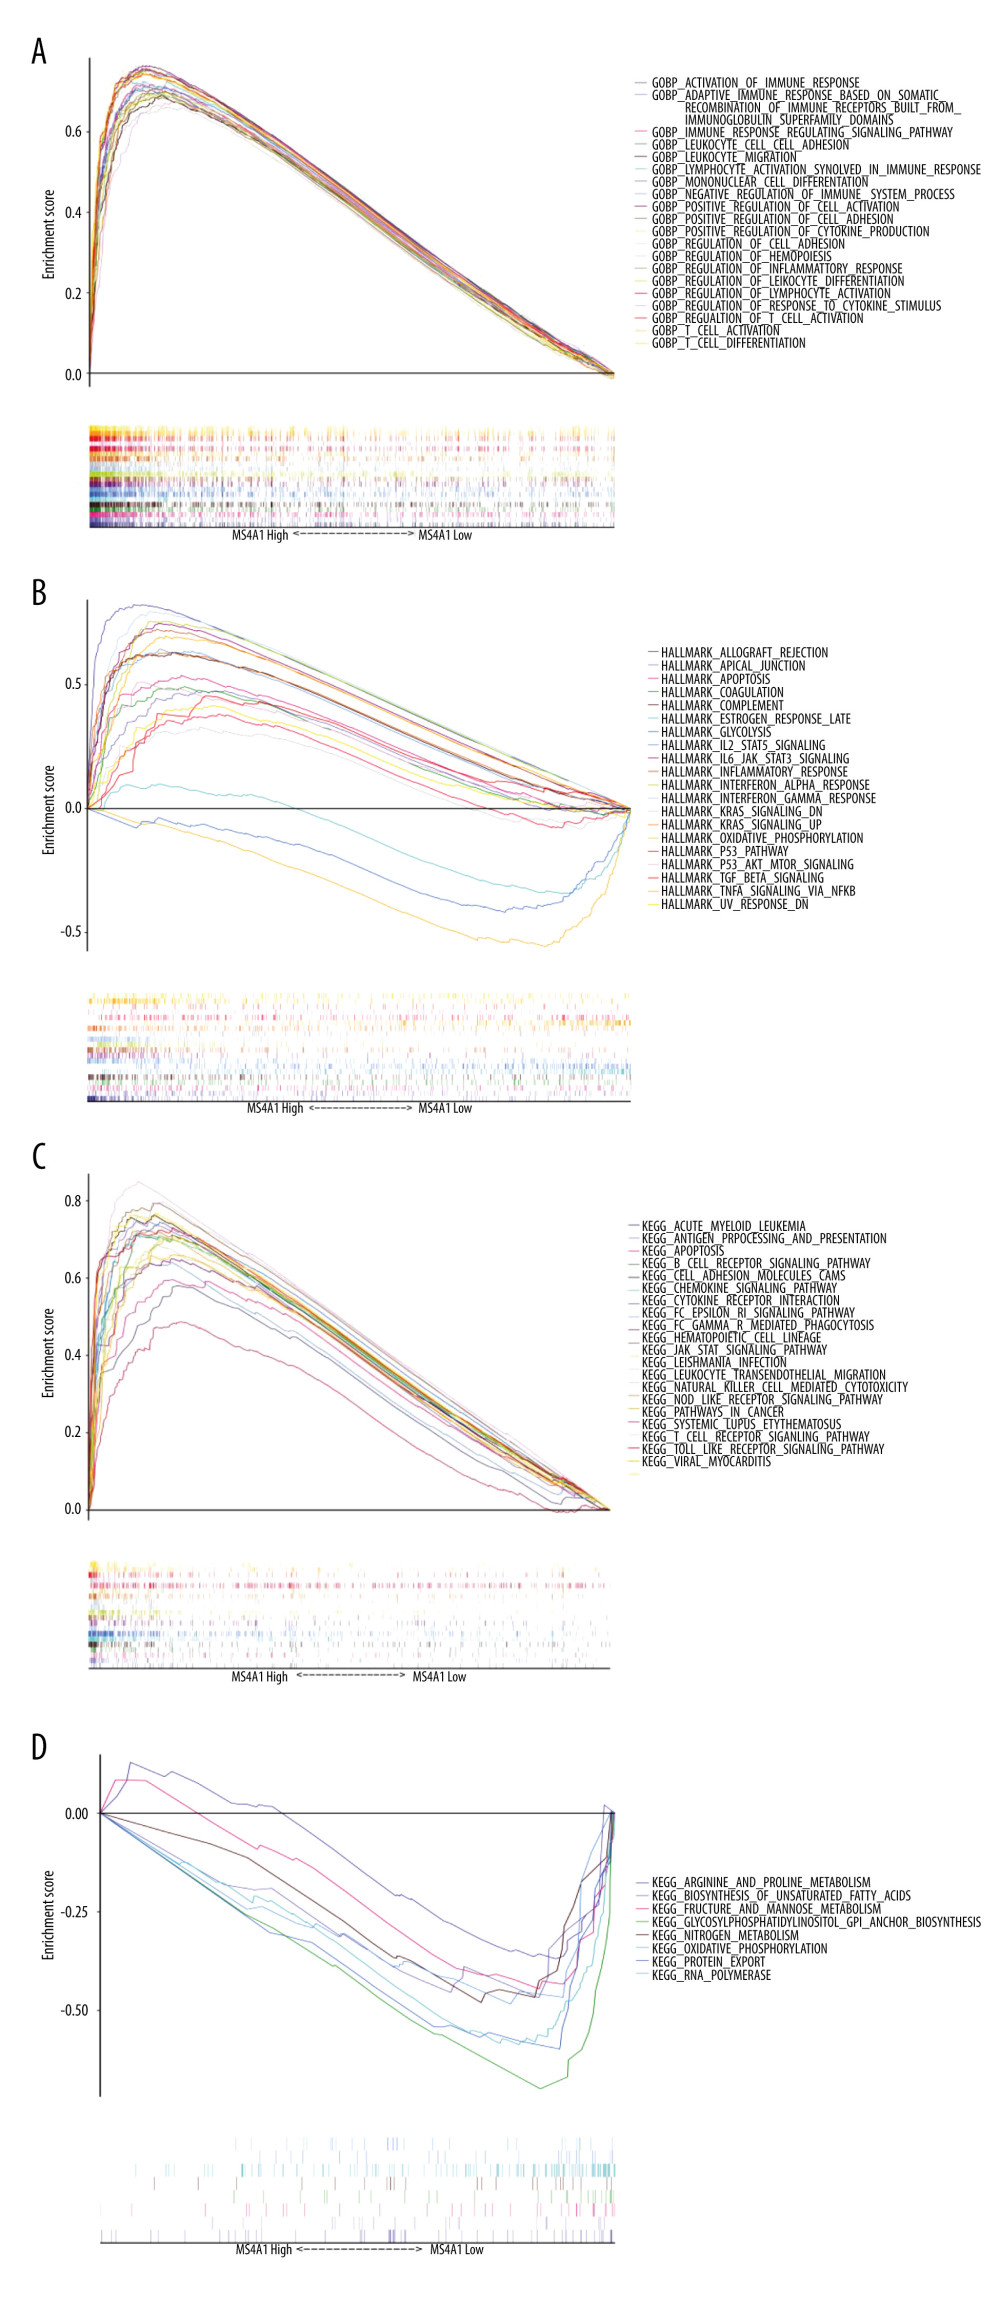 Figure 10. (A) We used R language with the GSEA package to perform GO enrichment analysis. (B, C) We used R language with the GSEA package to perform HALLMARK enrichment analysis. (D) We used R language with the GSEA package to perform KEGG enrichment analysis.
 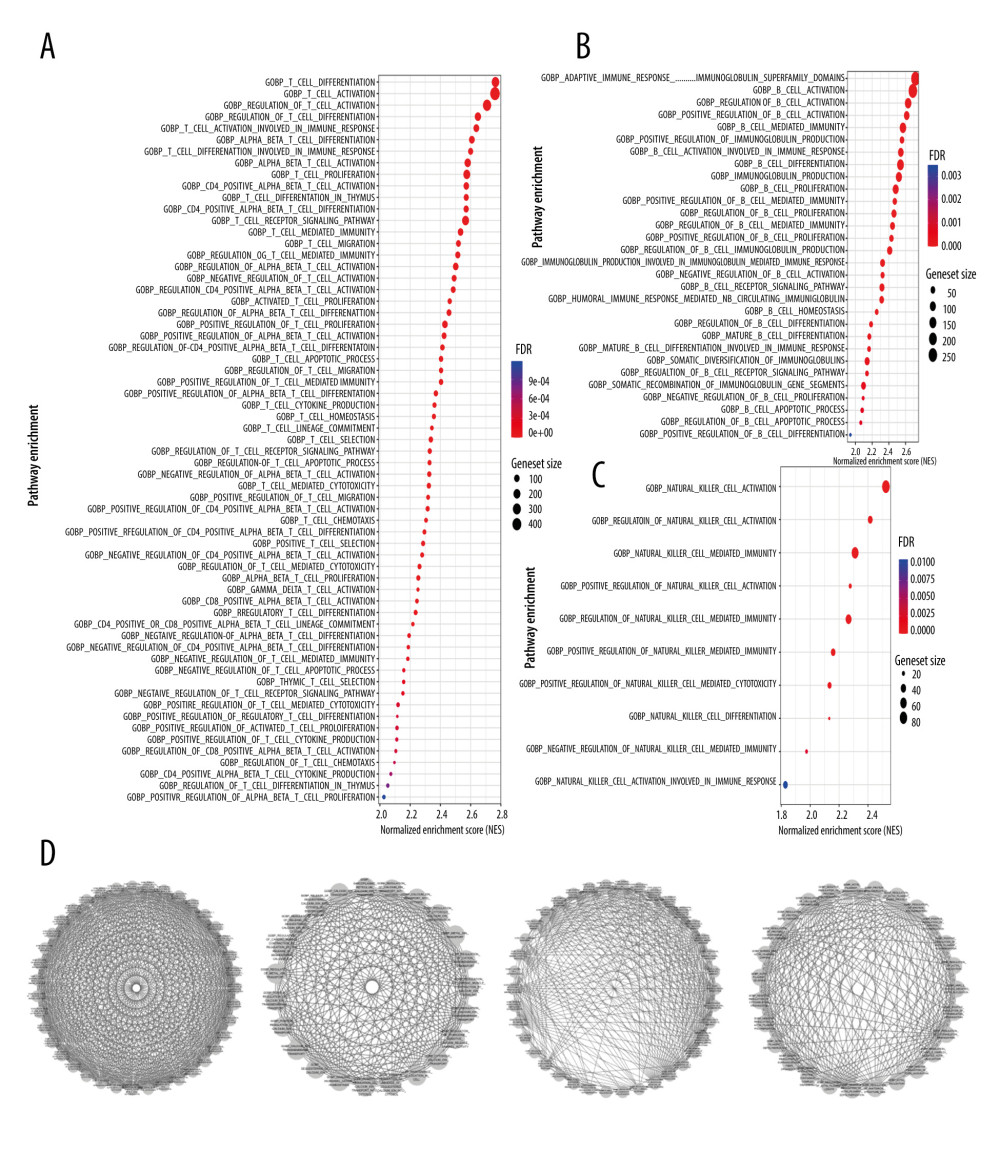 Figure 11. (A) T cell-related pathways in GOBP enrichment analysis. (B) B cell-related pathways in GOBP enrichment analysis. (C) NK cell-related pathways in GOBP enrichment analysis. (D) We used Cytoscape software to perform sub-network analysis of GOBP enrichment analysis results. The first and third sub-networks are related to immune function, the second sub-network is related to calcium channels, while the fourth is relate to cytoskeleton.
 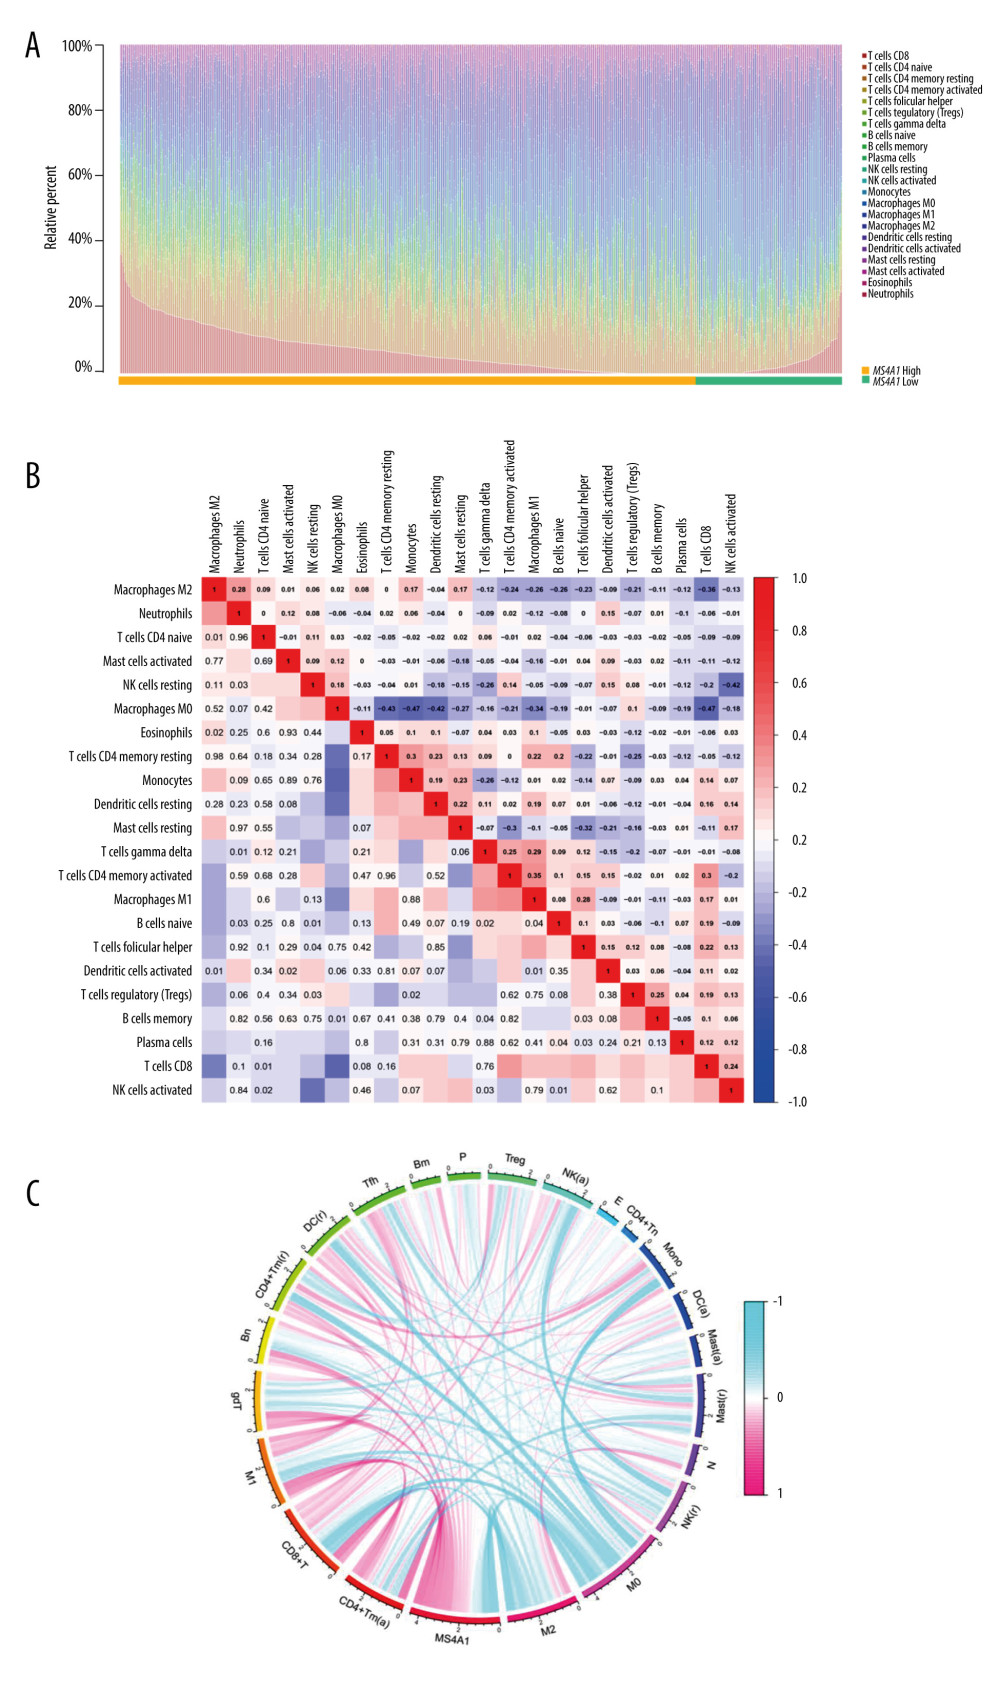 Figure 12. (A) We used the CIBERSORT algorithm to explore the relationship between the expression of MS4A1 and the immune microenvironment, and 22 kinds of immune cell profiles in BRCA samples were constructed. (B) Correlation between immune cells. (C) Correlation between 22 kinds of immune cell profiles and MS4A1.
 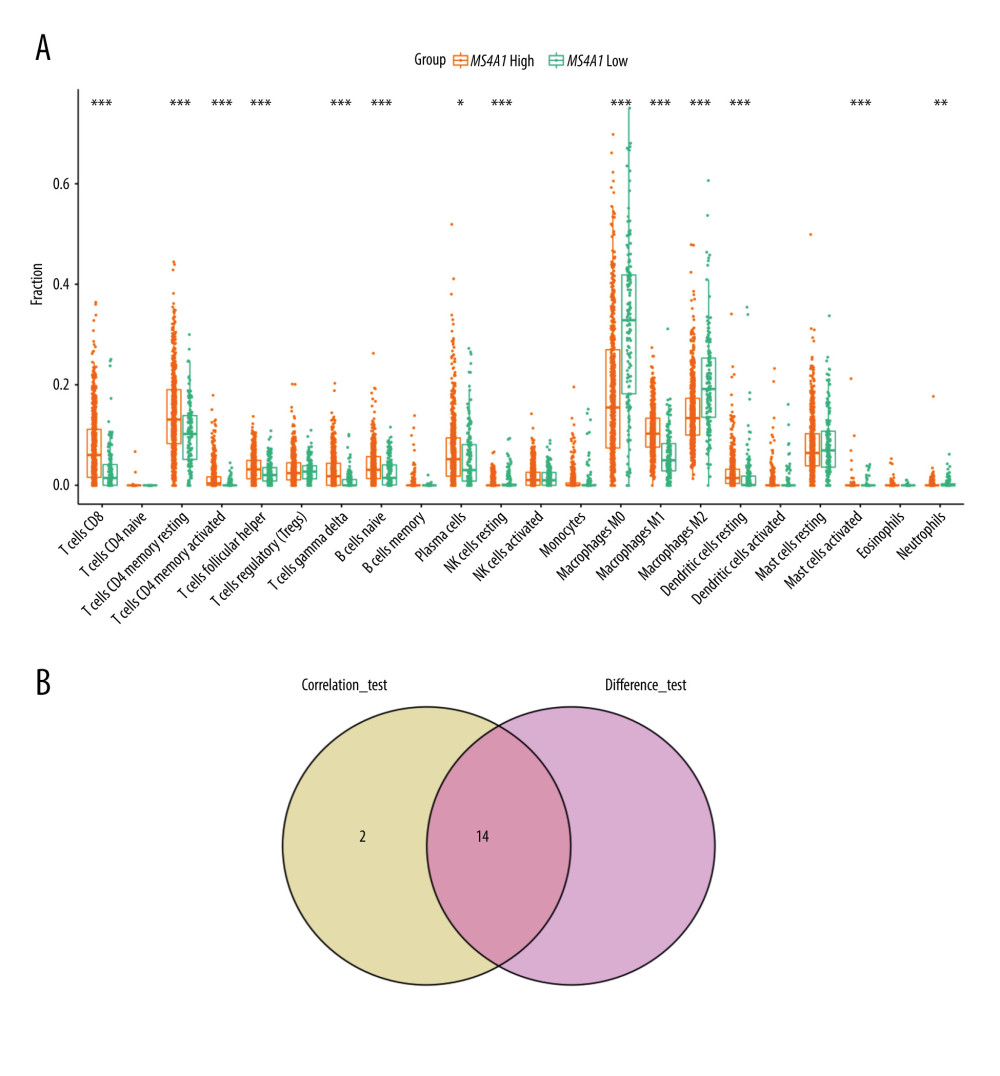 Figure 13. (A) Differences in immune cells infiltrate between MS4A1 high-expression group and low-expression group. (B) Intersection of immune cells related to MS4A1 and differences in expression.
 References
1. Sung H, Ferlay J, Siegel RL, Global Cancer Statistics 2020: GLOBOCAN estimates of incidence and mortality worldwide for 36 cancers in 185 countries: Cancer J Clin, 2021; 71(3); 209-49
2. Röhrig F, Schulze A, The multifaceted roles of fatty acid synthesis in cancer: Nat Rev Cancer, 2016; 16(11); 732-49
3. Yu XH, Ren XH, Liang XH, Tang YL, Roles of fatty acid metabolism in tumourigenesis: Beyond providing nutrition (review): Mol Med Rep, 2018; 18(6); 5307-16
4. Esposito M, Mondal N, Greco TM, Bone vascular niche E-selectin induces mesenchymal-epithelial transition and Wnt activation in cancer cells to promote bone metastasis: Nat Cell Biol, 2019; 21(5); 627-39
5. Boyd NF, McGuire V, Evidence of association between plasma high-density lipoprotein cholesterol and risk factors for breast cancer: J Natl Cancer Inst, 1990; 82(6); 460-68
6. Bianchini F, Kaaks R, Vainio H, Overweight, obesity, and cancer risk: Lancet Oncol, 2002; 3(9); 565-74
7. Kitahara CM, Berrington de González A, Freedman ND, Total cholesterol and cancer risk in a large prospective study in Korea: J Clin Oncol, 2011; 29(12); 1592-98
8. Umetani M, Domoto H, Gormley AK, 27-Hydroxycholesterol is an endogenous SERM that inhibits the cardiovascular effects of estrogen: Nat Med, 2007; 13(10); 1185-92
9. DuSell CD, Umetani M, Shaul PW, Mangelsdorf DJ, McDonnell DP, 27-hydroxycholesterol is an endogenous selective estrogen receptor modulator: Mol Endocrinol (Baltimore, MD), 2008; 22(1); 65-77
10. Nelson ER, Wardell SE, Jasper JS, 27-Hydroxycholesterol links hypercholesterolemia and breast cancer pathophysiology: Science (New York, NY), 2013; 342(6162); 1094-98
11. Wu Q, Ishikawa T, Sirianni R, 27-Hydroxycholesterol promotes cell-autonomous, ER-positive breast cancer growth: Cell Rep, 2013; 5(3); 637-45
12. Kimbung S, Chang CY, Bendahl PO, Impact of 27-hydroxylase (CYP27A1) and 27-hydroxycholesterol in breast cancer: Endocr Relat Cancer, 2017; 24(7); 339-49
13. Cao Y, Adipocyte and lipid metabolism in cancer drug resistance: J Clin Invest, 2019; 129(8); 3006-17
14. Gomaraschi M, Role of lipoproteins in the microenvironment of hormone-dependent cancers: Trends Endocrinol Metab, 2020; 31(3); 256-68
15. Lei X, Lei Y, Li JK, Immune cells within the tumor microenvironment: Biological functions and roles in cancer immunotherapy: Cancer Lett, 2020; 470; 126-33
16. Rossow L, Veitl S, Vorlová S, LOX-catalyzed collagen stabilization is a proximal cause for intrinsic resistance to chemotherapy: Oncogene, 2018; 37; 4921-40
17. Miller BW, Morton JP, Pinese M, Targeting the LOX/hypoxia axis reverses many of the features that make pancreatic cancer deadly: Inhibition of LOX abrogates metastasis and enhances drug efficacy: EMBO Mol Med, 2015; 7; 1063-76
18. Saatci O, Kaymak A, Raza U, Targeting lysyl oxidase (LOX) overcomes chemotherapy resistance in triple negative breast cancer: Nat Commun, 2020; 11; 2416
19. De Vita A, Liverani C, Molinaro R, Lysyl oxidase engineered lipid nanovesicles for the treatment of triple negative breast cancer: Sci Rep, 2021; 11(1); 5107
20. Setargew YFI, Wyllie K, Grant RD, Targeting lysyl oxidase family meditated matrix cross-linking as an anti-stromal therapy in solid tumours: Cancers (Basel), 2021; 13(3); 491
21. Saatci O, Kaymak A, Raza U, Targeting lysyl oxidase (LOX) overcomes chemotherapy resistance in triple negative breast cancer: Nat Commun, 2020; 11(1); 2416
22. D’Incalci M, Zambelli A, Trabectedin for the treatment of breast cancer: Expert Opin Investig Drugs, 2016; 25(1); 105-15
23. De Vita A, Recine F, Miserocchi G, The potential role of the extracellular matrix in the activity of trabectedin in UPS and L-sarcoma: Evidences from a patient derived primary culture case series in tridimensional and zebrafish models: J Exp Clin Cancer Res, 2021; 40; 165
24. Souid S, Aissaoui D, Srairi-Abid N, Essafi-Benkhadir K: Curr Drug Targets, 2020; 21(10); 996-1007
25. Hao Y, Li D, Xu Y, Investigation of lipid metabolism dysregulation and the effects on immune microenvironments in pan-cancer using multiple omics data: BMC Bioinformatics, 2019; 20(Suppl 7); 195
26. Eon Kuek L, Leffler M, Mackay GA, Hulett MD, The MS4A family: Counting past 1, 2 and 3: Immunol Cell Biol, 2016; 94(1); 11-23
27. Mudd TW, Lu C, Klement JD, Liu K, MS4A1 expression and function in T cells in the colorectal cancer tumor microenvironment: Cell Immunol, 2021; 360; 104260
28. Kelesidis I, Kelesidis T, Mantzoros CS, Adiponectin and cancer: A systematic review: Br J Cancer, 2006; 94(9); 1221-25
29. Keum N, Greenwood DC, Lee DH, Adult weight gain and adiposity-related cancers: A dose-response meta-analysis of prospective observational studies: J Natl Cancer Inst, 2015; 107(2); djv088
30. Chen GC, Chen SJ, Zhang R, Central obesity and risks of pre- and postmenopausal breast cancer: A dose-response meta-analysis of prospective studies: Obes Rev, 2016; 17(11); 1167-77
31. Robinson PJ, Bell RJ, Davis SR, Obesity is associated with a poorer prognosis in women with hormone receptor positive breast cancer: Maturitas, 2014; 79(3); 279-86
32. Jeon YW, Kang SH, Park MH, Relationship between body mass index and the expression of hormone receptors or human epidermal growth factor receptor 2 with respect to breast cancer survival: BMC cancer, 2015; 15; 865
33. His M, Dartois L, Fagherazzi G, Associations between serum lipids and breast cancer incidence and survival in the E3N prospective cohort study: Cancer Causes Control, 2017; 28(1); 77-88
34. Zhong S, Zhang X, Chen L, Statin use and mortality in cancer patients: Systematic review and meta-analysis of observational studies: Cancer Treat Rev, 2015; 41(6); 554-67
35. Prentice RL, Caan B, Chlebowski RT, Low-fat dietary pattern and risk of invasive breast cancer: The Women’s Health Initiative Randomized Controlled Dietary Modification Trial: JAMA, 2006; 295(6); 629-42
36. Chlebowski RT, Blackburn GL, Thomson CA, Dietary fat reduction and breast cancer outcome: Interim efficacy results from the Women’s Intervention Nutrition Study: J Natl Cancer Inst, 2006; 98(24); 1767-76
37. Scott E, Daley AJ, Doll H, Effects of an exercise and hypocaloric healthy eating program on biomarkers associated with long-term prognosis after early-stage breast cancer: A randomized controlled trial: Cancer Causes Control, 2013; 24(1); 181-91
38. Swisher AK, Abraham J, Bonner D, Exercise and dietary advice intervention for survivors of triple-negative breast cancer: Effects on body fat, physical function, quality of life, and adipokine profile: Support Care Cancer, 2015; 23(10); 2995-3003
39. Wang T, Fahrmann JF, Lee H, JAK/STAT3-regulated fatty acid β-oxidation is critical for breast cancer stem cell self-renewal and chemoresistance: Cell Metab, 2018; 27(1); 136-50e5
40. Dias AS, Almeida CR, Helguero LA, Duarte IF, Metabolic crosstalk in the breast cancer microenvironment: Eur J Cancer (Oxford, England: 1990), 2019; 121; 154-71
41. Burugu S, Asleh-Aburaya K, Nielsen TO, Immune infiltrates in the breast cancer microenvironment: Detection, characterization and clinical implication: Breast cancer (Tokyo, Japan), 2017; 24(1); 3-15
42. Adams S, Gray RJ, Demaria S, Prognostic value of tumor-infiltrating lymphocytes in triple-negative breast cancers from two phase III randomized adjuvant breast cancer trials: ECOG 2197 and ECOG 1199: J Clin Oncol, 2014; 32(27); 2959-66
43. Loi S, Sirtaine N, Piette F, Prognostic and predictive value of tumor-infiltrating lymphocytes in a phase III randomized adjuvant breast cancer trial in node-positive breast cancer comparing the addition of docetaxel to doxorubicin with doxorubicin-based chemotherapy: BIG 02–98: J Clin Oncol, 2013; 31(7); 860-67
44. Loi S, Michiels S, Salgado R, Tumor infiltrating lymphocytes are prognostic in triple negative breast cancer and predictive for trastuzumab benefit in early breast cancer: Results from the FinHER trial: Ann Oncol, 2014; 25(8); 1544-50
45. Marino N, German R, Rao X, Upregulation of lipid metabolism genes in the breast prior to cancer diagnosis: NPJ Breast Cancer, 2020; 6; 50
46. Tedder TF, Boyd AW, Freedman AS, The B cell surface molecule B1 is functionally linked with B cell activation and differentiation: J Immunol (Baltimore, MD: 1950), 1985; 135(2); 973-79
47. Léveillé C, R AL-D, Mourad W, CD20 is physically and functionally coupled to MHC class II and CD40 on human B cell lines: Eur J Immunol, 1999; 29(1); 65-74
48. Petrie RJ, Deans JP, Colocalization of the B cell receptor and CD20 followed by activation-dependent dissociation in distinct lipid rafts: J Immunol (Baltimore, MD: 1950), 2002; 169(6); 2886-91
49. Kuijpers TW, Bende RJ, Baars PA, CD20 deficiency in humans results in impaired T cell-independent antibody responses: J Clin Invest, 2010; 120(1); 214-22
50. van de Ven AA, Compeer EB, Bloem AC, Defective calcium signaling and disrupted CD20-B-cell receptor dissociation in patients with common variable immunodeficiency disorders: J Allergy Clin Immunol, 2012; 129(3); 755-61e7
51. Milne K, Köbel M, Kalloger SE, Systematic analysis of immune infiltrates in high-grade serous ovarian cancer reveals CD20, FoxP3 and TIA-1 as positive prognostic factors: PLoS One, 2009; 4(7); e6412
52. Mudd TW, Lu C, Klement JD, Liu K, MS4A1 expression and function in T cells in the colorectal cancer tumor microenvironment: Cell Immunol, 2021; 360; 104260
53. Han M, Liew CT, Zhang HW, Novel blood-based, five-gene biomarker set for the detection of colorectal cancer: Clin Cancer Res, 2008; 14(2); 455-60
54. Ali HR, Provenzano E, Dawson SJ, Association between CD8+ T-cell infiltration and breast cancer survival in 12,439 patients: Ann Oncol, 2014; 25(8); 1536-43
55. Oshi M, Asaoka M, Tokumaru Y, CD8 T cell score as a prognostic biomarker for triple negative breast cancer: Int J Mol Sci, 2020; 21(18); 6968
56. Pantelidou C, Sonzogni O, De Oliveria Taveira M, PARP inhibitor efficacy depends on CD8(+) T-cell recruitment via intratumoral STING pathway activation in BRCA-deficient models of triple-negative breast cancer: Cancer Discov, 2019; 9(6); 722-37
57. Savic S, Caseley EA, McDermott MF, Moving towards a systems-based classification of innate immune-mediated diseases: Nat Rev Rheumatol, 2020; 16(4); 222-37
58. Papa R, Penco F, Volpi S, Gattorno M, Actin remodeling defects leading to autoinflammation and immune dysregulation: Front Immunol, 2020; 11; 604206
59. Berry CT, May MJ, Freedman BD, Analysis of calcium control of canonical NF-κB signaling in B lymphocytes: Methods Mol Biol (Clifton, NJ), 2021; 2366; 145-64
Figures
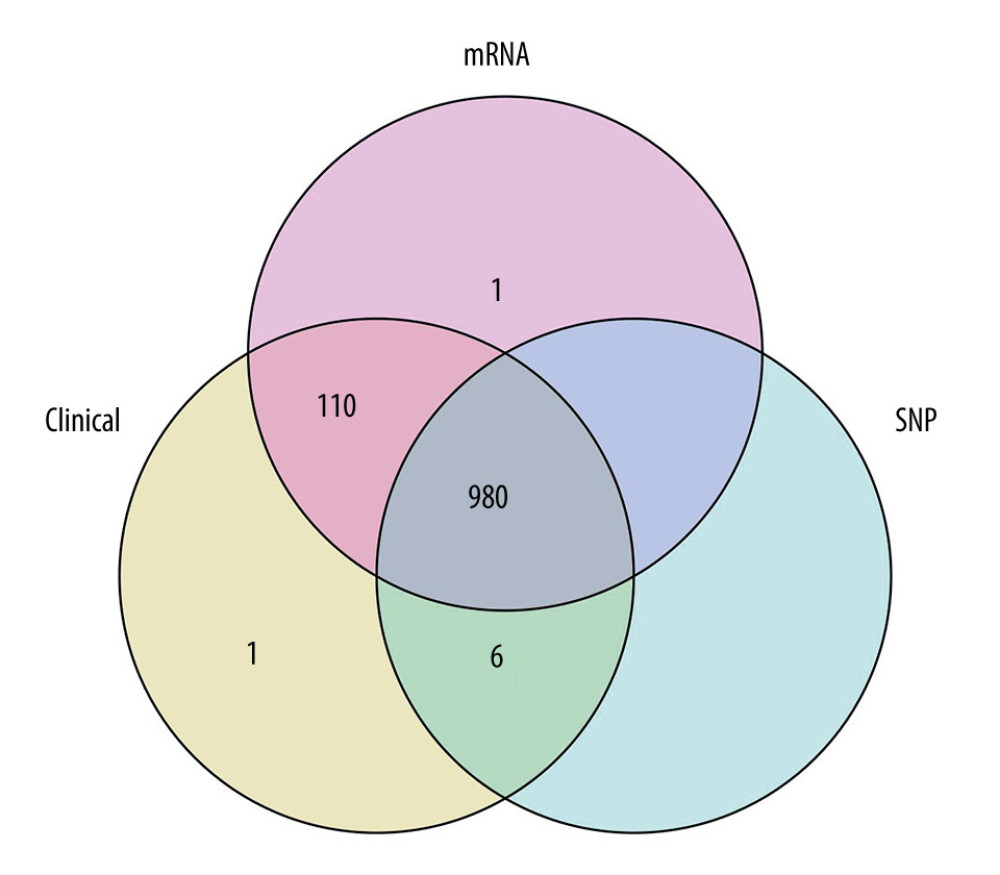 Figure 1. Looking for samples with all 3 pieces of information (mRNA, clinical features, single-nucleotide mutations [SNP]), a total of 980 cases were obtained.
 Figure 2. Four lipid metabolism-related pathways in HALLMARK were used as scoring standards. (A) Using the median value of HALLMARK_CHOLESTEROL_HOMEOSTASIS score as the standard, we performed differential gene expression analysis for the high group and the low group. (B) Using the median value of HALLMARK_ADIPOGENESIS score as the standard, we performed differential gene expression analysis for the high group and the low group. (C) Using the median value of HALLMARK_FATTY_ACID_METABOLISM score as the standard, we performed differential gene expression analysis for the high group and the low group. (D) Using the median value of HALLMARK_BILE_ACID_METABOLISM score as the standard, we performed differential gene expression analysis for the high group and the low group.
 Figure 3. (A) We took the intersection of DEGs in the high-score group and obtained 8 genes. (B) We took the intersection of DEGs in the low-score group and l obtained 9 genes.
 Figure 4. Differences in the expression of 12 genes leading to differences in survival.
 Figure 5. Correlation between 12 genes and 4 scoring pathways. The length of the ribbon indicates the size of the correlation.
 Figure 6. (A) Univariate Cox regression analysis incorporating age, TNM stage, and 12 DEGs into variables. (B) Multivariate Cox regression analysis. Because of the large number of variables, we used forward selection. MS4A1 was the only protective factor.
 Figure 7. (A) Single-nucleotide variation of MS4A1 high-expression group and low-expression group. (B) Transcriptome level results of MS4A1 high-expression group and low-expression group.
 Figure 8. (A) MS4A1 expression in different age groups and among different stage groups. (B) MS4A1 expression among different T (Topography) groups. (C) MS4A1 expression among different M (Metastasis) groups. (D) MS4A1 expression among different N (Lymph Node) groups.
 Figure 9. (A) We used R language with the clusterProfiler package to perform GO enrichment analysis and created a circle graph. (B)4We used R language with the clusterProfiler package to perform KEGG enrichment analysis and created a circle graph.
 Figure 10. (A) We used R language with the GSEA package to perform GO enrichment analysis. (B, C) We used R language with the GSEA package to perform HALLMARK enrichment analysis. (D) We used R language with the GSEA package to perform KEGG enrichment analysis.
 Figure 11. (A) T cell-related pathways in GOBP enrichment analysis. (B) B cell-related pathways in GOBP enrichment analysis. (C) NK cell-related pathways in GOBP enrichment analysis. (D) We used Cytoscape software to perform sub-network analysis of GOBP enrichment analysis results. The first and third sub-networks are related to immune function, the second sub-network is related to calcium channels, while the fourth is relate to cytoskeleton.
 Figure 12. (A) We used the CIBERSORT algorithm to explore the relationship between the expression of MS4A1 and the immune microenvironment, and 22 kinds of immune cell profiles in BRCA samples were constructed. (B) Correlation between immune cells. (C) Correlation between 22 kinds of immune cell profiles and MS4A1.
 Figure 13. (A) Differences in immune cells infiltrate between MS4A1 high-expression group and low-expression group. (B) Intersection of immune cells related to MS4A1 and differences in expression.
 In Press
07 Mar 2024 : Clinical Research
Knowledge of and Attitudes Toward Clinical Trials: A Questionnaire-Based Study of 179 Male Third- and Fourt...Med Sci Monit In Press; DOI: 10.12659/MSM.943468
08 Mar 2024 : Animal Research
Modification of Experimental Model of Necrotizing Enterocolitis (NEC) in Rat Pups by Single Exposure to Hyp...Med Sci Monit In Press; DOI: 10.12659/MSM.943443
18 Apr 2024 : Clinical Research
Comparative Analysis of Open and Closed Sphincterotomy for the Treatment of Chronic Anal Fissure: Safety an...Med Sci Monit In Press; DOI: 10.12659/MSM.944127
08 Mar 2024 : Laboratory Research
Evaluation of Retentive Strength of 50 Endodontically-Treated Single-Rooted Mandibular Second Premolars Res...Med Sci Monit In Press; DOI: 10.12659/MSM.944110
Most Viewed Current Articles
17 Jan 2024 : Review article
Vaccination Guidelines for Pregnant Women: Addressing COVID-19 and the Omicron VariantDOI :10.12659/MSM.942799
Med Sci Monit 2024; 30:e942799
14 Dec 2022 : Clinical Research
Prevalence and Variability of Allergen-Specific Immunoglobulin E in Patients with Elevated Tryptase LevelsDOI :10.12659/MSM.937990
Med Sci Monit 2022; 28:e937990
16 May 2023 : Clinical Research
Electrophysiological Testing for an Auditory Processing Disorder and Reading Performance in 54 School Stude...DOI :10.12659/MSM.940387
Med Sci Monit 2023; 29:e940387
01 Jan 2022 : Editorial
Editorial: Current Status of Oral Antiviral Drug Treatments for SARS-CoV-2 Infection in Non-Hospitalized Pa...DOI :10.12659/MSM.935952
Med Sci Monit 2022; 28:e935952


