08 February 2023: Database Analysis
High SPATA18 Expression and its Diagnostic and Prognostic Value in Clear Cell Renal Cell Carcinoma
Xie Lingui1ACE, Liu Weifeng1BC, Wang Yufei1B, Zhou Yibin1AFG*DOI: 10.12659/MSM.938474
Med Sci Monit 2023; 29:e938474


Abstract
BACKGROUND: SPATA18 (spermatogenesis-associated 18, also called Mieap) encodes a protein that can induce lysosome-like organelles within mitochondria, which plays an important role in tumor growth. We measured the expression of SPATA18 in ccRCC, and assessed its diagnostic and prognostic clinical value in patients with clear cell renal cell carcinoma (ccRCC).
MATERIAL AND METHODS: We analyzed SPATA18 expression using data from the TCGA-KIRC cohort, GEO database, and UALCAN database. Immunohistochemistry was carried out to verify the expression in the ccRCC patients. The diagnostic value of SPATA18expression was evaluated by a receiver operating characteristic (ROC) curve. The correlation between clinical characteristics and SPATA18 expression was calculated by chi-square test. The prognostic value of SPATA18 expression was assessed by Kaplan-Meier analysis and Cox analysis. We conducted gene set enrichment analysis (GSEA) using TCGA database.
RESULTS: SPATA18 gene exhibited a higher expression in ccRCC tissues than in normal tissues. SPATA18 showed a substantial diagnostic value in ccRCC. SPATA18 expression was correlated with histological grade, clinical stage, T classification, and distant metastasis of ccRCC. Furthermore, high SPATA18 expression was associated with favorable overall survival. Multivariate analysis showed that SPATA18 was an independent risk factor for ccRCC. Gene set enrichment analysis (GSEA) showed that B cell receptors, WNT targets, extracellular matrix, oxidative phosphorylation, calcium metabolism, iron uptake and transport, potassium channels, and insulin receptor were differently enriched in the phenotype that was negatively correlated with SPATA18.
CONCLUSIONS: Our study indicated that high SPATA18 expression in ccRCC was associated with a good prognosis, and it could be a positive prognostic biomarker for ccRCC.
Keywords: Carcinoma, Renal Cell, Computational Biology, Prognosis, SPATA18 Protein, Human, Humans, Kaplan-Meier Estimate, Kidney Neoplasms, Mitochondrial Proteins
Background
Renal cell carcinoma, the third most common malignancy of the urinary system, caused 179 000 deaths among more than 431 000 new cases of kidney cancer worldwide in 2020 [1].
Clear cell renal cell carcinoma is the main histological subtype of renal carcinoma [2–4]; 30–40% of cases had metastases at the time of diagnosis [5], and the 5-year survival rate for metastatic patients is only 8–11.7% [6]. In treatment of metastatic renal cell carcinoma, ccRCC is prone to resistance to radiation, cytotoxicity, and hormone therapy, and the effect of targeted therapy is more obvious than that of radiotherapy, chemotherapy, and immunotherapy [7–9]. Genetic markers play an important role in judging tumorigenesis and predicting treatment effects, serving as drug targets and predicting survival [9–13]. Due to the better efficacy of targeted therapy and rapid advances in sequencing technology, a growing body of research has focused on looking for new and effective tumor genetic markers to treat ccRCC [14–17].
Spermatogenesis-associated 18 (SPATA18, also referred to as Mieap), a p53-inducible protein, participates in the mitochondrial quality control process by inducing lysosome-like organelles within mitochondria that eliminate oxidized mitochondrial proteins [18–20]. It is reported that disordered mitochondrial quality control is related to cancer and degenerative disease [21,22]. Not surprisingly, later studies have shown that SPATA18 plays an important role in mitochondrial autophagy [18,23]. Recent studies have increasingly concentrated on the relationship with tumorigenesis [24,25]. Experiments on mice showed that SPATA18 is involved in regulating intestinal tumors through mitochondrial quality control [20]. In breast cancer, colorectal cancer, and bronchial carcinoma, SPATA18 acts as an oncogene or tumor suppressor gene that is associated with a better prognosis [25,26]. However, the potential relationship between SPATA18 and ccRCC has been unclear.
In this study, by mining the TCGA and GEO databases, we found that SPATA18, as a protein-encoding gene fragment, has value in the diagnosis and prognosis of ccRCC.
Material and Methods
BIOINFORMATICS AND DATA MINING OF SPATA18:
The transcriptome data of diverse tumor tissues were downloaded from The Cancer Genome Atlas (TCGA database,
All statistical analysis and data visualization was made using R studio (v.3.6.3). The ROC curve was generated to illustrate the diagnostic value by using the pROC package. The correlations between clinical characteristics and SPATA18 expression were calculated by chi-square test. To analyze the prognostic value of SPATA18 mRNA expression in ccRCC, we used the packages ‘Survival’ and ‘SurvMiner’ of R software to perform Kaplan-Meier analysis and multivariate Cox analysis with the data downloaded from the TCGA database. Statistical significance was defined as
We performed GSEA analysis to assess the correlations between SPATA18 expression and all genes by using the cluster Profiler package. It was considered to be of statistical significance when |ES|>1,
IMMUNOHISTOCHEMISTRY (IHC):
The paraffin sections were baked at 60°C for 30 min and soaked twice in xylene solution for 15 min each time, then they were soaked in a xylene ethanol mixture (1: 1 ratio), anhydrous ethanol, 95% ethanol, 85% ethanol, 75% ethanol, and distilled water for 10 min each, then the slices were placed in antigen repair solution for 20 min 2 times and soaked in distilled water for 10 min. We washed the carrier twice in TBS solution containing 0.025%TritonX-100 for 5 min each time. After that, the slices were sealed in TBS solution containing 10% normal serum and 1% BSA at room temperature for 2 h. We removed the liquid and then wiped the carrier. The anti-SPATA18 monoclonal antibody was diluted 100-fold (Abcam, EPR13704) and incubated overnight at 4°C. The carrier was washed twice in TBS solution containing 0.025%TritonX-100 and stirred gently for 5 min each time. The second antibody was diluted with TBS solution containing 1% BSA, and the second antibody was coated on the carrier and incubated at room temperature for 1 h, then incubated at room temperature with Streptomyces avidin-peroxidase solution for 10 min. This was followed by rinsing for 5 min, staining with hematoxylin for 30 s, rinsing again with distilled water, dehydration, and cleaning. Neutral gum was used for sealing. Then we observed the slides and recorded the expression of SPATA18 under an optical microscope (Leica, Germany). We considered the proportion and intensity of positive staining of tumor cells. The positivity proportion was scored from 0 to 3 based on its proportion percentage. The staining intensity was divided into 4 groups: no staining, weak staining, moderate staining, and strong staining, scored as 0–3, respectively. Double-blind method was used for evaluation of percent positivity and staining intensity. The final staining score of SPATA18 was summed by the score for intensity and proportion. A final score of <4 was regarded as weak and a final staining score of ≥4 was regarded as strong.
Results
THE CHARACTERISTIC OF CCRCC PATIENTS:
The clinical and gene expression data, including age, sex, grade, stage, T classification, lymph nodes, distant metastasis, and survival status, were obtained from the TCGA database (Table 1).
SPATA18 EXPRESSION IN CCRCC PATIENTS:
Firstly, we used data from TCGA to analyze the expression of the SPATA18 at the transcriptome level. The result showed that the expression of SPATA18 gene in ccRCC tissues was clearly higher than in tissues adjacent tumors, both in the paired and unpaired groups (P=3.7e-27, P=7.3e-22, respectively) (Figure 1). Secondly, we analyzed the SPATA18 mRNA expression level in different subgroups. In the results, T classification, clinical stage, distant metastasis and histological grade showed a difference. With the increase of T stage, the SPATA18 mRNA expression level decreased in ccRCC patients. We also observed that patients with lower histological grades showed a higher SPATA18 mRNA expression than did patients with high histological grades (P=2.2e-09), and patients with no distant metastasis had higher SPATA18 mRNA expression than positive patients. The SPATA18 mRNA expression was lower in high-grade groups (G3/G4) than in low-grade groups (G1/G2) (P=9.7e-07) (Figure 2A–2D).
VALIDATION OF SPATA18 MRNA EXPRESSION AND PROTEIN EXPRESSION IN CCRCC:
The GSE 53757 dataset chosen from the GEO database was used to calculate the SPATA18 mRNA expression, showing that SPATA18 mRNA expression was higher in ccRCC than in normal tissues. The SPATA18 protein expression was analyzed by data from the UALCAN database, showing that the SPATA18 protein was highly expressed in ccRCC tissues (P=7.9e-65) (Figure 3).
Immunohistochemistry was carried out to verify the SPATA18 gene expression in ccRCC patients. We collected some specimens from the Second Affiliated Hospital of Soochow University, and all the patients provided informed consent. Most lesions of ccRCC patients (15/21, 71.4%) exhibited high SPATA18 expression in CRC cells (Table 2), showing that the expression of SPATA18 was obviously higher than in tumor-adjacent tissues in the ccRCC patients (Figure 4).
CORRELATION BETWEEN CLINICAL CHARACTERISTICS AND SPATA18 EXPRESSION IN CCRCC:
The correlation between clinical characteristics and SPATA18 expression was calculated by chi-square test. We divided patients into high and low groups according to the expression of SPATA18 mRNA. Our data analysis showed that high SPATA18 mRNA expression was correlated with T classification, survival status, histological grade, distant metastasis, and pathologic stage (P<0.05) (Table 3).
DIAGNOSTIC VALUE OF SPATA18 EXPRESSION IN CCRCC:
We evaluated the value of SPATA18 expression in diagnosis by drawing a receiver operating characteristic (ROC) curve, and the area under the curve (AUC) of SPATA18 was 0.890. The ROC curve of SPATA18 mRNA expression in different stages was also analyzed, and the AUC values for stage I, II, and III were 0.940, 0.850, and 0.851 respectively, which shows good diagnostic value (Figure 5).
HIGH EXPRESSION OF SPATA18 IS AN INDEPENDENT PREDICTOR OF OVERALL SURVIVAL OF PATIENTS WITH CCRCC:
The prognostic value of SPATA18 expression was assessed by Kaplan-Meier analysis and Cox analysis, revealing that patients with a higher SPATA18 mRNA expression had better overall survival. In subgroup analysis, the overall survival in groups of T1/T2, T3/T4 stages, distant metastasis, histological grade G3/G4, and clinical stage showed a significant difference (Figure 6). According to the univariate analysis, in factors of age, stage, grade, distant metastasis, and positive lymph nodes, the SPATA18 mRNA expression was correlated with overall survival (Table 3). Multivariate analysis showed that high expression of SPATA18 is an independent predictor of overall survival of patients with ccRCC (Table 4).
GENE SET ENRICHMENT ANALYSIS (GSEA) SHOWED SOME POSSIBLE SIGNAL PATHWAYS:
Using GSEA, we searched for signaling pathways related to ccRCC. We found that for WNT targets, oxidative phosphorylation, calcium metabolism, iron uptake and transport, potassium channels, and insulin receptor, there were negative correlations between differential enrichment and SPATA18 mRNA expression phenotype (Table 5, Figure 7).
Discussion
SPATA18 was proved to be related to the quality and quantity of mitochondria [18]. Later studies have shown that it is a downstream gene of p53 [27]. With the discovery of the relationship between mitochondrial autophagy and cancer, research on SPATA18 has shifted to its association with various cancers. So far, it has been confirmed that the gene SPATA18 has an important role in breast cancer and colorectal cancer [20,26,27]. In the literature on the prognostic model of ccRCC, SPATA18 has been found to play a prognostic role in ccRCC [28]. To further study the value of SPATA18 in clear cell renal cell carcinoma, we carried out this study. Our research showed that the expression of SPATA18mRNA in ccRCC tissues was higher than that in normal tissues. The high expression of SPATA18mRNA was related to survival status, distant metastasis, clinical stage, T stage, and histological grade. In addition, high expression of SPATA18mRNA is associated with good overall survival. SPATA18 is an independent prognostic factor for ccRCC and has potential diagnostic value.
In previous studies, the expression of SPATA18 in esophageal cancer, colon cancer, breast cancer, and other cancer tissues was down-regulated compared with normal tissues [24–26]. However, in our research, the expression of SPATA18 was significantly up-regulated in ccRCC tissues (Figure 1). Moreover, analysis of the protein expression level of SPATA18 in the UALCAN database also showed that SPATA18 protein was highly expressed in ccRCC tissues (Figure 3). This shows that the expression of SPATA18 in ccRCC tissues is higher than that in normal tissues at both gene and protein levels. Based on the literature review, we further analyzed the cause of this phenomenon, finding that there are many fat droplets in renal clear cell carcinoma tissue [29] that do not exist in other cancer tissues [30], and we found that ROS (reactive oxygen species, mainly produced in and targeted at mitochondria [31]) was accumulated in ccRCC cells [23]. When ROS accumulation and a large number of lipids exist at the same time, the level is subsequently elevated, and lipid ROS causes damage to various biofilms [32], including mitochondrial membranes [30,32–34]. The damage and cleavage of mitochondria need to be repaired and cleared. SPATA18 is involved in the quality control of mitochondria [19,23] since that the expression of SPATA18 in ccRCC is higher than in normal tissues.
In our study, ROC analysis showed that SPATA18 had good diagnostic value in all stages of ccRCC, and multivariate correlation analysis also presented that SPATA18 was an independent prognostic factor for ccRCC. This provides evidence that SPATA18 is a promising biomarker for the diagnosis of renal cell carcinoma.
Although SPATA18 is highly expressed in ccRCC tissues, the results of prognostic correlation analysis show that high expression of SPATA18 in ccRCC tissues is associated with a better prognosis. This is consistent with the research results of other cancers. In Hitoya Sano’s study, the expression of SPATA18 was related to a good prognosis of gastric and esophageal cancer, and SPATA18 immunohistochemistry predicted the prognosis of patients with gastric and esophageal cancer [25]. In breast cancer, P53/SPATA18 mitochondrial quality control has a critical tumor-suppressive role [27]. In colorectal cancer, SPATA18 acts as a tumor-suppressor gene by repairing or eliminating unhealthy mitochondria [24], and SPATA18 probably also acts as a tumor suppressor in ccRCC and is linked to a favorable prognosis.
To further explore the related mechanisms between the expression of SPATA18 and the clinical prognosis of ccRCC, we carried out Gene Set Enrichment Analysis (GSEA). The results showed that pathways such as iron uptake and transport, calcium metabolism, oxidative phosphorylation, and WNT targets are probably involved in SPATA18 expression and may be involved in ferroptosis or mitophagy. Xiu liDan and others have revealed that the expression of SPATA18 is closely related to mitochondrial quality control, which can improve intracellular ROS accumulation and plays an integral part in its metabolism [24]. Ferroptosis occurs when the accumulation of lipid ROS causes cell death [33,35]. Therefore, the high expression of SPATA18 may help to reduce the level of ROS, regulating mitophagy and participating in DNA damage repair to prevent cell carcinogenesis, and P53/SPATA18 inhibits tumor growth through ROS response and ferroptosis.
In summary, this study verified the diagnostic and prognostic value of SPATA18 expression in ccRCC. SPATA18 may also be used as a tumor suppressor, and its high expression is beneficial to the prognosis of ccRCC. Although immunohistochemistry has elucidated the phenomenon of increased SPATA18 expression, further research is needed to determine the mechanisms involved.
Conclusions
In this study, we found that the expression of SPATA18 in ccRCC patients was up-regulated, and the expression level of SPATA18 decreased gradually with the progression of ccRCC. In any stage, the prognosis of patients with high expression of SPATA18 was significantly better than in those with low expression. It is also an independent prognostic factor in ccRCC.
Figures
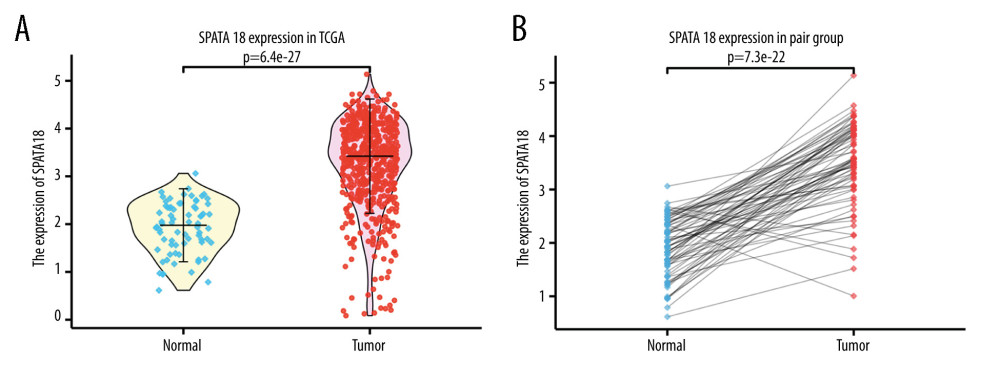 Figure 1. SPATA18 mRNA expression in ccRCC patients. (A) Normal tissues and tumor tissues(P=3.7e-27). (B) Expression in ccRCC tissues and adjacent tissues (P=7.3e-22) (R studio, version 3.6.3).
 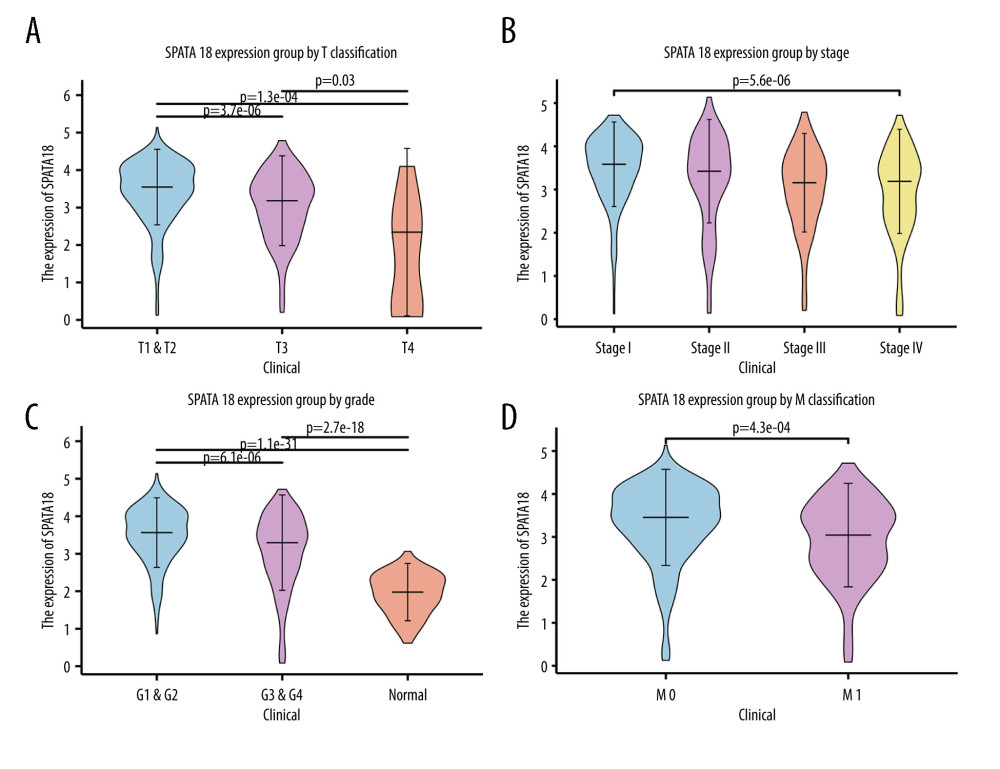 Figure 2. Association with SPATA18 mRNA expression and clinicopathologic characteristics. (A) T classification, (B) Clinical stage, (C) Histologic grade, (D) Distant metastasis (R studio, version 3.6.3).
 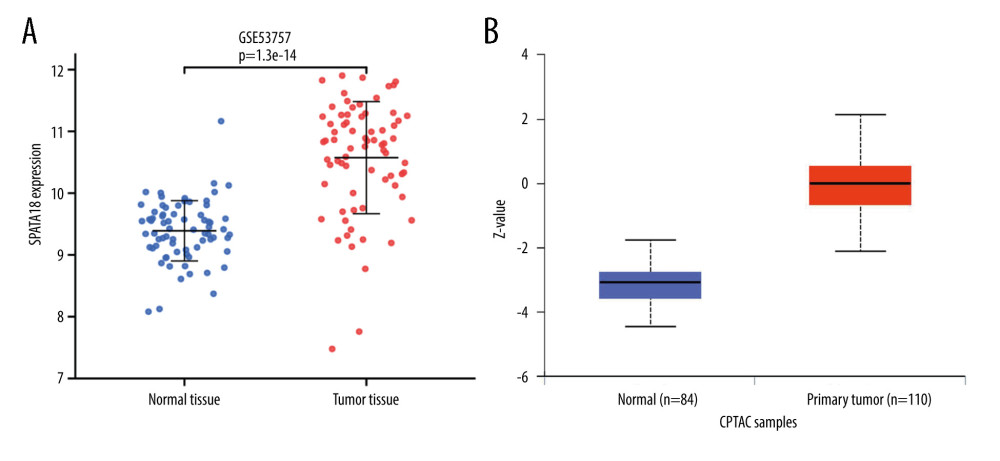 Figure 3. SPATA18 mRNA expression in GSE 53757 and SPATA18 protein expression in ccRCC and normal tissues (A was plotted using R studio, version 3.6.3; B was plotted using Ualcan’s analysis tools.)
 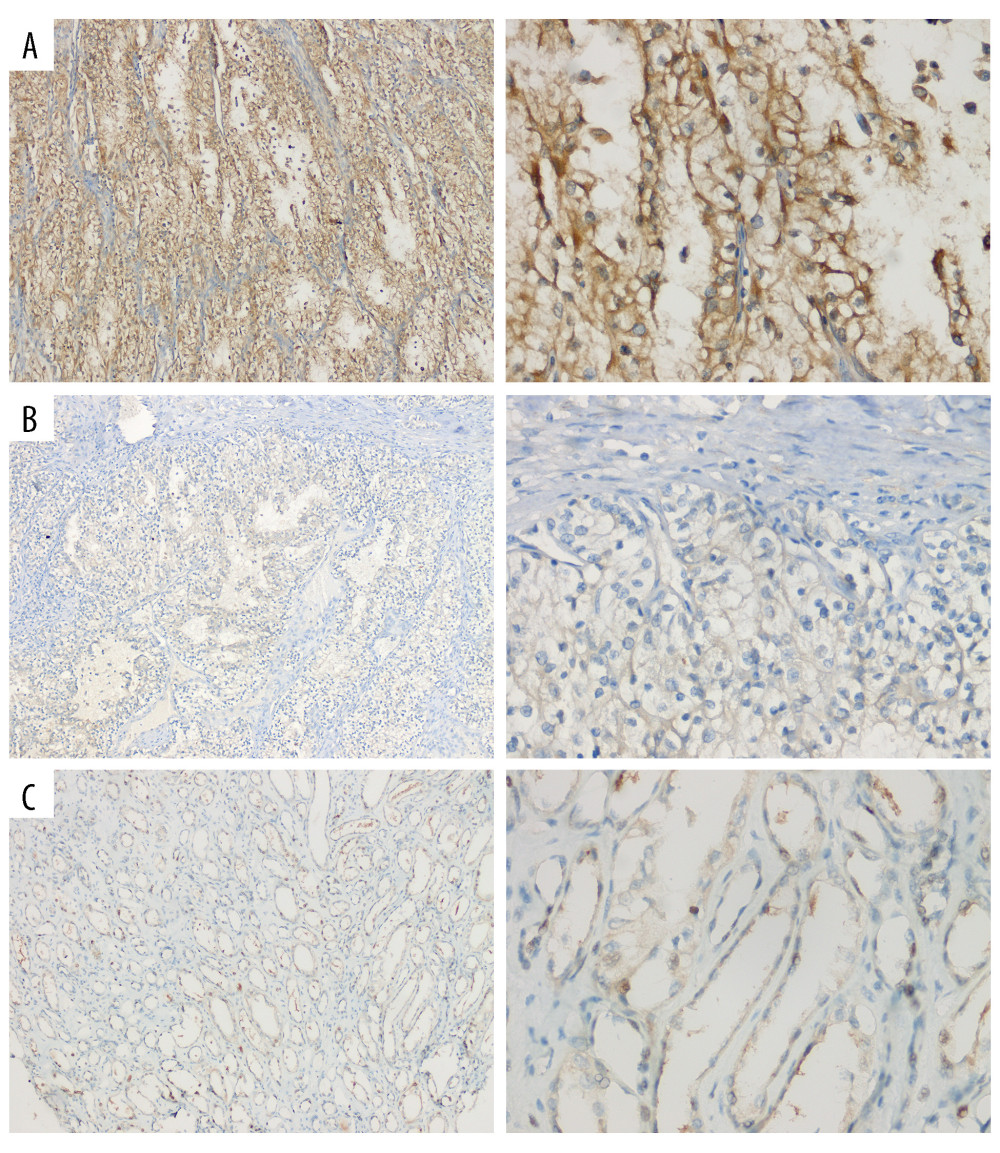 Figure 4. Representative HE staining and immunostaining images of SPATA18. (A) Strong SPATA18 expressed in the tumor tissues of ccRCC patients. (B) Weak SPATA18 expressed in the tumor tissues of ccRCC patients. (C) SPATA18 expressed in the adjacent tissues of ccRCC patients. The pictures were microphotographed (Leica, Germany) and processed using WPS Office (version 11.1.0.12132). Left side is 100 magnification and right side is 400 magnification.
 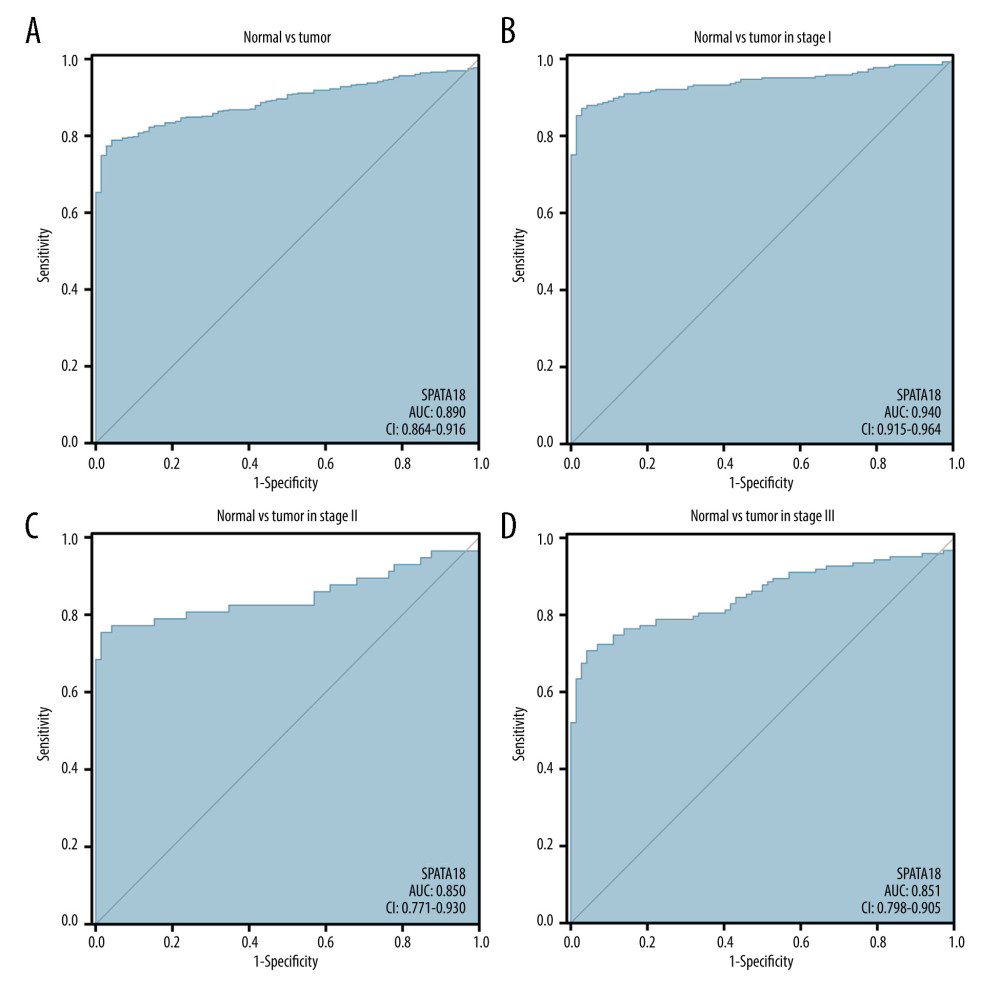 Figure 5. ROC curve of SPATA18 mRNA expression in ccRCC cohort. (A) ROC curve of SPATA18 mRNA expression in normal and tumor tissues, (B–D) Subgroup analysis for stage I, II, and III, respectively (R studio, version 3.6.3).
 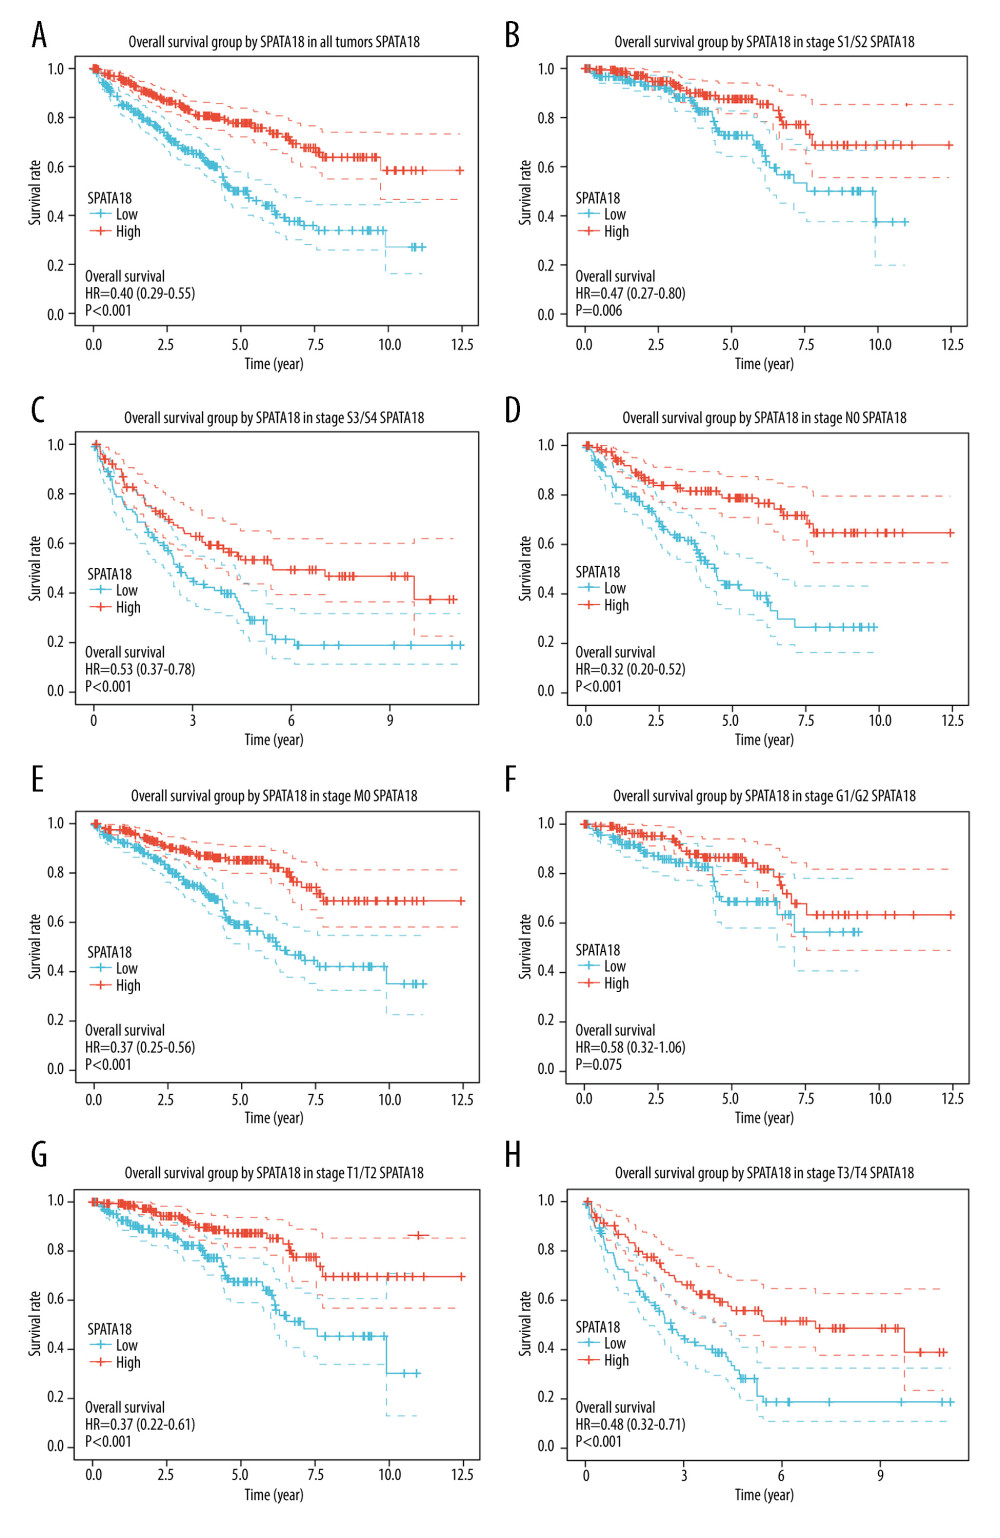 Figure 6. Overall survival analysis with SPATA18 mRNA expression. (A) Kaplan-Meier curves for overall survival in ccRCC for all cases, (B) clinical stage I/II, (C) clinical stage III/IV, (D) N0, (E) M0, (F) G1/G2, (G) T1/T2, (H) T3/T4 (R studio, version 3.6.3).
 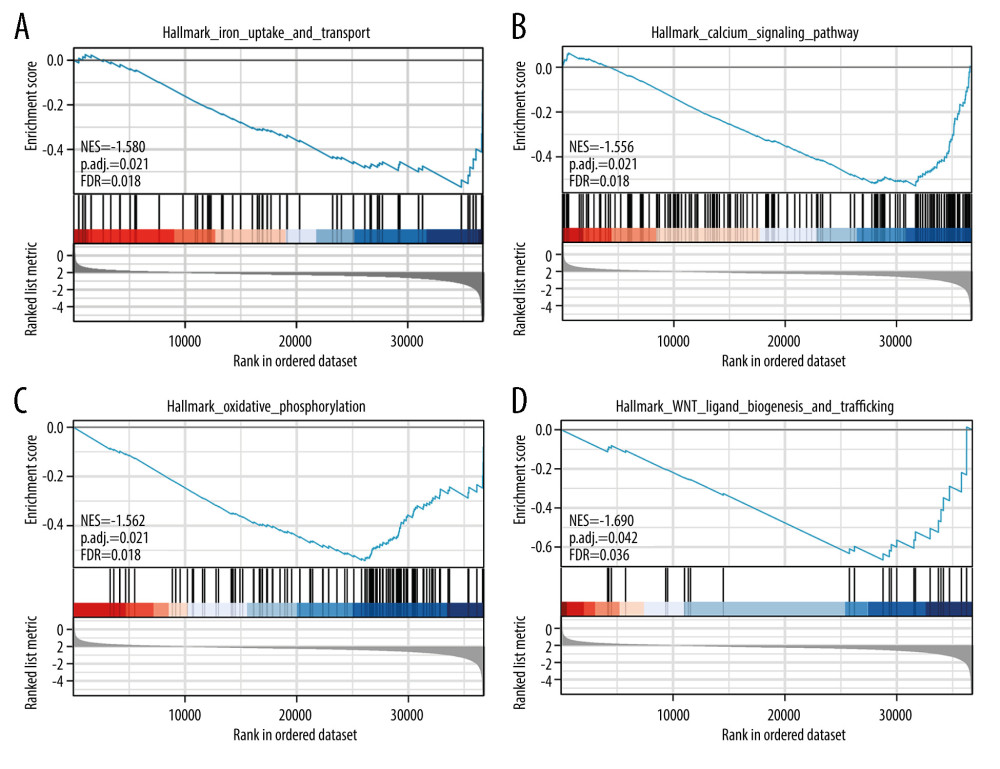 Figure 7. Enrichment plots by GSEA. (A) Iron uptake and transport, (B) Calcium signaling pathway (C) Oxidative phosphorylation, (D) WNT ligand biogenesis and trafficking (R studio, version 3.6.3).
 Tables
Table 1. Clinical characteristics of the ccRCC patients.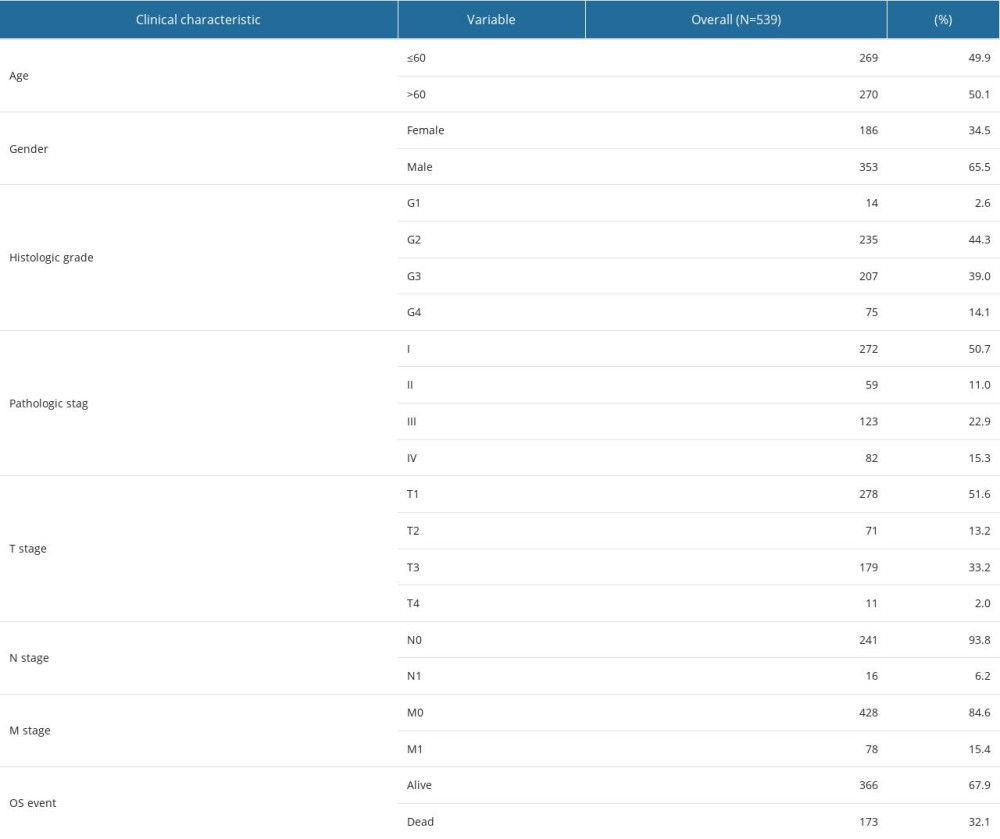 Table 2. Characteristics of renal cell carcinoma classified by SPATA18 expression.
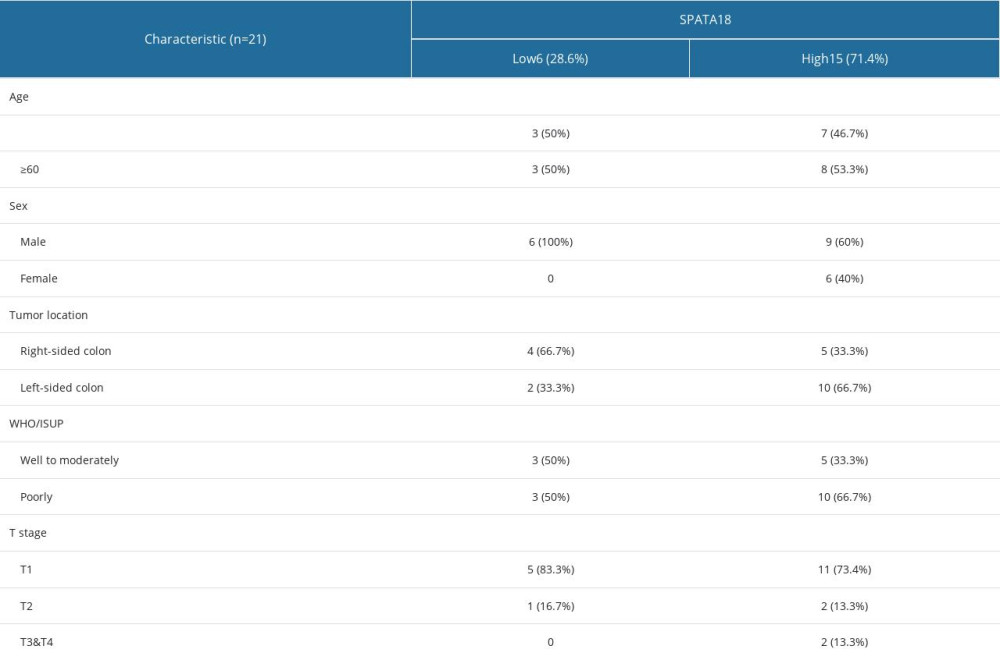 Table 3. Relationship between SPATA18 mRNA expression and clinical characteristics in ccRCC.
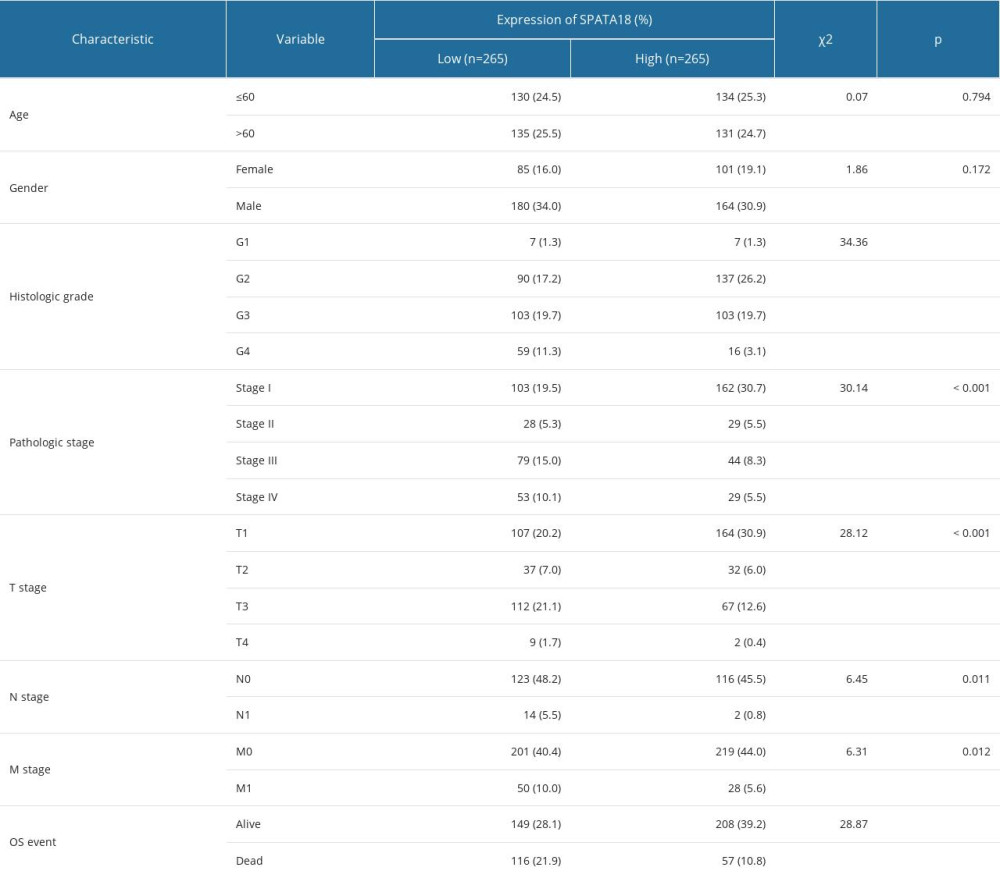 Table 4. Correlations between overall survival and mRNA expression of SPATA18 analyzed by univariate and multivariate Cox regression.
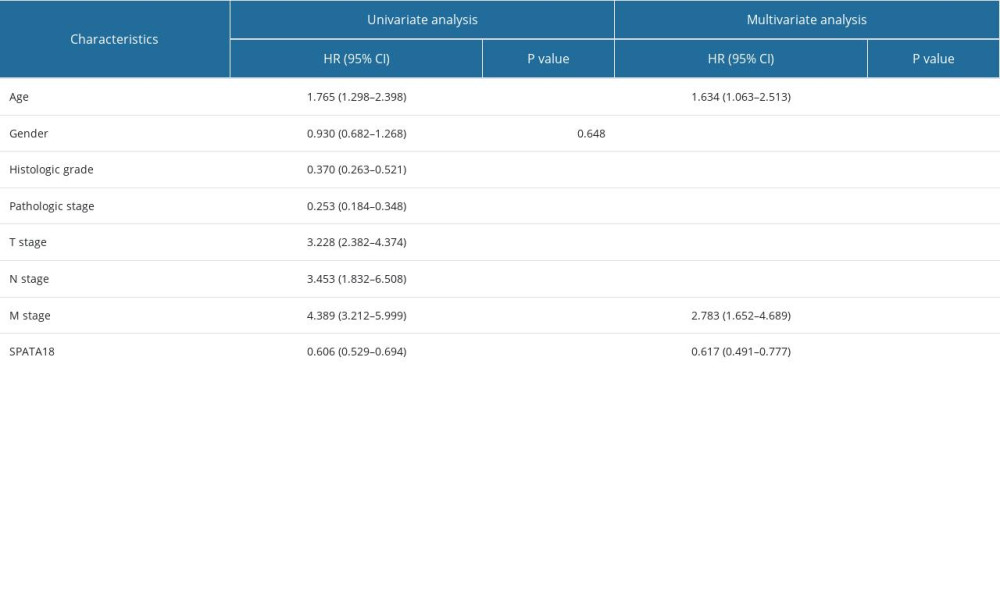 Table 5. Gene sets enriched in negatively correlated with SPATA18 mRNA expression phenotype.
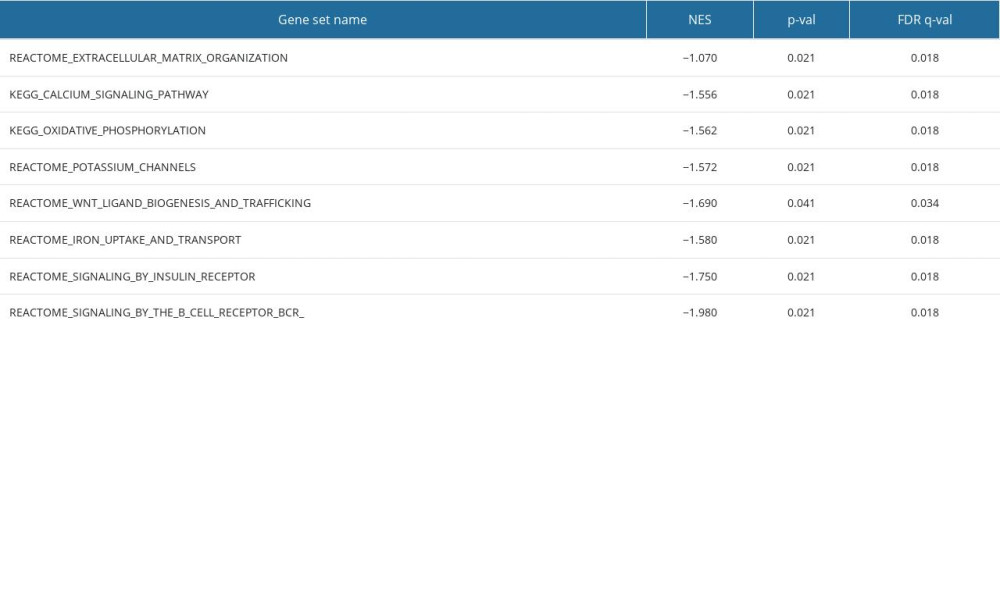
References
1. Sung H, Ferlay J, Siegel RL, Global cancer statistics 2020: GLOBOCAN estimates of incidence and mortality worldwide for 36 cancers in 185 countries: Cancer J Clin, 2021; 71(3); 209-49
2. Mitchell TJ, Turajlic S, Rowan ATRACERx Renal Consortium, Timing the landmark events in the evolution of clear cell renal cell cancer: TRACERx renal: Cell, 2018; 173(3); 611-23e17
3. Hoefflin R, Harlander S, Schäfer S, HIF-1α and HIF-2α differently regulate tumour development and inflammation of clear cell renal cell carcinoma in mice: Nat Commun, 2020; 11(1); 4111
4. Clark DJ, Dhanasekaran SM, Petralia FClinical proteomic tumor analysis consortium, integrated proteogenomic characterization of clear cell renal cell carcinoma: Cell, 2019; 179(4); 964-83e31 [Erratum in: Cell. 2020;180(1): 207]
5. Hashimoto S, Mikami S, Sugino H, Lysophosphatidic acid activates Arf6 to promote the mesenchymal malignancy of renal cancer: Nat Commun, 2016; 7; 10656
6. Courtney KD, Infante JR, Lam ET, Phase I dose-escalation trial of PT2385, a first-in-class hypoxia-inducible factor-2α antagonist in patients with previously treated advanced clear cell renal cell carcinoma: J Clin Oncol, 2018; 36(9); 867-74
7. Ruan H, Li S, Bao L, Zhang X, Enhanced YB1/EphA2 axis signaling promotes acquired resistance to sunitinib and metastatic potential in renal cell carcinoma: Oncogene, 2020; 39(38); 6113-28 [Erratum in: Oncogene. 2022 [Online ahead of print]]
8. Koh MY, Nguyen V, Lemos R, Hypoxia-induced SUMOylation of E3 ligase HAF determines specific activation of HIF2 in clear-cell renal cell carcinoma: Cancer Res, 2015; 75(2); 316-29
9. Cowman SJ, Fuja DG, Liu XD, Macrophage HIF-1α is an independent prognostic indicator in kidney cancer: Clin Cancer Res, 2020; 26(18); 4970-82 [Erratum in: Clin Cancer Res. 2021;27(11): 3265]
10. Liao L, Zhang L, Yang M, Expression profile of SYNE3 and bioinformatic analysis of its prognostic value and functions in tumors: J Transl Med, 2020; 18(1); 355
11. Pili R, Quinn DI, Hammers HJ, Immunomodulation by entinostat in renal cell carcinoma patients receiving high-dose interleukin 2: A multicenter, single-arm, phase I/II trial (NCI-CTEP#7870): Clin Cancer Res, 2017; 23(23); 7199-208
12. Shuch B, Agochukwu N, Ricketts CJ, Vascular endothelial growth factor receptor-targeted therapy in succinate dehydrogenase C kidney cancer: J Clin Oncol, 2016; 34(9); e76-79
13. Heyer EE, Deveson IW, Wooi D, Diagnosis of fusion genes using targeted RNA sequencing: Nat Commun, 2019; 10(1); 1388 [Erratum in: Nat Commun. 2020;11(1): 1810]
14. Haake SM, Li J, Bai Y, Tyrosine kinase signaling in clear cell and papillary renal cell carcinoma revealed by mass spectrometry-based phosphotyrosine proteomics: Clin Cancer Res, 2016; 22(22); 5605-16
15. Guo J, Chakraborty AA, Liu P, pVHL suppresses kinase activity of Akt in a proline-hydroxylation-dependent manner: Science, 2016; 353(6302); 929-32
16. Kamaly N, He JC, Ausiello DA, Farokhzad OC, Nanomedicines for renal disease: Current status and future applications: Nat Rev Nephrol, 2016; 12(12); 738-53
17. Dugger SA, Platt A, Goldstein DB, Drug development in the era of precision medicine: Nat Rev Drug Discov, 2018; 17(3); 183-96
18. Kitamura N, Nakamura Y, Miyamoto Y, Mieap, a p53-inducible protein, controls mitochondrial quality by repairing or eliminating unhealthy mitochondria: PLoS One, 2011; 6(1); e16060
19. Nakamura Y, Kitamura N, Shinogi D, BNIP3 and NIX mediate Mieap-induced accumulation of lysosomal proteins within mitochondria: PLoS One, 2012; 7(1); e30767
20. Tsuneki M, Nakamura Y, Kinjo T, Mieap suppresses murine intestinal tumor via its mitochondrial quality control: Sci Rep, 2015; 5; 12472
21. Zheng H, Yu WM, Shen J, Mitochondrial oxidation of the carbohydrate fuel is required for neural precursor/stem cell function and postnatal cerebellar development: Sci Adv, 2018; 4(10); eaat2681
22. Shi H, Rampello AJ, Glynn SE, Engineered AAA+ proteases reveal principles of proteolysis at the mitochondrial inner membrane: Nat Commun, 2016; 7; 13301
23. Dan X, Babbar M, Moore A, DNA damage invokes mitophagy through a pathway involving Spata18: Nucleic Acids Res, 2020; 48(12); 6611-23
24. Sugimura-Nagata A, Koshino A, Nagao K, SPATA18 expression predicts favorable clinical outcome in colorectal cancer: Int J Mol Sci, 2022; 23(5); 2753
25. Sano H, Futamura M, Gaowa S, p53/Mieap-regulated mitochondrial quality control plays an important role as a tumor suppressor in gastric and esophageal cancers: Biochem Biophys Res Commun, 2020; 529(3); 582-89
26. Gaowa S, Futamura M, Tsuneki M, Possible role of p53/Mieap-regulated mitochondrial quality control as a tumor suppressor in human breast cancer: Cancer Sci, 2018; 109(12); 3910-20
27. Futamura M, Tokumaru Y, Takabe K, MIEAP, a p53-downstream gene, is associated with suppression of breast cancer cell proliferation and better survival: Am J Cancer Res, 2021; 11(12); 6060-73
28. Peng Q, Shen Y, Fu K, Artificial intelligence prediction model for overall survival of clear cell renal cell carcinoma based on a 21-gene molecular prognostic score system: Aging, 2021; 13(5); 7361-81
29. Ericsson JL, Seljelid R, Orrenius S, Comparative light and electron microscopic observations of the cytoplasmic matrix in renal carcinomas: Virchows Arch Pathol Anat Physiol Klin Med, 1966; 341(3); 204-23
30. Du W, Zhang L, Brett-Morris A, HIF drives lipid deposition and cancer in ccRCC via repression of fatty acid metabolism: Nat Commun, 2017; 8(1); 1769
31. Vidimar V, Gius D, Chakravarti D, Dysfunctional MnSOD leads to redox dysregulation and activation of prosurvival AKT signaling in uterine leiomyomas: Sci Adv, 2016; 2(11); e1601132
32. Botting KJ, Skeffington KL, Niu Y, Translatable mitochondria-targeted protection against programmed cardiovascular dysfunction: Sci Adv, 2020; 6(34); eabb1929
33. Zhang Y, Shi J, Liu X, BAP1 links metabolic regulation of ferroptosis to tumour suppression: Nat Cell Biol, 2018; 20(10); 1181-92
34. Kong H, Reczek CR, McElroy GS, Metabolic determinants of cellular fitness dependent on mitochondrial reactive oxygen species: Sci Adv, 2020; 6(45); eabb7272
35. Verma N, Vinik Y, Saroha A, Synthetic lethal combination targeting BET uncovered intrinsic susceptibility of TNBC to ferroptosis: Sci Adv, 2020; 6(34); eaba8968
Figures
Figure 1. SPATA18 mRNA expression in ccRCC patients. (A) Normal tissues and tumor tissues(P=3.7e-27). (B) Expression in ccRCC tissues and adjacent tissues (P=7.3e-22) (R studio, version 3.6.3).Figure 2. Association with SPATA18 mRNA expression and clinicopathologic characteristics. (A) T classification, (B) Clinical stage, (C) Histologic grade, (D) Distant metastasis (R studio, version 3.6.3).Figure 3. SPATA18 mRNA expression in GSE 53757 and SPATA18 protein expression in ccRCC and normal tissues (A was plotted using R studio, version 3.6.3; B was plotted using Ualcan’s analysis tools.)Figure 4. Representative HE staining and immunostaining images of SPATA18. (A) Strong SPATA18 expressed in the tumor tissues of ccRCC patients. (B) Weak SPATA18 expressed in the tumor tissues of ccRCC patients. (C) SPATA18 expressed in the adjacent tissues of ccRCC patients. The pictures were microphotographed (Leica, Germany) and processed using WPS Office (version 11.1.0.12132). Left side is 100 magnification and right side is 400 magnification.Figure 5. ROC curve of SPATA18 mRNA expression in ccRCC cohort. (A) ROC curve of SPATA18 mRNA expression in normal and tumor tissues, (B–D) Subgroup analysis for stage I, II, and III, respectively (R studio, version 3.6.3).Figure 6. Overall survival analysis with SPATA18 mRNA expression. (A) Kaplan-Meier curves for overall survival in ccRCC for all cases, (B) clinical stage I/II, (C) clinical stage III/IV, (D) N0, (E) M0, (F) G1/G2, (G) T1/T2, (H) T3/T4 (R studio, version 3.6.3).Figure 7. Enrichment plots by GSEA. (A) Iron uptake and transport, (B) Calcium signaling pathway (C) Oxidative phosphorylation, (D) WNT ligand biogenesis and trafficking (R studio, version 3.6.3). Tables
Table 1. Clinical characteristics of the ccRCC patients.Table 2. Characteristics of renal cell carcinoma classified by SPATA18 expression.Table 3. Relationship between SPATA18 mRNA expression and clinical characteristics in ccRCC.Table 4. Correlations between overall survival and mRNA expression of SPATA18 analyzed by univariate and multivariate Cox regression.Table 5. Gene sets enriched in negatively correlated with SPATA18 mRNA expression phenotype.Table 1. Clinical characteristics of the ccRCC patients.Table 2. Characteristics of renal cell carcinoma classified by SPATA18 expression.Table 3. Relationship between SPATA18 mRNA expression and clinical characteristics in ccRCC.Table 4. Correlations between overall survival and mRNA expression of SPATA18 analyzed by univariate and multivariate Cox regression.Table 5. Gene sets enriched in negatively correlated with SPATA18 mRNA expression phenotype. In Press
Clinical Research
Effects of Single-Bout Endurance Exercise Intensity on Peripheral Neurotrophic Factors in Patients With Isc...Med Sci Monit In Press; DOI: 10.12659/MSM.952089
Review article
Anisodus tanguticus in Cancer Research: A Review of Traditional Use, Phytochemistry, Extraction Methods, an...Med Sci Monit In Press; DOI: 10.12659/MSM.952999
Clinical Research
Nasal Mucociliary Clearance and Its Relationship With Disease Severity in Patients With Multiple SclerosisMed Sci Monit In Press; DOI: 10.12659/MSM.952850
Clinical Research
Modified Thoracoabdominal Nerves Block Through the Perichondrial Approach vs Subcostal Transversus Abdomini...Med Sci Monit In Press; DOI: 10.12659/MSM.953976
Most Viewed Current Articles
17 Jan 2024 : Review article 14,176,570
Vaccination Guidelines for Pregnant Women: Addressing COVID-19 and the Omicron VariantDOI :10.12659/MSM.942799
Med Sci Monit 2024; 30:e942799
13 Nov 2021 : Clinical Research 3,762,188
Acceptance of COVID-19 Vaccination and Its Associated Factors Among Cancer Patients Attending the Oncology ...DOI :10.12659/MSM.932788
Med Sci Monit 2021; 27:e932788
14 Dec 2022 : Clinical Research 2,466,310
Prevalence and Variability of Allergen-Specific Immunoglobulin E in Patients with Elevated Tryptase LevelsDOI :10.12659/MSM.937990
Med Sci Monit 2022; 28:e937990
16 May 2023 : Clinical Research 708,927
Electrophysiological Testing for an Auditory Processing Disorder and Reading Performance in 54 School Stude...DOI :10.12659/MSM.940387
Med Sci Monit 2023; 29:e940387