03 August 2023: Article
Comparative Analysis of Fused Deposition Modeling and Digital Light Processing Techniques for Dimensional Accuracy in Clear Aligner Manufacturing
Wojciech GrzebieluchDOI: 10.12659/MSM.940922
Med Sci Monit 2023; 29:e940922


Abstract
BACKGROUND: This study aimed to compare fused deposition modeling (FDM) and digital light processing (DLP) techniques in terms of dimensional accuracy for printing dental models used for the manufacture of clear dental aligners.
MATERIAL AND METHODS: Based on the intraoral scan of an adult patient, a sequence of 10 aligner models was created using BlueSkyPlan4. The test models (n=30) were fabricated with 2 desktop 3D printers: (DLP) and (FDM) printers. Two groups of samples were created (digitized using a desktop optical scanner). To calculate trueness (n=20) and precision (n=10), printed models were compared to the source files (REF). REF, DLP, and FDM files were superimposed and converted to point clouds. The cloud-to-cloud distances were calculated using CloudCompare software. Using the same algorithm, distortions of models were measured. Data were analyzed using one-way ANOVA and Tukey's post hoc test.
RESULTS: Significant differences were found between the trueness and precision of DLP and FDM groups. The average calculated trueness of DLP and FDM was 0.096 mm (0.021) (P<0.001) and 0.063 mm (0.024) (P<0.001), respectively. The average calculated precision of DLP and FDM was 0.027 mm (0.003) (P<0.001) and 0.036 mm (0.003) (P<0.001), respectively. A widening (0.158 mmfor DLP and 0.093 mmfor FDM, P=0.05) and twisting (0.03 mmfor DLP and 0.043 mmfor FDM, P=0.05) of the printed models was observed.
CONCLUSIONS: Both printers had sufficient precision for aligner models manufacturing. FDM showed a higher trueness and this device can be applied as an alternative to DLP. Polymerization shrinkage is a significant factor in decreasing the trueness of DLP printers.
Keywords: Models, Dental, Dental Arch, Printing, Three-Dimensional, Orthodontic Appliances, Removable, Dimensional Measurement Accuracy, Dental Materials, Humans, Software, Algorithms
Background
3D printing has introduced new revolutionary possibilities in the field of orthodontics. Today, aligners are a real alternative to fixed appliances in the treatment of selected malocclusions, offering advantages such as a high aesthetic level and helping to maintain proper oral hygiene [1]. Thanks to the use of 3D printing technology, it is possible to create transparent aligners, digitally designed, with precisely finished edges, perfectly matched and identically reproduced for the entire patient’s set. Moreover, direct 3D printing is a complex method to control the thickness of the aligner [2].
Currently, aligners can be produced using two 3D printing techniques: FDM (Fused Deposition Modeling) and DLP (Digital Light Processing). FDM is a popular and inexpensive technology. The technology is based on extruding the melted filament layer-by-layer through a hot nozzle to create a model. Precise embossing is ensured by the print head.
This technique involves heating a thermoplastic substance, frequently in filament form, to a semi-liquid condition. The intended 3D object is subsequently produced by extruding this heated material layer-by-layer onto a construction platform. A digital model directs the movement of the extrusion head, which deposits the plastic in tiny layers. The plastic connects to the layer below as it solidifies and cools. The procedure keeps going until the object is finished forming. Due to its low cost and the broad availability of materials, which come in a variety of forms and colors, FDM is a well-regarded option. The quality and durability of objects made with FDM, however, might not be comparable to those made using other techniques. DLP uses a different technology in which photosensitive materials (resins) are cured layer-by-layer with a projector light. The model is created by combining successive layers [3]. In contrast, a light-sensitive resin is solidified using light in the Digital Light Processing method of vat polymerization 3D printing. An image of each layer of the 3D model is projected onto a vat of photopolymer resin using a digital light projector. The projected image’s pattern is solidified by the resin, which is sensitive to certain wavelengths of light. The build platform then elevates, enabling a fresh resin layer to be applied on top of the first. Layer-by-layer, this procedure is repeated until the 3D model is finished. DLP is renowned for its capacity to produce items with a smooth surface finish and high levels of detail, making it a great choice for tasks like jewelry design or dental modeling. However, DLP uses more expensive components, and the final products tend to be more fragile. Additionally, DLP-printed items frequently need post-processing, such as cleaning and curing with UV light [3].
It should be remembered that these techniques each have their own limitations – FDM is limited by, among other things, the size of the nozzle and the precision of the extruder movements, and DLP is limited by the pixel density of the light source (projector). An advantage of FDM is the very wide selection of filaments: PLA, PETG, ABS, PVA, TPU, and doped PLA (mixed with metals and carbon fiber). There is a more limited choice of materials for DLP printers. Both methods are widely used for manufacturing in dental CAD [4–6]. For dental models, the most used manufacturing method is resin printing.
Before the clinical application of the printout, the accuracy of the 3D printer should be tested. In scientific research, the precision and trueness of 3D printing results are often evaluated, which is a proven way to assess the accuracy of a 3D printer. Evaluating results against each other that result from the same 3D file is part of the accuracy called precision, and trueness is the part of accuracy that measures the deviation of each result compared to the actual dimensions of the object. High precision means repeatable results, and high trueness means that results are close to the real dimensions of the object [6–8].
The aim of this study was to compare the trueness and precision of the commonly used 3D DLP printing method with the potentially alternative FDM method to produce 3D models for aligner manufacturing.
Material and Methods
DENTAL MODELS DESIGN:
The intraoral scans of adult patient were performed with Primescan (Dentsply Sirona, Bensheim, Germany) and Cerec Connect 5.2.2 (Dentsply Sirona, Bensheim, Germany). The scans were exported as .stl (standard tessellation language) files (highest quality) and transferred to a BlueSkyPlan4 4.7.15 software (Blue Sky Bio, LLC, USA; www.blueskybio.com) software to design aligner models. The series of solid models for 3D printing were designed automatically by BlueSkyPlan4 4.7.15 with default software settings – hollowed, 3-mm thickness (Figure 1A).
The generated files were then exported for printing and used as a reference point to evaluate trueness and precision of the 3D printed models. The sequence of 10 aligner models was used for the trueness analysis compared with the reference model. Additionally, 1 randomly selected model (the same for DLP and FDM) was used to measure the precision of the printers by comparison in pairs within the groups.
DENTAL MODELS PRINTING:
Two printers and materials were used during this study. The printing units were calibrated according to the manufacturer’s instructions and the printer settings were optimized for the materials used for this study (Table 1).
Finally, 2 groups of dental models were printed (n=30). In Group 1 (DLP) (n=15), models were printed with the DLP method. The thickness of the layer was set at 0.1mm, basic layers n=5, curing time 55 s, normal curing time 15 s, no supports were applied (vertical printing directly on the printer platform). After printing, the models were then cleaned in IPA (99% isopropanol) for 6 min. (Aycubic Wash&Clean 1.0, ANYCUBIC, Shenzen, China) and then removed from the platform. After drying at room temperature, the printed models were light-cured for 20 min in horizontal position in Formcure (Formlabs, Somerville, Massachusetts, USA). In Group 2 (FDM) (n=15), models were printed with the FDM method. The layer thickness (Z) was 0.06 mm and the nozzle size was 0.25 mm. All printer settings were default according to the Ultimaker CURA 4.11.0 settings for the selected filament, layer thickness, and nozzle size (Table 1). To avoid need for supports, the models were positioned horizontally on the printer platform within the groups; 10 models were used for trueness measurements and 5 identical models for precision measurements.
PREPARATION OF REFERENCE MODELS FOR ANALYSIS: The models designed with BlueSkyPlan4 and used during DLP and FDM printing were then used as reference models (REF) for the comparative trueness analysis. These models were exported as a solid for printing but, using Autodesk/Meshmixer 5.7.0 software, solid models were converted to the .stl mesh comparable to those obtained during the scanning process (Figure 1B).
PRINTED MODELS DIGITALIZATION AND .STL FILE SUPERIMPOSITION:
The FDM (n=15) and DLP (n=15) were scanned using Shining 3D Autoscan DX-ES (Shining 3D China) desktop scanner and Dental Scan 2.9 (Shining 3D China) software. The desktop scanner was calibrated directly prior to the scanning process according to the manufacturer’s recommendation. The printed models were passively mounted to the scanner table, without using force, to avoid model deformations. The printing, storage, and scanning processes were performed under constant temperature and humidity conditions. Except for platform debonding, to avoid additional deformations of the printed models, no external force was applied.
PRECISION ANALYSIS: DLP-printed models (n=10) and FDM-printed models (n=10) were used to measure trueness of both printing processes by comparison with reference file (REF) used for printing. The .stl files were first superimposed and trimmed using InLab 20.0.1 (DentsplySirona, Bensheim, Germany) and then exported as 3 correlated .stl files (REF, DLP, FDM) for each of the 10 individual aligners. Finally, 10 sets of 3 superimposed files were obtained for further trueness analysis. The correlated sets were imported and analyzed using CloudCompare v2.12.4 (https://www.cloudcompare.org/main.html) [9]. The files were imported and finally adjusted (Figure 2) and finally converted to 20 pairs of the 3D point clouds for analysis. After conversion, each cloud consisted of approximately 1 million points. Cloud/cloud distance function was applied to calculate absolute cloud-to-cloud distance (C2C) with active 2D1/2 triangulation and points (kNN) (set on 6) options, and the REF cloud was used as a reference. Measurements were made for full arch and for selected regions, as described in Table 2. Regions located on teeth 36, 31, and 46 were used to measure displacements in particular directions (XYZ). Detailed movements are described in Table 2.
PRECISION ANALYSIS: DLP-printed models (n=5) and FDM-printed models (n=5) of the same aligner model were used to measure trueness of both printing processes. In each group (DLP and FDM), the files were divided into 10 pairs for comparison. The .stl files were first superimposed using InLab 20.0.1 (DentsplySirona, Bensheim, Germany) and then exported as 2 correlated .stl files. Finally, 10 sets of 2 superimposed files were obtained for further precision analysis. The correlated sets were imported and analyzed using CloudCompare v2.12.4 (https://www.cloudcompare.org/main.html) [9]. File manipulation and analysis were identical to the trueness analysis path. Cloud/cloud distance function was applied to calculate absolute cloud-to-cloud distance (C2C) with active 2D1/2 triangulation and points (kNN) (set on 6) options to compare 2 .stl files, and means and SD were calculated to measure the precision of DLP and FDM.
MODEL DISTORTION: Measurement locations are shown in Table 3. A widening of the dental arch was calculated as an increase or decrease of 36–46 distance measured along the X axis in relation to the sagittal plane. Twisting of the dental arch was calculated along the Z axis by determining the average displacement of the buccal cusp surfaces of the 36 and 46 in relation to the horizontal plane passing through the incisal edge 31. A negative value means that the surface was moved down and a positive value means the surface moved up – measuring areas were 36 Z, 31 Z, and 46 Z. Finally, a labial or lingual displacement of the labial surface of the incisor (31Y) was also measured along the Y axis in relation to the frontal plane.
STATISTICAL ANALYSIS:
JASP Team (2022) (JASP 0.16.4) [10] computer software was used to analyze the data. The mean C2C distance and their standard deviations (SD) of trueness, precision and model distortions were calculated for DLP and FDM groups. The one-way analysis of variance and TUKEY post hoc test were used for multiple comparisons to analyze significance of differences in trueness, precision, and model distortions of DLP and FDM prints. The significance level was set at 0.05 for all tests.
Results
TRUENESS ANALYSIS:
An example of 3D C2C distance analysis for DLP and FDM conducted to calculate printers’ trueness is shown in Figure 3. A statistically significant difference (P<0.001) was found between printer’s trueness (Table 4). There were no significant differences (P>0.3) between different parts of arch (A, L, and R) (Table 5). The mean (SD) C2C distance calculated for DLP and FDM calculated for full ach and for the parts (A, L, and R) are presented in Table 5 and in the boxplots in Figure 4.
PRECISSION ANALYSIS:
An example of 3D C2C distance analysis for DLP and FDM conducted to calculate printers’ precision is visualized in Figure 5. A statistically significant difference (P<0.001) was found between C2C recorded in DLP and FDM (Table 6). The mean (SD) C2C distance are presented in Table 7 and the boxplots are presented in Figure 6.
AXIS X – DENTAL ARCH WIDENING: A widening of the dental arch was observed on all printed models for both printing technologies. A statistically significant difference (P=0.05) between DLP and FDM was found (Table 8). The mean (SD) 36–46 distance increase is presented in Table 9 and the boxplots are presented in Figure 7. In all printed models, the 36–46 distance was higher than on REF, which means the arches were wider.
AXIS Z – DENTAL ARCH TWISTING: A twisting of the dental arch was observed on all printed models for both printing technologies. No statistically significant difference (P>0.05) between DLP and FDM were found (Table 10). The mean (SD) 36–46 distance increase is presented in Table 11 and the boxplots are presented in Figure 8.
AXIS Y – LABIAL SURFACE OF THE INCISOR DISPLACEMENT: A statistically significant difference (p<0.001) was found between DLP and FDM group. (Table 12). The means (SD) of displacements are presented in Table 13 and Figure 9. The labial surface of the incisor was always displaced lingually for the DLP models. For the FDM on 5 models examined, the surface of 31 was displaced lingually while on the rest it was displaced labially. This caused the mean to erroneously indicate only the minimum displacement, while the actual deviations ranged up to 0.113 (Table 13).
Discussion
Accuracy evaluation of complete-arch models manufactured by different 3D printing technologies is an important aspect to consider when selecting a 3D printing method for dental applications. The accuracy of the printed model can affect the fit of the final restoration or aligner and ultimately the success of the treatment. Different 3D printing technologies have varying levels of accuracy, which can be affected by a variety of factors such as resolution of the printer, the material used, and the design of the model. For example, Stereolithography (SLA) and Digital Light Processing (DLP) are known for producing highly accurate models with fine details, while Fused Deposition Modeling (FDM) is typically less accurate due to the layer-by-layer nature of the printing process. [4].
It is important to note that accuracy evaluations can be performed by comparing the printed model to a master model or by measuring the fit of the final restoration to the printed model. This can be done using methods such as Coordinate Measuring Machine (CMM), Laser scanning, and Optical scanning. The optical scanning applied during this study is an accepted method of digitizing printouts in order to compare them with a reference standard [11,12].
Systematic reviews of the literature revealed that accuracy of 3D printed models varies from 0.1 to 0.5 mm (100 to 500 μm). For SLA printers it ranged from 0.0033 to 0.579 mm (3.3 μm to 579 μm), and DLP has less than <0.1 mm (100 μm) accuracy [13,14]. Obtained results revealed significant differences in trueness between DLP and FDM printers. Differences from the reference model ranged from 0.063 to 0.096 mm for FDM and DLP, respectively. These values are within the range reported in the literature. The trueness of the model parts (R, A, L) was also analyzed and no significant differences were found between them. Thus, the trueness was homogeneously distributed over the entire surface of the model. The accuracy of both printers is therefore not significantly dependent on the inclination of a given fragment relative to the printer platform.
Tsolakis et al (2022) compared the precision of a Direct Light Processing (DLP) and a Liquid Crystal Display (LCD) 3D printer for manufacturing dental models. Trueness (how closely the print resembles the original design) and precision (consistency between different copies of the same design) were used to measure accuracy. A model scanner and reverse engineering software were used to compare 10 reference files. The findings show that the DLP 3D printer was considerably more accurate than the LCD 3D printer in terms of both trueness (
The study of Venezia et al (2022) aimed to evaluate the accuracy of dental models created with entry-level Liquid Crystal Display (LCD) 3D printers. The experiment involved generating identical models from a master digital file using 2 entry-level LCD 3D printers and 1 professional-grade 3D printer as a criterion standard. The models were scanned, superimposed, and analyzed for deviations to assess their trueness (how closely a printed model represents the original design) and precision (consistency of repeated prints). The results showed significantly higher root mean square (RMS) values in dental models printed with entry-level printers compared to the GS printer (
Young et al (2023) compared trueness of dlp, sla, and fdm printers used for dental applications. The reported trueness of DPL printers (from 0.03 to 0.04) was higher than in the present study (0.1). The trueness of FDM printers (from 0.037 to 0.083) in our results were in this range [12].
Nulty (2023) tested trueness and precision of 12 3D printers used in dentistry in 3 axes (X, Y, and Z). The results presented in this paper cannot be compared with those obtained in this study because they are based on the printing of a cube-like solid model. This unrealistic shape differs significantly from the shape of the dental arch, which prevents a similar polymerization and/or cooling shrinkage of the model [11].
Despite the demonstrated significant differences in precision – the DLP printer was more precise then FDM (0.027 vs 0.036 mm, respectively) – it can be concluded that such small differences are not clinically significant.
In accordance with the American Board of Orthodontics (ABO) standards for plaster models, an intra-arch distance with an error of less than 0.5 mm from a criterion standard plaster model is considered clinically acceptable, but many studies revealed that the range of 0.2–0.5 mm is considered acceptable for clinical accuracy [15,16].
In the study conducted by Emir et al, the trueness of the printed models for the DLP printer was estimated at 46.2 μm for the SLA printer and 58.6 μm for the Polyjet printer. The Polyjet models (30.4 μm) were more precise than the SLA (37.6 μm) and DLP (43.6 μm) models (
A survey by Jaber et al concerning evaluation of accuracy of physical reproductions of plaster orthodontic study casts fabricated by rapid prototyping techniques (FDM and DLP) found that correlation coefficients for all the comparisons made between the 3D replicas and the models were greater than 0.80, with ICCs ranging from 0.802 to 0.990 and from 0.853 to 0.990 for the FDM and DLP. The overall mean difference was −0.11 mm and 0.00, ranging from −0.49 to 0.17 mm (FDM) and from −0.42 to 0.50 mm (DLP). They concluded that the accuracy of the 3D models produced by both techniques was acceptable [16].
When analyzing the distortions of the dental arch, it should be noted that both printers caused arch widening (higher in the case of DLP – 0.158 vs 0.09 mm for FDM, axis X). This difference can be explained by post-processing and polymerization shrinkage, which is absent in the case of FDM. Widening occurs because the length of the polymerized material is greater on the vestibular side. The absolute measurement of the torsion of the dental arch showed low values, and the averages did not exceed 0.043 and 0.03 mm for DLP and FDM, respectively. Shrinkage should be considered the main cause of the lower accuracy of the DLP printer evaluated in this study, which is confirmed by the better precision of DLP.
Evaluation of trueness and precision of 3D-printed casts using DLP and FDM performed by de Freitas et al also confirmed the greater shrinkage observed in dimensions of 3D-printed casts. DLP had higher distortion than FDM [18].
In conclusion, further research is necessary to determine whether the use of a bar connecting the distal ends of the dental arch can reduce the deformations caused by material contraction. It is also important to consider that different 3D printing technologies have different advantages and disadvantages, such as cost, printing speed, material properties, and post-processing needs. It should also be borne in mind that the final result is also affected by post-processing, especially light curing. Therefore, it is recommended to carefully consider the specific requirements of each case and to evaluate the accuracy of different 3D printing technologies before making a final decision.
Limitations of the study:
Conclusions
Within the limitations of this study, it can be concluded that both printers, Fused Deposition Modeling (FDM) and Digital Light Processing (DLP), exhibit sufficient precision for the manufacture of aligner models. However, FDM demonstrated superior trueness, establishing it as a viable alternative to DLP. Notably, polymerization shrinkage was identified as a significant factor in decreasing the trueness of DLP printers.
Figures
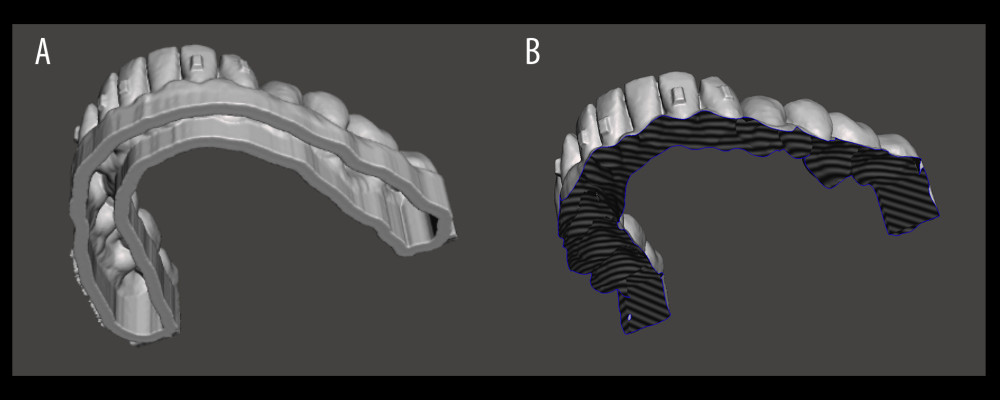 Figure 1. Exemplary closed .stl model prepared for horizontal or vertical printing, hollowed, wall thickness 3mm prepared with BlueSkyPlan4 4.7.15 software (Blue Sky Bio, LLC, USA; www.blueskybio.com) (A); reference model converted to the mesh for comparisons using Meshmixer 5.7.0 (Autodesk, USA) software (B).
 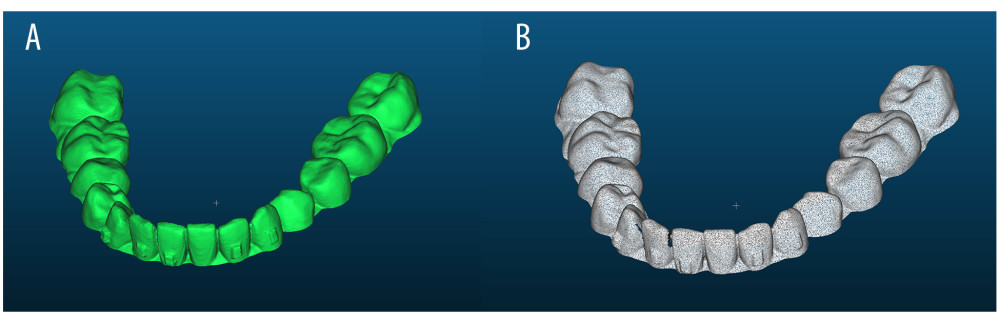 Figure 2. Model prepared for analysis imported to CloudCompare, 2.13.alpha (cloudcompare.org), 3D mesh and (A), model converted to the 3D point cloud (1 million points) (B). Software: CloudCompare, 2.13.alpha (cloudcompare.org).
 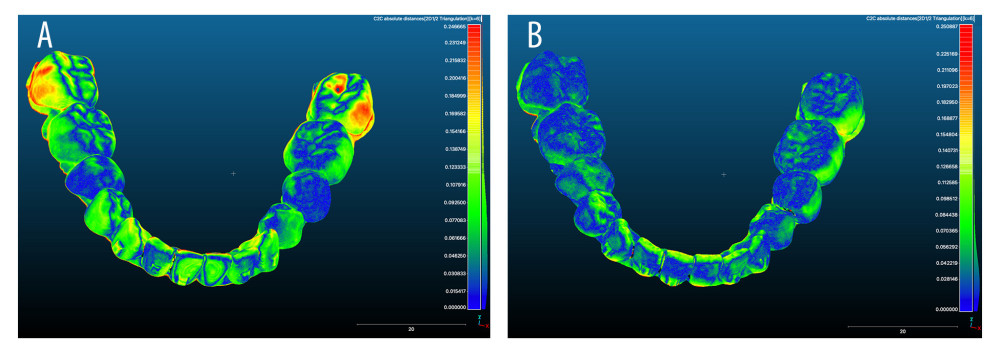 Figure 3. Exemplary graphical visualization of cloud-to-cloud distance (C2C) measured for trueness calculation; Digital Light Processing (DLP) (A); Fused Deposition Modeling (FDM) (B). Software: CloudCompare, 2.13.alpha (cloudcompare.org).
 ![DLP and FDM printers’ trueness calculation plots. Software: JASP 0.17.1[Computer software] (https://jasp-stats.org/).](https://jours.isi-science.com/imageXml.php?i=medscimonit-29-e940922-g004.jpg&idArt=940922&w=1000) Figure 4. DLP and FDM printers’ trueness calculation plots. Software: JASP 0.17.1[Computer software] (https://jasp-stats.org/).
Figure 4. DLP and FDM printers’ trueness calculation plots. Software: JASP 0.17.1[Computer software] (https://jasp-stats.org/). 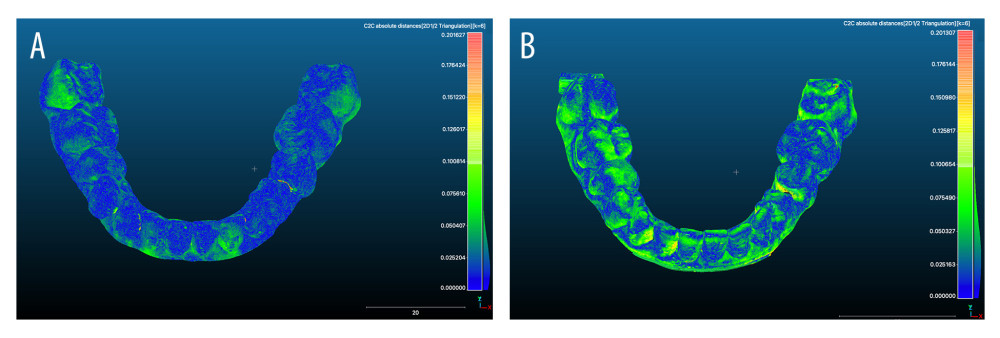 Figure 5. Exemplary graphical visualization of C2C measured for precision calculation DLP (A); FDM (B). Software: CloudCompare, 2.13.alpha (cloudcompare.org).
 ![DLP and FDM printers’ precision calculation plots. Software: Software: JASP 0.17.1 [Computer software] (https://jasp-stats.org/).](https://jours.isi-science.com/imageXml.php?i=medscimonit-29-e940922-g006.jpg&idArt=940922&w=1000) Figure 6. DLP and FDM printers’ precision calculation plots. Software: Software: JASP 0.17.1 [Computer software] (https://jasp-stats.org/).
Figure 6. DLP and FDM printers’ precision calculation plots. Software: Software: JASP 0.17.1 [Computer software] (https://jasp-stats.org/). ![DLP and FDM 36–46 distance increase along X axis (in relation with sagittal plane) calculation plots. Software: JASP 0.17.1 [Computer software] (https://jasp-stats.org/).](https://jours.isi-science.com/imageXml.php?i=medscimonit-29-e940922-g007.jpg&idArt=940922&w=1000) Figure 7. DLP and FDM 36–46 distance increase along X axis (in relation with sagittal plane) calculation plots. Software: JASP 0.17.1 [Computer software] (https://jasp-stats.org/).
Figure 7. DLP and FDM 36–46 distance increase along X axis (in relation with sagittal plane) calculation plots. Software: JASP 0.17.1 [Computer software] (https://jasp-stats.org/). ![DLP and FDM dental arch twisting calculation plots along Z axis (in relation with horizontal plane). Software: JASP 0.17.1[Computer software] (https://jasp-stats.org/).](https://jours.isi-science.com/imageXml.php?i=medscimonit-29-e940922-g008.jpg&idArt=940922&w=1000) Figure 8. DLP and FDM dental arch twisting calculation plots along Z axis (in relation with horizontal plane). Software: JASP 0.17.1[Computer software] (https://jasp-stats.org/).
Figure 8. DLP and FDM dental arch twisting calculation plots along Z axis (in relation with horizontal plane). Software: JASP 0.17.1[Computer software] (https://jasp-stats.org/). ![DLP and FDM C2C distance measured on labial surface of 31 along Y axis (in relation with facial plane). Software: JASP 0.17.1[Computer software] (https://jasp-stats.org/).](https://jours.isi-science.com/imageXml.php?i=medscimonit-29-e940922-g009.jpg&idArt=940922&w=1000) Figure 9. DLP and FDM C2C distance measured on labial surface of 31 along Y axis (in relation with facial plane). Software: JASP 0.17.1[Computer software] (https://jasp-stats.org/).
Figure 9. DLP and FDM C2C distance measured on labial surface of 31 along Y axis (in relation with facial plane). Software: JASP 0.17.1[Computer software] (https://jasp-stats.org/). Tables
Table 1. Printers and materials used in this study.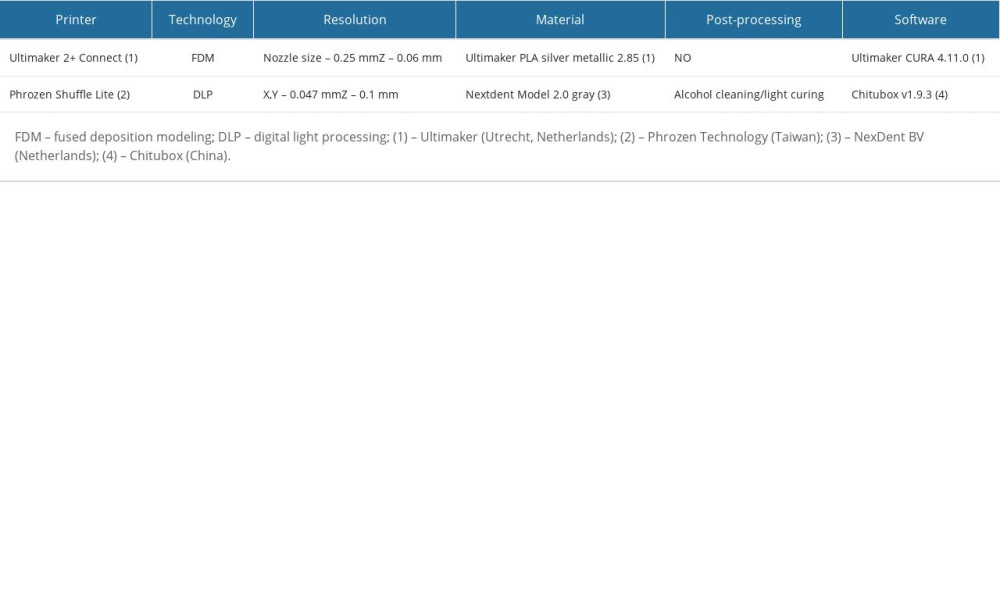 Table 2. Measurement locations and algorithms used.
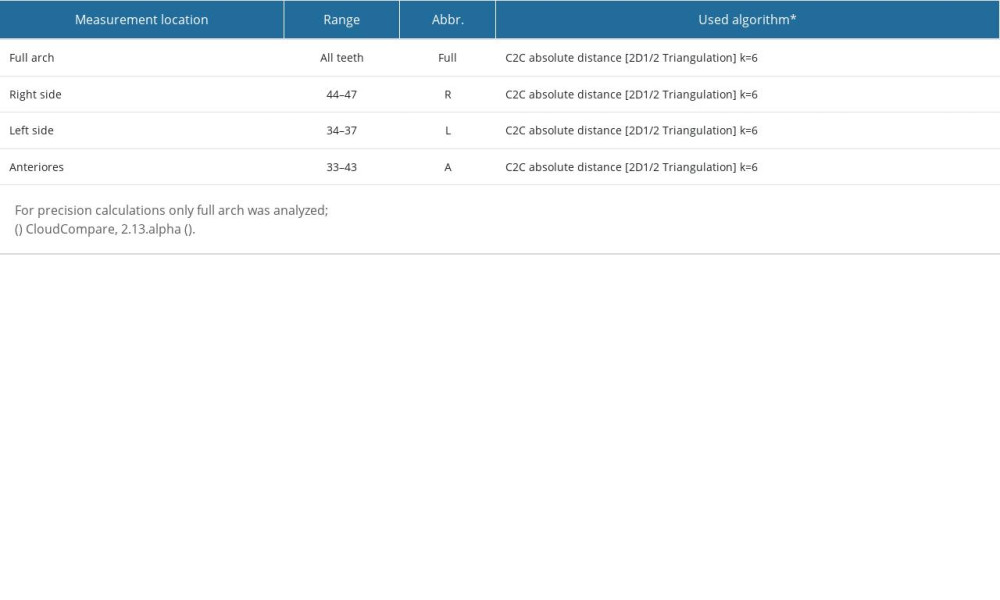 Table 3. Measurement locations and algorithms used to analyze distortions.
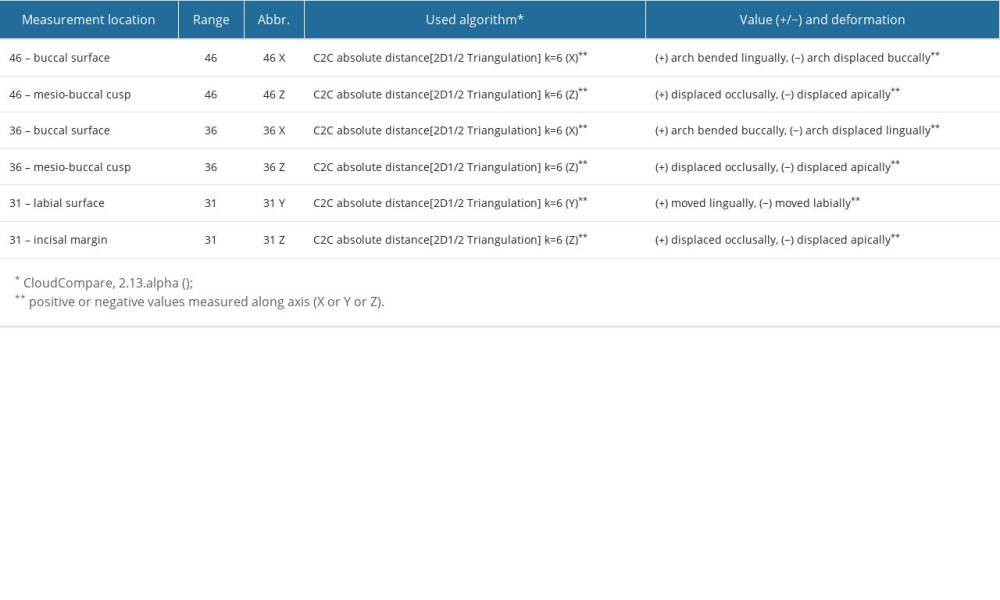 Table 4. DLP and FDM printers’ trueness, ANOVA test results. Software: JASP 0.17.1 [Computer software] (https://jasp-stats.org/).
![DLP and FDM printers’ trueness, ANOVA test results. Software: JASP 0.17.1 [Computer software] (https://jasp-stats.org/).](https://jours.isi-science.com/imageXml.php?i=t4-medscimonit-29-e940922.jpg&idArt=940922&w=1000) Table 5. DLP and FDM printers’ trueness, calculated average C2C distance. Software: JASP 0.17.1 [Computer software] (https://jasp-stats.org/).
Table 5. DLP and FDM printers’ trueness, calculated average C2C distance. Software: JASP 0.17.1 [Computer software] (https://jasp-stats.org/).![DLP and FDM printers’ trueness, calculated average C2C distance. Software: JASP 0.17.1 [Computer software] (https://jasp-stats.org/).](https://jours.isi-science.com/imageXml.php?i=t5-medscimonit-29-e940922.jpg&idArt=940922&w=1000) Table 6. DLP and FDM printers’ precision, ANOVA test results. Software: JASP 0.17.1[Computer software] (https://jasp-stats.org/).
Table 6. DLP and FDM printers’ precision, ANOVA test results. Software: JASP 0.17.1[Computer software] (https://jasp-stats.org/).![DLP and FDM printers’ precision, ANOVA test results. Software: JASP 0.17.1[Computer software] (https://jasp-stats.org/).](https://jours.isi-science.com/imageXml.php?i=t6-medscimonit-29-e940922.jpg&idArt=940922&w=1000) Table 7. DLP and FDM printers’ precision, calculated average C2C distance. Software: JASP 0.17.1 [Computer software] (https://jasp-stats.org/).
Table 7. DLP and FDM printers’ precision, calculated average C2C distance. Software: JASP 0.17.1 [Computer software] (https://jasp-stats.org/).![DLP and FDM printers’ precision, calculated average C2C distance. Software: JASP 0.17.1 [Computer software] (https://jasp-stats.org/).](https://jours.isi-science.com/imageXml.php?i=t7-medscimonit-29-e940922.jpg&idArt=940922&w=1000) Table 8. DLP and FDM 36–46 distance increase, ANOVA test results. Software: JASP 0.17.1 [Computer software] (https://jasp-stats.org/).
Table 8. DLP and FDM 36–46 distance increase, ANOVA test results. Software: JASP 0.17.1 [Computer software] (https://jasp-stats.org/).![DLP and FDM 36–46 distance increase, ANOVA test results. Software: JASP 0.17.1 [Computer software] (https://jasp-stats.org/).](https://jours.isi-science.com/imageXml.php?i=t8-medscimonit-29-e940922.jpg&idArt=940922&w=1000) Table 9. DLP and FDM 36–46 distance increase. Software: JASP 0.17.1 [Computer software] (https://jasp-stats.org/).
Table 9. DLP and FDM 36–46 distance increase. Software: JASP 0.17.1 [Computer software] (https://jasp-stats.org/).![DLP and FDM 36–46 distance increase. Software: JASP 0.17.1 [Computer software] (https://jasp-stats.org/).](https://jours.isi-science.com/imageXml.php?i=t9-medscimonit-29-e940922.jpg&idArt=940922&w=1000) Table 10. DLP and FDM dental arch twisting, ANOVA test results. Software: JASP 0.17.1 [Computer software] (https://jasp-stats.org/).
Table 10. DLP and FDM dental arch twisting, ANOVA test results. Software: JASP 0.17.1 [Computer software] (https://jasp-stats.org/).![DLP and FDM dental arch twisting, ANOVA test results. Software: JASP 0.17.1 [Computer software] (https://jasp-stats.org/).](https://jours.isi-science.com/imageXml.php?i=t10-medscimonit-29-e940922.jpg&idArt=940922&w=1000) Table 11. DLP and FDM dental arch twisting. Software: JASP 0.17.1 [Computer software] (https://jasp-stats.org/).
Table 11. DLP and FDM dental arch twisting. Software: JASP 0.17.1 [Computer software] (https://jasp-stats.org/).![DLP and FDM dental arch twisting. Software: JASP 0.17.1 [Computer software] (https://jasp-stats.org/).](https://jours.isi-science.com/imageXml.php?i=t11-medscimonit-29-e940922.jpg&idArt=940922&w=1000) Table 12. DLP and FDM C2C distance on labial surface of 31 along Y axis, ANOVA test results. Software: JASP 0.17.1 [Computer software] (https://jasp-stats.org/).
Table 12. DLP and FDM C2C distance on labial surface of 31 along Y axis, ANOVA test results. Software: JASP 0.17.1 [Computer software] (https://jasp-stats.org/).![DLP and FDM C2C distance on labial surface of 31 along Y axis, ANOVA test results. Software: JASP 0.17.1 [Computer software] (https://jasp-stats.org/).](https://jours.isi-science.com/imageXml.php?i=t12-medscimonit-29-e940922.jpg&idArt=940922&w=1000) Table 13. DLP and FDM C2C distance on labial surface of 31 along Y axis. Software: JASP 0.17.1 [Computer software] (https://jasp-stats.org/).
Table 13. DLP and FDM C2C distance on labial surface of 31 along Y axis. Software: JASP 0.17.1 [Computer software] (https://jasp-stats.org/).![DLP and FDM C2C distance on labial surface of 31 along Y axis. Software: JASP 0.17.1 [Computer software] (https://jasp-stats.org/).](https://jours.isi-science.com/imageXml.php?i=t13-medscimonit-29-e940922.jpg&idArt=940922&w=1000)
References
1. Tartaglia GM, Mapelli A, Maspero C, Direct 3D printing of clear orthodontic aligners: Current state and future possibilities: Materials (Basel), 2021; 14(7); 1799
2. Venezia P, Ronsivalle V, Rustico L, Accuracy of orthodontic models prototyped for clear aligners therapy: A 3D imaging analysis comparing different market segments 3D printing protocols: J Dent, 2022; 124; 104212
3. Rouzé l’Alzit F, Cade R, Naveau A, Accuracy of commercial 3D printers for the fabrication of surgical guides in dental implantology: J Dent, 2022; 117; 103909
4. Park JM, Jeon J, Koak JY, Dimensional accuracy and surface characteristics of 3D-printed dental casts: J Prosthet Dent, 2021; 126(3); 427-37
5. Tian Y, Chen C, Xu X, A review of 3D printing in dentistry: Technologies, affecting factors, and applications: Scanning, 2021; 2021; 9950131
6. Tsolakis IA, Gizani S, Panayi N, Three-dimensional printing technology in orthodontics for dental models: A systematic review: Children (Basel, Switzerland), 2022; 9(8); 1106
7. Tsolakis IA, Papaioannou W, Papadopoulou E, Comparison in terms of accuracy between DLP and LCD printing technology for dental model printing: Dent J (Basel), 2022; 10(10); 181
8. Moon W, Kim S, Lim BS, Dimensional accuracy evaluation of temporary dental restorations with different 3D printing systems: Materials (Basel), 2021; 14(6); 1487
9. : Cloud Compare computer software Available from: https://www.cloudcompare.org/main.html
10. : JASP computer software Available from: https://jasp-stats.org
11. Nulty A, A comparison of trueness and precision of 12 3D printers used in dentistry: BDJ Open, 2022; 8(1); 14
12. Young Kim RJ, Cho SM, Jung WS, Park JM, Trueness and surface characteristics of 3-dimensional printed casts made with different technologies: J Prosthet Dent, 2023 [Online ahead of print]
13. Wang X, Shujaat S, Shaheen E, Jacobs R, Accuracy of desktop versus professional 3D printers for maxillofacial model production. A systematic review and meta-analysis: J Dent, 2021; 112; 103741
14. Etemad-Shahidi Y, Qallandar OB, Evenden J, Accuracy of 3-dimensionally printed full-arch dental models: A systematic review: J Clin Med, 2020; 9(10); 3357
15. Wan Hassan WN, Yusoff Y, Mardi NA, Comparison of reconstructed rapid prototyping models produced by 3-dimensional printing and conventional stone models with different degrees of crowding: Am J Orthod Dentofacial Orthop, 2017; 151(1); 209-18
16. Jaber ST, Hajeer MY, Khattab TZ, Mahaini L, Evaluation of the fused deposition modeling and the digital light processing techniques in terms of dimensional accuracy of printing dental models used for the fabrication of clear aligners: Clin Exp Dent Res, 2021; 7(4); 591-600
17. Emir F, Ayyildiz S, Accuracy evaluation of complete-arch models manufactured by three different 3D printing technologies: A three-dimensional analysis: J Prosthodont Res, 2021; 65(3); 365-70
18. de Freitas BN, Mendonça LM, Cruvinel PB, Comparison of intraoral scanning and CBCT to generate digital and 3D-printed casts by fused deposition modeling and digital light processing: J Dent, 2023; 128; 104387
Figures
Figure 1. Exemplary closed .stl model prepared for horizontal or vertical printing, hollowed, wall thickness 3mm prepared with BlueSkyPlan4 4.7.15 software (Blue Sky Bio, LLC, USA; www.blueskybio.com) (A); reference model converted to the mesh for comparisons using Meshmixer 5.7.0 (Autodesk, USA) software (B).Figure 2. Model prepared for analysis imported to CloudCompare, 2.13.alpha (cloudcompare.org), 3D mesh and (A), model converted to the 3D point cloud (1 million points) (B). Software: CloudCompare, 2.13.alpha (cloudcompare.org).Figure 3. Exemplary graphical visualization of cloud-to-cloud distance (C2C) measured for trueness calculation; Digital Light Processing (DLP) (A); Fused Deposition Modeling (FDM) (B). Software: CloudCompare, 2.13.alpha (cloudcompare.org).Figure 4. DLP and FDM printers’ trueness calculation plots. Software: JASP 0.17.1[Computer software] (https://jasp-stats.org/).Figure 5. Exemplary graphical visualization of C2C measured for precision calculation DLP (A); FDM (B). Software: CloudCompare, 2.13.alpha (cloudcompare.org).Figure 6. DLP and FDM printers’ precision calculation plots. Software: Software: JASP 0.17.1 [Computer software] (https://jasp-stats.org/).Figure 7. DLP and FDM 36–46 distance increase along X axis (in relation with sagittal plane) calculation plots. Software: JASP 0.17.1 [Computer software] (https://jasp-stats.org/).Figure 8. DLP and FDM dental arch twisting calculation plots along Z axis (in relation with horizontal plane). Software: JASP 0.17.1[Computer software] (https://jasp-stats.org/).Figure 9. DLP and FDM C2C distance measured on labial surface of 31 along Y axis (in relation with facial plane). Software: JASP 0.17.1[Computer software] (https://jasp-stats.org/). Tables
Table 1. Printers and materials used in this study.Table 2. Measurement locations and algorithms used.Table 3. Measurement locations and algorithms used to analyze distortions.Table 4. DLP and FDM printers’ trueness, ANOVA test results. Software: JASP 0.17.1 [Computer software] (https://jasp-stats.org/).Table 5. DLP and FDM printers’ trueness, calculated average C2C distance. Software: JASP 0.17.1 [Computer software] (https://jasp-stats.org/).Table 6. DLP and FDM printers’ precision, ANOVA test results. Software: JASP 0.17.1[Computer software] (https://jasp-stats.org/).Table 7. DLP and FDM printers’ precision, calculated average C2C distance. Software: JASP 0.17.1 [Computer software] (https://jasp-stats.org/).Table 8. DLP and FDM 36–46 distance increase, ANOVA test results. Software: JASP 0.17.1 [Computer software] (https://jasp-stats.org/).Table 9. DLP and FDM 36–46 distance increase. Software: JASP 0.17.1 [Computer software] (https://jasp-stats.org/).Table 10. DLP and FDM dental arch twisting, ANOVA test results. Software: JASP 0.17.1 [Computer software] (https://jasp-stats.org/).Table 11. DLP and FDM dental arch twisting. Software: JASP 0.17.1 [Computer software] (https://jasp-stats.org/).Table 12. DLP and FDM C2C distance on labial surface of 31 along Y axis, ANOVA test results. Software: JASP 0.17.1 [Computer software] (https://jasp-stats.org/).Table 13. DLP and FDM C2C distance on labial surface of 31 along Y axis. Software: JASP 0.17.1 [Computer software] (https://jasp-stats.org/).Table 1. Printers and materials used in this study.Table 2. Measurement locations and algorithms used.Table 3. Measurement locations and algorithms used to analyze distortions.Table 4. DLP and FDM printers’ trueness, ANOVA test results. Software: JASP 0.17.1 [Computer software] (https://jasp-stats.org/).Table 5. DLP and FDM printers’ trueness, calculated average C2C distance. Software: JASP 0.17.1 [Computer software] (https://jasp-stats.org/).Table 6. DLP and FDM printers’ precision, ANOVA test results. Software: JASP 0.17.1[Computer software] (https://jasp-stats.org/).Table 7. DLP and FDM printers’ precision, calculated average C2C distance. Software: JASP 0.17.1 [Computer software] (https://jasp-stats.org/).Table 8. DLP and FDM 36–46 distance increase, ANOVA test results. Software: JASP 0.17.1 [Computer software] (https://jasp-stats.org/).Table 9. DLP and FDM 36–46 distance increase. Software: JASP 0.17.1 [Computer software] (https://jasp-stats.org/).Table 10. DLP and FDM dental arch twisting, ANOVA test results. Software: JASP 0.17.1 [Computer software] (https://jasp-stats.org/).Table 11. DLP and FDM dental arch twisting. Software: JASP 0.17.1 [Computer software] (https://jasp-stats.org/).Table 12. DLP and FDM C2C distance on labial surface of 31 along Y axis, ANOVA test results. Software: JASP 0.17.1 [Computer software] (https://jasp-stats.org/).Table 13. DLP and FDM C2C distance on labial surface of 31 along Y axis. Software: JASP 0.17.1 [Computer software] (https://jasp-stats.org/). In Press
Clinical Research
Effects of Single-Bout Endurance Exercise Intensity on Peripheral Neurotrophic Factors in Patients With Isc...Med Sci Monit In Press; DOI: 10.12659/MSM.952089
Review article
Anisodus tanguticus in Cancer Research: A Review of Traditional Use, Phytochemistry, Extraction Methods, an...Med Sci Monit In Press; DOI: 10.12659/MSM.952999
Clinical Research
Nasal Mucociliary Clearance and Its Relationship With Disease Severity in Patients With Multiple SclerosisMed Sci Monit In Press; DOI: 10.12659/MSM.952850
Clinical Research
Modified Thoracoabdominal Nerves Block Through the Perichondrial Approach vs Subcostal Transversus Abdomini...Med Sci Monit In Press; DOI: 10.12659/MSM.953976
Most Viewed Current Articles
17 Jan 2024 : Review article 14,176,570
Vaccination Guidelines for Pregnant Women: Addressing COVID-19 and the Omicron VariantDOI :10.12659/MSM.942799
Med Sci Monit 2024; 30:e942799
13 Nov 2021 : Clinical Research 3,762,188
Acceptance of COVID-19 Vaccination and Its Associated Factors Among Cancer Patients Attending the Oncology ...DOI :10.12659/MSM.932788
Med Sci Monit 2021; 27:e932788
14 Dec 2022 : Clinical Research 2,466,310
Prevalence and Variability of Allergen-Specific Immunoglobulin E in Patients with Elevated Tryptase LevelsDOI :10.12659/MSM.937990
Med Sci Monit 2022; 28:e937990
16 May 2023 : Clinical Research 708,927
Electrophysiological Testing for an Auditory Processing Disorder and Reading Performance in 54 School Stude...DOI :10.12659/MSM.940387
Med Sci Monit 2023; 29:e940387