11 October 2023: Lab/In Vitro Research
The Role of Glucose Concentration and Resveratrol in Modulating Neuroinflammatory Cytokines: Insights from an In Vitro Blood–Brain Barrier Model
Justyna KomorowskaDOI: 10.12659/MSM.941044
Med Sci Monit 2023; 29:e941044


Abstract
BACKGROUND: The prevalence of type 2 diabetes mellitus is rising, presumably because of a coexisting pandemic of obesity. Since diabetic neuropathy and neuroinflammation are frequent and significant complications of both prolonged hyperglycemia and iatrogenic hypoglycemia, the effect of glucose concentration and resveratrol (RSV) supplementation on cytokine profile was assessed in an in vitro model of the blood–brain barrier (BBB).
MATERIAL AND METHODS: The in vitro model of BBB was formed of endothelial cells and astrocytes, which represented the microvascular and brain compartments (MC and BC, respectively). The BC concentrations of selected cytokines – IL-10, IL-12, IL-17A, TNF-α, IFN-γ, GM-CSF in response to different glucose concentrations in the MC were studied. The influence of LPS in the BC and RSV in the MC on the cytokine profile in the BC was examined.
RESULTS: Low glucose concentration (40 mg/dL) in the MC resulted in increased concentration of all the cytokines in the BC except TNF-α, compared to normoglycemia-imitating conditions (90 mg/dL) (P<0.05). High glucose concentration (450 mg/dL) in the MC elevated the concentration of all the cytokines in the BC (P<0.05). RSV decreased the level of all cytokines in the BC after 24 h following its administration for all glucose concentrations in the MC (P<0.02). The greatest decline was observed in normoglycemic conditions (P<0.05).
CONCLUSIONS: Both hypo- and hyperglycemia-simulating conditions impair the cytokine profile in BC, while RSV can normalize it, despite relatively poor penetration through the BBB. RSV exhibits anti-neuroinflammatory effects, especially in the group with normoglycemia-simulating conditions.
Keywords: Astrocytes, Blood–brain barrier, CSF2 Protein, Human, Cytokines, endothelial cells, Hyperglycemia, Hypoglycemia, IL12A Protein, Human, Interferon gamma (1-39), Resveratrol, Tumor Necrosis Factor Alpha (36-68), Humans, Blood-Brain Barrier, Tumor Necrosis Factor-alpha, Neuroinflammatory Diseases, Diabetes Mellitus, Type 2, Glucose
Background
The prevalence of diabetes mellitus (DM) and impaired glucose tolerance (IGT) is rising worldwide [1]. Both of these conditions are correlated with an increased incidence of innate immunity dependent low-grade systemic inflammation [2–4]. The presence of such an inflammatory response within the blood–brain barrier can be potentially harmful, disrupting its integrity and increasing permeability, which may in turn promote penetration of potentially toxic or immunogenic substances to the central nervous system [5]. Furthermore, hyperglycemia can promote mitochondrial oxidative stress through enhancing glucose influx to insulin-independent cells [6,7], as well as biosynthesis of advanced glycation end-products (AGE) that may exert pro-inflammatory effects through activating receptors for advanced glycation end-products (RAGE) and some pattern-recognizing receptors (PRR), thus promoting neuroinflammation [8,9]. Therefore, both DM and IGT increase the risk of neuroinflammatory response through excessive stimulation of innate immunity as a result of both increased ROS production and AGE biosynthesis. Increased ROS and AGE concentrations can promote release of pro-inflammatory cytokines through direct or indirect activation of NF-κB signaling pathways [9]. Altered glucose concentration in the plasma can induce an adaptive response within the BBB, and thus change the rate and characteristics of glucose transport from the plasma to the brain parenchyma. Moreover, hyperglycemia-dependent oxidative stress can activate an innate immunity hyperglycemia-dependent inflammatory response within the BBB, which can disrupt its integrity and increase permeability [5].
In the course of hyperglycemia, an excessive influx of glucose to insulin-independent cells results in accelerated rates of oxidative glycolysis and tricarboxylic acid cycle (TCA). Because TCA reactions are coupled with transforming NAD+ into NADH, while neither NAD+ nor NADH can cross mitochondrial membranes through simple diffusion, the increased rate of TCA can decrease the NAD+/NADH ratio in the mitochondria. At the same time, intracellular ATP concentration is high, which can inhibit electron transport chain (ETC), a normal acceptor of free electrons carried by NADH. This can produce an increased risk of non-enzymatic electron drop into molecular oxygen (ie, ROS production), with subsequent NF-κB activation by ROS [10,11].
Since increased ROS concentrations can inhibit GADPH, oxidative stress can redirect glucose metabolism from oxidative glycolysis to the AGE biosynthesis pathway, among others [6,7]. In turn, increased AGE concentrations can exert pro-inflammatory effects, both through RAGE activation and through activation of some pattern-recognizing receptors (eg, TLR4), which finally stimulates NF-κB-dependent signaling and release of some pro-inflammatory cytokines. Therefore, pro-oxidative effects of hyperglycemia in endothelial cells and neurons can promote neuroinflammation [9]. In these conditions, the role of astrocytes becomes particularly important—firstly, because astrocytes are an essential part of the BBB in modulating and maintaining the barrier properties of the brain endothelial cells [12]; and secondly, because astrocytes cooperate with neurons on several levels, including neurotransmitter trafficking and recycling, ion homeostasis, energy metabolism, and defense against oxidative stress [13,14].
Increased ROS concentration in the mitochondria produces a risk of mitochondrial DNA (mtDNA) damage, so it also activates mechanisms which protect the cell from the effects of such damage (eg, HSP-60 expression). However, some HSP-60 molecules may be transported to the cell membrane, where they can activate extracellular innate immunity mechanisms (eg, pattern-recognizing receptors [PRRs] on leukocytes) [15].
Although glycogen synthase is allosterically activated in CNS by glucose-6-phosphate (G6P), and neurons also have an active glycogen metabolism, brain glycogen is stored in astrocytes but not in neurons [16,17]. Thus, neurons require continuous support of glucose from the circulatory system [18]. Glucose depletion in neurons can result in a secondary ATP depletion, with hypoglycemic coma, or even cell necrosis, as possible results. Repeated hypoglycemic episodes, including an adverse effect of treatment with blood-sugar-lowering medication in diabetes, is associated with long-term cognitive deficits [19]. Hypoglycemia has been also linked to increased concentration of pro-inflammatory cytokines, with unclear mechanism of this linkage [20,21]. In patients suffering from type 2 diabetes mellitus (T2DM), induction of hypoglycemia has been related to significantly elevated concentrations of both oxidative stress and inflammatory response markers – both in blood and in urine – after 24 h from the onset of hypoglycemia, whereas in healthy individuals, such a correlation has not been reported [22].
Summing up, long-term hyperglycemia can promote neuroinflammation, both through its pro-oxidative effects with subsequent activation of NF-κB signaling by ROS, and through its AGE biosynthesis-promoting effects, with subsequent activation of RAGE and some PRR receptors (eg, TLR4) [6,7,23–25]. The effects of prolonged hyperglycemia within the CNS are graphically presented in Figure 1.
Neuroinflammation can increase the risk of neurodegenerative diseases such as Alzheimer disease and Parkinson disease, stroke, and multiple sclerosis because it changes the phenotype of microglial cells from quiescent, homeostatic to pro-inflammatory, which results in increased activity of inflammasomes, such as the NLRP3 inflammasome. This in turn stimulates release of some pro-inflammatory cytokines, such as IL-1β, and impairs microglia-dependent Aβ clearance from extracellular spaces [26–33].
Resveratrol (RSV) is a naturally occurring polyphenolic compound, endowed with some anti-oxidative, immunomodulating, anti-neuroinflammatory, and anti-tumor properties [34–38]. Because the pro-neuroinflammatory tendency depends on the nutritional or metabolic status of the body, it is worth studying whether this status, expressed by plasma glucose concentration, can modulate anti-neuroinflammatory properties of RSV.
Therefore, the aim of the study was to assess the effect of different glucose concentrations on the cytokine profile within an in vitro model of BBB, as well as to evaluate anti-neuroinflammatory effects of RSV in hypo-, normo-, and hyperglycemia-mimicking conditions.
Material and Methods
ETHICS STATEMENT AND GENERAL DATA:
According to the latest version of the Declaration of Helsinki, since the research involves the commercially available HCMEC/D3 cell line, it does not have any clinical implications and does not involve human subjects directly, it may not be necessary to obtain additional consent. Nonetheless, this study has been reported to and accepted by the Bioethics Committee of the Medical University of Warsaw on 14 December 2020 (no. AKBE220/2020) as not requiring specific approval from the Committee, given the exclusive use of commercially available human cell lines.
The experiment was conducted from January to May 2021 in the Warsaw Medical University Center of Preclinical Research and Technology (CePT) in an in vitro model of the BBB, consisting of human astrocytic cells and endothelial cell lines with a separating membrane containing 0.4-μm-wide pores. This was an experimental and interventional study aimed at evaluation of the effect of glucose concentration in the MC (which simulates intravascular fluid in the study conditions) on the pro-inflammatory cytokine profile, as well as on the anti-inflammatory action of RSV in the BC (which simulates cerebrospinal fluid in the study conditions).
IN VITRO MODEL OF BBB:
In this study, a 2-component in vitro model of the BBB, consisting of endothelial cells and astrocytes, was used. The HCMEC/D3 human endothelial cell line, containing cells obtained from cerebrovascular endothelium, was purchased from Cedarlane Cellutions Biosystems (Burlington, ON, Canada; catalog # CLU512), prepared from cerebral capillary endothelial cells by transduction with lentiviral vectors carrying the SV40 T antigen and human telomerase reverse transcriptase. This cell line is commercially available (Sigma-Aldrich; cat. no. SCC066), standardized, and, according to the producer, it can be used in cellular and molecular studies of the central nervous system or as a single-cell model of the human BBB [39]. To provide proliferation of endothelial cells with 100% confluence, dedicated EBM-2 medium was used, containing 10% fetal bovine serum, 1x chemically defined lipid concentrate, 5.7 mM ascorbic acid, 0.0125 mM bFGF- human basic fibroblast growth factor, 1M HEPES, 2.8 mM hydrocortisone, penicillin, and streptomycin (Merck KGaA, Darmstadt, Germany; cat. #C-22211). Human astrocytes were derived from human brain tissue (Thermo Fisher Scientific-GibcoTM; Waltham, MA, USA; cat. # N7805100). According to the producer, this cell line can be used for studying human neurological pathways and diseases. To provide proliferation of astrocytes with 100% confluence, basal DMEM medium for astrocyte culture was used, containing: 10% One Shot Fetal Bovine Serum, 1x N-2 Supplement (all purchased from Thermo Fisher Scientific-Gibco™, cat. # A1261301), and penicillin and streptomycin (Merck KGaA, Darmstadt, Germany; cat. #C-22211). Astrocyte culture was performed according to the protocol of the supplier of the astrocyte line and the manufacturer of the medium (https://assets.fishersci.com/TFS-Assets/LSG/manuals/Gibco_HumanAstrocytes_and_medium_man.pdf).
Both cell cultures were held in 5 special culture bottles obtained from TPP Techno Plastic Products AG (Trasadingen, Switzerland), the mean culture surface was 75 square centimeters for endothelial cells and 25 square centimeters for astrocytes. The culture growth duration to obtain 100% confluence was 3 and 4 days. For measurements of the confluences of the cultured adherent cell lines, both the HCMEC/D3 and the human astrocytes, non-invasive, non-destructive, and label-free method were applied [40]. In this method, which eliminates sample manipulation, images of the cultured cells are captured by photography under a routine inverted phase-contrast microscope with LED (Leica DMIL LED; Leica Microsystems CMS, Germany) using a digital camera (Nikon D3100; Nikon Imaging Japan, Inc., Japan) with a dedicated camera lens adaptor (Proscope, Bodelin Technologies, Inc., Oregon, USA). Next, the images were analyzed for confluence using ImageJ 2.1.4.7 i1 freeware, and the measure of confluence was expressed as an area fraction (AF).
After 100% confluence was reached within both types of cells, the number of living cells was counted. It was mixed with trypan blue dye, and 10 mL of the mixture was placed in the chamber’s slide, then put into a Countess Automated Cell Counter (Thermo Fisher Scientific-Invitrogen).
The cell counter indicated that the number of living endothelial cells was 2 million per 1 ml of medium and the number of living astrocytes was 1 million per 1 mL of medium. The cells were placed into separate wells of nine 24-well plates (ThermoFisher Scientific-Gibco; cat. # A15690601); therefore, each well contained 6×10⁴ endothelial cells and 3×10⁴ astrocytes placed on inserts with transparent polyester (PET) membrane with pore diameter 0.4 μm, pore density 2×106 cm2, and the culture surface 33.6 mm2 per single well (Greiner Bio-One GmbH-ThinCert™, Frickenhausen, Germany, cat. # 662641). RSV, with its molecular mass of 228 Da and lipid soluble properties, should potentially be able to cross the BBB [41].
The wells were coated with a reduced growth factor basement membrane extract used for attachment and maintenance of human cells. After coating each of the 216 wells with Gibco Geltrex Matrix, 3×10⁴ astrocyte suspension was put in each well with an Eppendorf pipette, so that after 24 h the astrocytes were fixed to the bottom and the medium portion was exchanged from DMEM to DMEM without glucose. Subsequently, the inserts were coated with type I collagen derived from rat tails (Merck C7661; cat. # C7661) and put into the wells. As soon as the collagen gained a gel-like consistence, 6×10⁴ endothelial cells were placed into the inserts. After another 24 h, the medium was exchanged to a new medium containing a definite concentration of glucose. Finally, the BBB model consisted of endothelial cells corresponding to MC and astrocytes corresponding to BC of the BBB. The co-culture of cells was maintained in a humidified incubator (37°C, 5% CO2). The scheme of the BBB in vitro model is presented in Figure 2. In addition, the diagram in Figure 3 shows when each respective cell type was plated, when medium was changed for glucose incubation using the 3 concentrations, and then the washout periods with respect to cytokine collection.
To evaluate the effect of different glucose concentrations in MC on cytokine profile in BC and to further evaluate the anti-inflammatory action of RSV on the same model in hypo-, normo-, and hyperglycemic environments, 3 solutions with different glucose concentrations were set up in MC, which corresponded to the study groups I–III (Table 1).
CYTOKINE CONCENTRATION MEASUREMENT:
Numerous existing studies suggest that differences in glucose concentration can change cytokine profile through modifying the production of pro-inflammatory cytokines [42,43]. To verify those findings, the concentrations of 6 different cytokines – IL-10, IL-12, IL-17A, IFN-γ, TNF-α, and GM-CSF – were assessed 24 h after the washout of glucose-containing medium in the BC (stage 1 of the study) using a Multi-Analyte ELISArray Kit (Qiagen-Q4Lab, Hilden, Germany; cat. #336161).
Cytokine absorbance, measured in absorbance units (Au), which relate to its concentration and transmittance [44], were measured with a Multi-Analyte ELISArray Kit, strictly following the instructions of the manufacturer (https://www.qiagen.com/se/resources/resourcedetail?id=1da64594-2ac6-4bbd-983e-828cc74d6927&lang=en). The multi-well ELISA microplates were already coated with a panel of target-specific antibodies to capture different cytokines. Each ELISArray microplate included biological samples plus positive and negative controls (each given cytokine standard of known concentration and blank dilution buffer, respectively), to ensure that the experiment was performed properly. To set up a negative control, sample dilution buffer was added to each well in the first row, without an experimental sample. In the positive control, the final antigen standard cocktail was placed in each well in the last row. The samples representing study groups were added to the remaining rows in the ELISArray plate.
Concentrations of pro-inflammatory cytokines were recorded by means of Au, while the absorbance was measured at 450 nm of wavelength, and the readings at 570 nm were subsequently subtracted from the readings at 450 nm to eliminate the background dilution buffer effect. A monochromator based, PC-controlled microplate reader Biochrom Asys UVM 340 (Biochrom-Harvard Bioscience, Holliston, MA, USA) with a wavelength range 340–800 nm and the measurement range of 0–3.2 optical density (OD) was used. The reproducibility of this apparatus is defined by the manufacturer as 0.8% and 0.005 OD from 0.10 to 2.0 OD at 450 nm, whereas the accuracy was provided as 0.5% and 0.005 OD from 0.1 to 1.0 OD at 450 nm; and 1.0% and 0.010 OD from 1.0 to 2.0 OD at 450 nm. The measurements were performed 6 times, after which the average values were calculated in Au that corresponded to the given cytokine’s concentration expressed in pg/ml ±standard error of measurement (SEM) as read from the standard curves (stage 1 of the study).
THE INDUCTION OF NEUROINFLAMMATION:
Lipopolysaccharide (LPS) solution was added into each well of the culture plate of BC to reach 0.2 μM and to induce the inflammatory response in BC. Concentrations of pro-inflammatory cytokines (IL-10, IL-12, IL-17A, TNF-α, IFN-γ, and GM-CSF) were counted by ELISA in all 3 study groups with different glucose concentrations after 12 and 36 h in BC. Therefore, 6 series of the measurements were carried out, with 6 measurements in each series (stage 2 of the study).
THE INFLUENCE OF LPS ON ASTROCYTE MORPHOLOGY:
We assessed the effect of LPS treatment on the morphology of astrocytic cells cultured in different glycemic conditions. Following the 36-h culture period after setting up the model of BBB for 3 study groups with or without LPS administration, the cells were fixed in 3% paraformaldehyde (PFA) in PBS for 30 min at room temperature, then they were paraffin embedded and stained with hematoxylin and eosin (H&E). Microscope images were acquired using an inverted cell culture Zeiss Primovert microscope equipped with light sources: HAL 35 W, 3W LED (Infinity Optics), and a Zeiss Axiocam 105 Colour camera. Images were analyzed using ZEN 2.3 software. The paraffin sections were examined under a light microscope (Leica DM 400B) by 2 independent experienced neuropathologists (50 images in each group), and photographs of the H&E-stained astrocytes were taken using a high-resolution camera attached to the microscope.
RSV’S PENETRATION THROUGH THE BBB AND ITS ANTI-INFLAMMATORY PROPERTIES IN BC:
The next stage of the study was to estimate whether RSV applied to MC effectively penetrated the BBB (stage 3 of the study) and exhibited its anti-inflammatory properties through lowering the concentration of pro-inflammatory cytokines in BC (stage 4 of the study). RSV solution (final concentration 50 μM) was applied to the MC and measured in BC after 12 and 24 h in 3 study groups with different glucose concentrations. The RSV level in BC was estimated based on the value of standard concentration of RSV indicated in the instruction for the ELISA test and on the Au values. After the calibration curve was constructed, the exact concentration of RSV in samples was calculated from the equation of the graph.
Each set of measurements was conducted 6 times in each study group, with the average values presented in the next section.
CONTROL GROUPS:
To validate the research model (BBB) and to enable the correct interpretation of the results, the appropriate control groups were designed at the respective stages of the study (Table 2).
At the first stage of the study, the control group with a basal medium without any glucose concentration was set up. While performing the next stage of the study (LPS addition), the control group was established and consisted of a basal medium with 0.2 μM LPS but without any glucose solution.
At the last stage of the study, the control group with the basal medium containing 0.2 μM LPS as well as 50 μM RSV but no glucose medium was added. Each set of measurements was conducted 6 times in each control group.
During the development of this BBB in vitro model, the effect of culture media exchange on the integrity of the co-culture of endothelial cells and astrocytes was also evaluated. At that time, no disturbances in the integrity of the barrier with regard to the transfer rate of glucose were found. Due to the much smaller fluid volumes, there is no reason to believe that administration of RSV from the MC side and LPS from the BC side could affect the integrity of the BBB in a purely mechanical way. In turn, the assessment of changes in the functional integrity of the BBB resulted from the implementation of the purpose of this study.
STATISTICAL ANALYSIS:
The statistical processing of the obtained data was performed using R programming language and its built-in functionalities (The R project for Statistical Computing; version 4.0.5) via the Mann-Whitney U test. All determinations were replicated 3 times and expressed as mean values with standard deviations.
A detailed description of the applied methods and the underlying principles is included in the subsequent
Results
CYTOKINE PROFILE AFTER 24 H FOLLOWING GLUCOSE ADMINISTRATION:
Differences in glucose concentration in MC affected the pro-inflammatory cytokine profile in BC after 24 h following glucose addition. The mean concentrations of cytokines in reference to the corresponding glucose concentrations are presented in Figure 4.
To test whether there were statistically significant differences between the control and experimental groups (groups with basal medium vs groups with glucose medium), the Mann-Whitney U test was performed, which was also used to examine whether there was a difference in cytokine concentrations among the 3 experimental groups. The null hypothesis indicated that the mean of each of the cytokine levels was the same regardless of glycemia, with an alternative hypothesis that normoglycemia would have a lower mean level of cytokines.
The statistically significant results were marked with * in Figure 4 when P values were less then adjusted 0.05 (P<0.05).
In 5 out of 6 cytokines (IL-10, IL-12, IL17A, INF-γ, and GM-CSF), the concentration was the lowest in the group containing normal glucose concentration (90 mg/dL), but not all of the results were statistically significant (statistically significant results are marked with * in Figure 4). The corresponding results in the group with abnormally low (40 mg/dL) and abnormally high (450 mg/dL) glucose concentrations differed in reference to individual cytokines. TNF-α concentrations were almost identical in groups imitating hypo- and normoglycemia, and the differences in concentrations were not statistically significant (P>0.6), while it was significantly higher (P<0.05) in hyperglycemia-imitating conditions (1.77±0.18 vs 2.063±0.2 [pg/ml ±SEM 10%]).
The level of IL-12 was highest in the samples obtained in the group imitating hypoglycemia and equaled on average 0.683±0.07 (pg/mL ±SEM 10%), whereas the lowest values were found in the samples from the normoglycemia-imitating environment (0.36±0.03 [pg/mL ±SEM 10%]), with
In the case of IL-10, the lowest level was obtained in the samples from the normoglycemic group (0.415±0.04 [pg/mL ±SEM 10%]), while in the other 2 groups its concentration was comparable and equaled on average 0.53 ±0.05 (pg/mL ±SEM 10%).
For INF-γ, the lowest values were found in the normoglycemic group (0.498 ±0.04 [pg/mL ±SEM 10%]), while higher in hypoglycemic (0.528±0.053 [pg/mL ±SEM 10%]) and hyperglycemic conditions (0.61±0.06 [pg/ml ±SEM 10%]), but the differences were significant only for the third group (
The mean level of GM-CSF was lowest in the normoglycemic group, and the value of 0.545±0.05 was significantly different (
LPS ADMINISTRATION:
At 12 h after administration of 650 μl of 1 μg/mL LPS solution to BC, the changes in concentrations for individual cytokines in BC were as shown in Figure 5.
At this stage of the experiment, the levels of 6 cytokines in BC as a reaction to adding LPS were compared. This test was performed separately for 12-h and 36-h periods and for each glucose level (normo-, hypo-, and hyper-glycemia).
The Mann-Whitney U test was performed based on the number of cytokines measured before LPS application. The null hypothesis was that the amount of each of the specific cytokines after 12 h and 36 h would be the same as before the application. The alternative hypothesis was that the amount of each of the specific cytokines would increase over time when LPS was applied.
The Mann-Whitney U test was used to assess whether there was a difference in cytokine concentrations between the 3 experimental groups following LPS administration. The obtained results presented in Figure 5 showed there were no statistically significant differences in any experimental group (P>0.05), and the cytokine concentrations did not increase significantly at 12 h after LPS solution administration (P>0.05).
After 12 h after LPS solution addition, concentrations of IL-10, IL-12, IL17A, and INF-γ were similar to their concentrations before. Moreover, the cytokine levels did not differ in regard to glucose concentration in MC, ie, they were almost the same, regardless of the coexisting glucose concentration.
In all of the experimental groups, LPS addition led to a slight increase in TNF-α concentration but did not reach statistical significance (
The cytokine concentrations increased significantly in BC 24 h after LPS administration in BC, as presented in Figure 6, marked with * (P<0.05). Therefore, LPS must have induced an inflammatory response within the BC, despite the fact that there was no significant difference 12 h after LPS administration. The 12-h interval after LPS addition appears to be too short to observe increased concentrations of pro-inflammatory cytokines (IL-12, IL17A, INF-γ, TNF-α, and GM-CSF) and decreased concentration of anti-inflammatory cytokines (IL-10).
A statistically significant cytokine level increase was found at 36 h after adding LPS to BC, marked with * (Figure 6). The biggest increase in cytokine concentration was for IL17A in group II (by 1.054 pg/ml; P<0.05), INF-γ in group III (by 0.791 pg/ml; P<0.05) and GM-CSF in group I and II (by 0.98 pg/ml and 0.96 pg/ml, respectively; P<0.02).
The statistical methods used in this part of the experiment were as described above. Statistical significance was judged at the 0.05 significance level (marked with *) or at the 0.02 significance level (marked with **) in Figure 6. The P value <0.02 indicates strong evidence against the null hypothesis, as there is less than a 2% probability the null hypothesis was correct and the results were random.
LPS ADMINISTRATION AND ASTROCYTE MORPHOLOGY:
Astrocytes from BC after glucose and after LPS administration are presented in Figure 7. The 36-h culture period after setting up the model of BBB for the 3 study groups and following LPS administration did not result in changes in the morphology or viability of the astrocytes based on the day exclusion test with trypan blue. Analyzing randomly selected photos on a blind basis, experienced neuropathologists were unable to detect differences in cell morphology. Considering the above, and after additional consultation with experts in the field of histopathology, further comparative morphometric analyses were abandoned.
ANTI-INFLAMMATORY EFFECT OF RSV IN THE BC:
The concentrations of individual cytokines for each coexisting glucose concentration after the addition of RSV solution with a concentration of 50 μM to the MC are presented in Figure 8.
This part of the experiment compared the levels of 6 cytokines 24 h after applying RSV to the MC to groups without RSV and was performed separately for each glucose level.
The Mann-Whitney U test was performed and the null hypothesis was that the amount of each of the specific cytokines 24 h after applying RSV would be the same as in groups with no RSV solution. The alternative hypothesis was that the amount of each of the specific cytokines would be reduced in samples with RSV applied.
Additionally, at this stage of the study, the percentage drop of concentration levels of 6 cytokines at 24 h after RSV addition in conditions of various glucose levels was compared. The percentage drop (effect of RSV) was based on comparison with the group without RSV solution.
The Mann-Whitney U test was performed, with the null hypothesis being that the amount of each of the specific cytokines 24 h after applying RSV would be the same regardless of glucose level. The normal glucose level is the one that was tested with the alternative hypothesis that it would generate a lower cytokine drop.
The RSV administration into MC reduced the concentration of all cytokines within the BC after 24 h regardless of glucose level, as compared to the groups without RSV, but not all the results were statistically significant (statistically significant results are marked with * in Figure 8).
In the normoglycemic (II) group, RSV significantly (
For IL-17A, the RSV level decreased most at normal glucose concentration, by 35.5%. The anti-inflammatory properties of this polyphenol were also demonstrated in groups I and III, although to a lesser extent, by 14.7% and 17.1%.
The level of IFN-γ was decreased by RSV most effectively in group II (by 20%), while in group I it fell by only 5.7% and in group III by 16%. These results were obtained within TNF-α and GM-CSF, and the greatest decline in their concentration was in group II.
The cytokines marked with * showed higher levels in the samples without RSV in comparison to those containing RSV (
However, in II group the decrease of cytokine concentrations was the largest, which indicates that this polyphenol acts the most efficiently in normoglycemic conditions.
RSV PENETRATION THROUGH THE BBB:
The concentration of RSV that reached BC after its administration to MC is presented in Figure 9. The results were read at 12 and 24 h after RSV addition.
In this part of the experiment, the RSV levels behind the BBB 12 h and 24 h after its application depending on the glucose level were compared. The Mann-Whitney U test for pairs was performed to check the null hypothesis that there was no difference in median of population with normoglycemia and hypoglycemia, as well as normoglycemia and hyperglycemia, with the alternative hypothesis that RSV penetration would be lower in hypoglycemia and hyperglycemia.
The quantity of RSV administrated in MC per 200 mL of medium was 2282.5 ng. Following the instructions given with the ELISA kits and using the formula for molar concentration of a substance, the concentration of RSV which reached BC was calculated and is presented in Figure 9. Only 0.53% of the total amount of RSV crossed in the in vitro model of BBB in hypoglycemia-simulating conditions, 0.61% for normoglycemia, and 0.55% for hyperglycemia-simulating conditions. The findings suggest that the permeability of BBB for RSV is low, and this polyphenol can cross this semi-permeable membrane in a smaller range compared to its initial concentration.
The largest amount of RSV in BC at 12 h following its administration in MC was achieved with normal glucose concentration (69.653 ng/mL), which is 16.1% and 9.9% more than in the hypoglycemia and hyperglycemia groups, respectively (
After 24 h after RSV administration to MC, its concentration in BC in group II remained at the highest level [62.391±6.24 (ng/mL ±SEM)], significantly higher than in the other groups [group I – 42.885±4.3 (ng/mL ±SEM); group III – 48.5±4.9 (ng/mL ±SEM)], with
The main findings from the study, presenting statistically significant changes in cytokine concentrations for different glucose concentrations, are shown collectively in the Table 3.
CORRELATIONS BETWEEN GLUCOSE CONCENTRATIONS AND CYTOKINE PROFILE:
At the first stage of the study, in comparison to normoglycemia-simulating conditions, hypoglycemia-simulating conditions resulted in higher concentrations of all cytokines except TNF-α. The largest increases were for IL-12 (+89.7%), IL-17A (+56.7%), and IL-10 (+25.3%); and the increases were smaller for GM-CSF (+18.9%) and IFN-γ (+6%).
When hyperglycemia-simulating conditions were compared to normoglycemia-simulating conditions, levels of all the studied cytokines were higher. The largest increases were for IL-10 (+31.3%), GM-CSF (+28.4%), and IL-12 (+23.1%), while there were smaller increases for IFN-γ (+22.4%), IL-17A (+13.7%), and TNF-α (+15.7%).
The concentrations of all the studied cytokines, except TNF-α, increased both in groups with abnormally low and high glucose concentration in MC. The concentration of TNF-α was only slightly decreased in hypoglycemia-simulating conditions.
When assessing cytokine concentration at 36 h after LPS administration, IL-17A (+41.7%), IL-12 (+46.1%), IFN-γ (+21.4%), GM-CSF (+10.1%), and TNF-α (+11.5%) showed higher levels in hypoglycemia-simulating conditions than in normoglycemia-simulating conditions, while the level of IL-10 (−66.2%) changed in the opposite direction. IL-10, unlike the other studied cytokines, has anti-inflammatory properties [45,46].
When assessing cytokine concentration 36 h after LPS administration, the concentrations of IL-12 (+37.1%), IFN-γ (+7.6%), and TNF-α (+12.3%) were higher in hyperglycemia-simulating conditions than in normoglycemia-simulating conditions, while of IL-10 (−66.3%), GM-CSF (−4.5%), and IL-17A (−18.1%) changed in the opposite direction.
When assessing cytokine concentration 24 h after RSV administration, IL-10 (+31.1%) showed higher level in normoglycemia-simulating conditions than in hypoglycemia-simulating conditions, while the levels of other studied cytokines (IFN-γ [-48.7%], IL-12 [−40.2%], IL-17A [−46.6%], TNF-α [−17.5%], and GM-CSF [−20.2%]) decreased.
All studied cytokines, except IL-10 (+28.5%) and IL-17A (+2.2%), showed lower concentration in normoglycemia-simulating conditions than in hyperglycemia-simulating conditions. The largest decrease was for IL-12 (−40%), and there were smaller decreases for IFN-γ (−19.4%), TNF-α (−18.7%), and GM-CSF (−14.9%).
Discussion
In this research, a special in vitro model was prepared to imitate the topography and properties of both compartments of the BBB – the vascular side of the BBB lined with endothelial cells, and the cerebrospinal fluid side of the BBB lined with astrocytes. Commercially available in vitro models of BBB may consist of endothelial cells only, or of endothelial cells and astrocytes; some models contain not only endothelial cells and astrocytes, but also pericytes. Different categorizations of BBB models depend on the species of origin of the cells used; therefore, human, mouse, porcine, rat, and bovine models are distinguished. The overview of several BBB in vitro models developed by researchers has been presented in the most recent reviews [47–50].
In our study, an in vitro BBB model was created from human endothelial cells and astrocytes separated with a membrane containing 0.4-μm-wide pores, which made direct contact between different types of cells impossible. The upper limit of pore size in the BBB that enables passive flow of molecules across is <1 nm [51]. Such a diameter of pores allows diffusion of small anti-inflammatory compounds (eg, RSV) from microvascular to brain compartments [52].
In this research, the circulating blood in the microvascular system was substituted by EBM-2 medium, which did not contain cellular and non-cellular blood components (eg, leukocytes, platelets, and insulin), which is preferable to present a clear correlation between glucose concentration and cytokine production; therefore, the advantage of the in vitro model used in this study is the ability to isolate the effects of glucose concentration on cytokine production. A model consisting of 2 types of cells with no interfering factors (eg, blood and its elements or cerebrospinal fluid) allows clear results and enables investigation of specific cellular and molecular mechanisms within the BBB. By measuring the passage of glucose and cytokines across the BBB model, it is possible to gain insights into how glucose and cytokines interact with the barrier and affect its permeability. This can explain how cytokines modulate BBB responses during inflammation.
A simplified interpretation of the results may be beneficial, showing pure relationships observed between glucose, LPS, RSV, and cytokine production by co-cultured endothelial cells in the MC and astrocytes in the BC. However, it creates an imperfect model and limits the possibility of direct translation of these results into in vivo conditions or implementation in clinical studies. The kind of model used in this study creates an inaccurate environment compared to in vivo conditions, where BBB is a highly selective and complex barrier, made not only of endothelial cells and astrocytes, but consists also of pericytes, basement membrane, and tight junctions. The McAllister study showed that glucose transport within in vivo BBB was also dependent on a serial chain of membrane-bound and intracellular transporters and enzymes, which were not present within in vitro models [53]. Although knowledge of the glucose transport and the role of glucose transporters within the BBB during systemic inflammation is still incomplete and needs further investigations, Jurcovicova’s review article [54] provides a valuable description of glucose transport within the BBB.
Additionally, diabetes, as a complex metabolic abnormality, differs from hyperglycemic conditions generated experimentally. Pathologic changes in the microvascular system of diabetic patients, including abnormal angiogenesis and increased vascular density, may influence cytokine levels and RSV activity [55,56].
The results obtained in our study suggest that impaired glucose concentration induces an inflammatory response in the BC, which is reflected in the changed pro-inflammatory cytokine profiles. Among the cytokines analyzed in this study, the increase in IL-12 concentration was particularly pronounced in hypoglycemia and hyperglycemia, compared to normoglycemic environments. The increase in IL-12 concentration in hyperglycemic conditions has also been observed in a study by Huang-Pin Wu, in which the stimulated peripheral blood mononuclear cells with hyperglycemic status secreted more IL-12 than those with normoglycemic status [57]. A study by Mei-Fang Li described how high glucose increases the expression of inflammatory cytokine genes (eg, for IL-12) in macrophages through H3K9 methyltransferase mechanism [58].
Other pro-inflammatory cytokines, such as IFN-γ and GM-CSF, also reached higher concentration in the BC in conditions that simulated hyperglycemia compared to normoglycemia. Numerous studies have shown that high glucose concentrations increase the levels of those cytokines in systems other than BBB [59–61].
The existing studies indicates that both hypoglycemia and hyperglycemia can lead to modifications in pro-inflammatory cytokine profiles, which indicates inflammation [62–65]. According to Esposito et al [66], the mechanism of pro-inflammatory cytokine induction by hyperglycemia consists mainly in stimulating ROS production, because in their study, the effect was abrogated by glutathione. However, Filho et al [67] attributed glucose concentration-dependent alterations in cytokine profile observed in vivo to anti-inflammatory actions of insulin [68] and cortisol, with cortisol concentration decreasing and insulin concentration increasing during the first stage of reaction to oral glucose ingestion. Changes in the cytokine profile occur in the second stage, when insulin concentration falls, while cortisol concentration is still low, and the deficiency of anti-inflammatory actions of cortisol and insulin combined results in increased production of many pro-inflammatory cytokines. In the third stage of oral glucose tolerance testing, when cortisol concentration begins returning to normal, increased production of anti-inflammatory cytokines is observed.
In the studies mentioned above, both indirect and direct effects of changing glucose concentration towards cytokine profile have been observed. The indirect effect comprises endocrine reaction to glucose concentration, with adequately altered secretion of insulin and cortisol. The direct effect refers to activation of pro-inflammatory cytokines production by hyperglycemia, through increased glucose influx to the cells, increased rates of oxidative glycolysis and TCA, combined with a high level of intracellular ATP, which can promote ROS production through lowering the NAD+/NADH ratio in mitochondria [69].
In our study, both decreased and increased glucose concentration in MC facilitated the onset and development of an inflammatory response in BC, measured by means of increased concentrations of IL-12, IL17A, INF-γ, TNF-α, and GM-CSF.
This study was performed in vitro, so indirect, hormonal effects of altered glucose concentration towards cytokine profile can be excluded. Hyperglycemia-raised production of pro-inflammatory cytokines, if it occurs, can be attributed to pro-oxidative actions of hyperglycemia. Explaining the changes in cytokine profile in hypoglycemia-simulating conditions is more difficult; theoretically, extreme hypoglycemia can cause ATP depletion, cell necrosis, and innate immunity activation by the products of necrosis [70]. However, we did not induce cell necrosis during our study, yet we observed altered cytokine profiles in moderate hypoglycemia-simulating conditions. It can be hypothesized that either astrocytes or endothelial cells can detect changes in glucose concentration within the extracellular environment, directly or indirectly. However, it is not known whether this detection works just like in beta cells of pancreatic islets, or whether there are there any other mechanisms of signal transduction [71]. Thus, complete explanation of these mechanisms requires further research.
We decided to administer LPS in the BC because the LPS administration was supposed to develop the expected inflammatory response. Therefore, the obtained results after LPS administration can be assumed as more reliable.
LPS as an immune system stimulator induces production of various pro-inflammatory cytokines, including TNF-α, GM-CSF, IFN-γ, IL-17A, and IL-12 [72,73].
When LPS is recognized by immune cells, such as macrophages and dendritic cells, through Toll-like receptor 4 (TLR4), it triggers a signaling cascade that leads to activation of transcription factors, such as NF-κB. This activation results in the production and release of various cytokines [74]. LPS also induces production of anti-inflammatory cytokines such as IL-10 as part of the immune response. IL-10 production is regulated by several transcription factors, including NF-κB and IRF3, which are activated by LPS stimulation [75].
The final part of the study was to assess the influence of glucose concentration on the ability of RSV to cross the BBB and on its potential anti-inflammatory effects within the CNS. In future it would be worth examining how other polyphenol substances, such as quercetin or rutin, would react to different glucose concentrations, and to evaluate their bioavailability, ability to cross the BBB, and to determine the appropriate potential dosage.
Our results show that the permeability of RSV was the greatest in the group with normal glucose concentration. In addition, the decline of RSV after 24 h was lower in this group than in the hypoglycemia and hyperglycemia groups. Hence, this flavonoid remained available for the longest time at high quantity in the normoglycemic group.
The impact of glucose concentration on RSV penetration into the brain have not been extensively studied. However, glucose concentration in blood can influence various factors that indirectly affect the transport and penetration of RSV across the BBB, and glucose concentration can affect the BBB integrity and tight junction function; thus, changes in glucose levels can impact permeability of the BBB, which in turn can influence the transport of RSV to the CNS [76,77]. Further research is necessary to understand the specific effects of glucose concentration on RSV penetration into the CNS, factors such as RSV dosage, formulation, timing of administration, and individual variations may also be significant.
Research studies indicate that despite some proven anti-inflammatory properties of RSV within CNS, its penetration through the BBB is poor [78]. RSV absorption after its oral administration can reach 75% and occurs mainly through transepithelial diffusion [79]. In addition, the metabolism of RSV in the intestine and liver results in oral bioavailability considerably less than 1% [80].
Thus, several methods are sought for to improve RSV penetration to the CSF, so that it could really exert its anti-inflammatory actions within the CNS. One of the methods is intrathecal administration of RSV. A study by Shu et al showed doubled RSV penetrability after its intrathecal administration in comparison to oral administration [81]. Another solution may be RSV molecule opsonization with some lipophilic compounds to increase its intestinal absorption, or nanoencapsulation in various structures, such as liposomes or micelles [82–84].
Yet another approach of improving RSV bioavailability for the CNS was presented by Chimento et al as modification of the RSV molecular structure, including methoxylation and hydroxylation of its aromatic rings [85]. Some novel drug delivery systems have been tested to increase the beneficial effects of RSV. Techniques used to improve RSV bioavailability are illustrated in Figure 10.
In the present study, RSV penetration through the BBB was taken into consideration, and further studies of cellular uptake by astrocytes could more accurately determine whether higher concentrations of RSV in the BC translate into improved use of RSV. Theoretically, based on the literature, there is no reason to doubt it, as is the case with human hepatic cells [86].
In this study, only 0.61% of the original amount of RSV was able to cross the BBB and was detected in BC in group II, while 0.53% and 0.55% crossed in the hypoglycemia and hyperglycemia groups. Despite that poor penetration, many studies suggest that even small amounts of RSV can exert beneficial effects towards the CNS due to its anti-inflammatory properties [87–89]. Furthermore, it has been shown that RSV in the CNS can slow progression of Alzheimer disease [78]. A detailed description of RSV mechanism of action in Alzheimer disease has been presented in a review [90].
Our study has some limitations. The 6 selected cytokines were examined instead of a group of about 30 pro-inflammatory cytokines identified to date. Thus, choosing some other pro-inflammatory cytokines could elicit complementary results [91].
In addition, we found that, at least in vitro, LPS stimulates the production of different pro- inflammatory cytokines with additional latency, which should be considered when planning future in vivo studies. Naturally, endothelial cells in the co-culture also react to LPS. The assessment of the magnitude and speed of this inflammatory response may be a goal in future studies [92]. Our results suggest that further research is needed on the astrocyte response to inflammation in conditions simulating hypo-, normo-, and hyperglycemia.
Considering that different concentrations of glucose and different courses of the inflammatory reaction affect the acid–base balance, the stability and bioavailability of RSV may depend on pH. Therefore, to validating our results, the experiments could be repeated, additionally determining the pH (pH micro-measurements in culture plates) in the microvascular and brain compartments.
Neuroinflammation is a common feature of many CNS disorders, including neurodegenerative diseases (such as Parkinson and Alzheimer diseases), multiple sclerosis, and stroke, and chronic neuroinflammation can contribute to neuronal damage and disease progression. Thus, it is crucial to reduce the harmful effects of chronic neuroinflammation by finding effective anti-inflammatory strategies. RSV, with its proven properties, can modulate various signaling pathways involved in inflammation. It can suppress the production of inflammatory cytokines (eg, TNF-α, IL12, and IL-17) [93,94], inhibit the activation of pro-inflammatory transcription factors (eg, NF-κB) [95], and as an anti-oxidative agent RSV can help reduce oxidative damage and protect neurons from free radicals and ROS [96,97], which are often present in neuroinflammation.
By conducting in vitro experiments, as in our study, it is possible to gain insights into the impact of glucose concentration on RSV’s ability to penetrate and cross the BBB. The mechanisms of RSV uptake by astrocytes are still being studied and there may be many pathways involved. The primary mode of RSV uptake is passive diffusion; due to RSV’s lipophilic nature, it can passively diffuse across cell membranes, as in astrocytes, and studies have suggested the involvement of transporters in its cellular uptake by astrocytes. Organic anion-transporting polypeptides (OATPs) and ATP-binding cassette (ABC) transporters have been implicated in the uptake of RSV in various cell types, including astrocytes [98–101]. These transporters may facilitate the entry of RSV into astrocytes, potentially increasing its uptake efficiency. When RSV is taken up by astrocytes, it can be distributed within different cellular compartments. It has been found in the nucleus, cytoplasm, and mitochondria of astrocytes, which suggest its potential interactions with various cellular components and signaling pathways [102,103]. In addition, RSV has been reported to enhance synaptic plasticity, which plays a role in learning and memory processes, and it can expedite the formation of synaptic connections by modulation of neurotransmitter systems and neurotrophic factors [104,105]. Some studies suggest that RSV can also influence BBB integrity and function, which regulates the entry of substances into the brain. Thus, RSV may influence drug delivery to the CNS and thus modulate some CNS disorders [106,107].
It is essential to further explore RSV’s properties by conducting preclinical studies to clarify the mechanism of action, optimizing dosage regimens, and evaluating its efficacy and safety in relevant animal models. Then, clinical trials are needed to assess this potential in patients with CNS diseases.
Conclusions
In our experiment, RSV decreased the concentrations of pro- and anti-inflammatory cytokines in all 3 study groups, regardless of the glucose concentrations, but exerted the strongest anti-inflammatory properties in a normoglycemic environment.
The strength of those properties depended not only on the glucose concentration in the MC but also on the cytokine studied. The strong effects of RSV were obtained for IFN-γ and TNF-α, which is compatible with the findings of Torregrosa-Muñumer from an in vivo study performed on old male rats, where the expression of 2 major inflammatory markers, INF-γ and TNF-α, increased with aging, but were subsequently reduced to the levels observed in hearts of young animals after RSV supplementation [108].
Our results show it is essential to maintain normoglycemia, since the anti-inflammatory effects of substances such as RSV can be most effectively exerted under normoglycemic conditions. Furthermore, prolonged hyperglycemia induces ROS production in astrocytes and pericytes, which additionally increases CNS inflammation [109].
Accordingly, supplementation of this flavonoid in diabetic patients is worth considering.
Figures
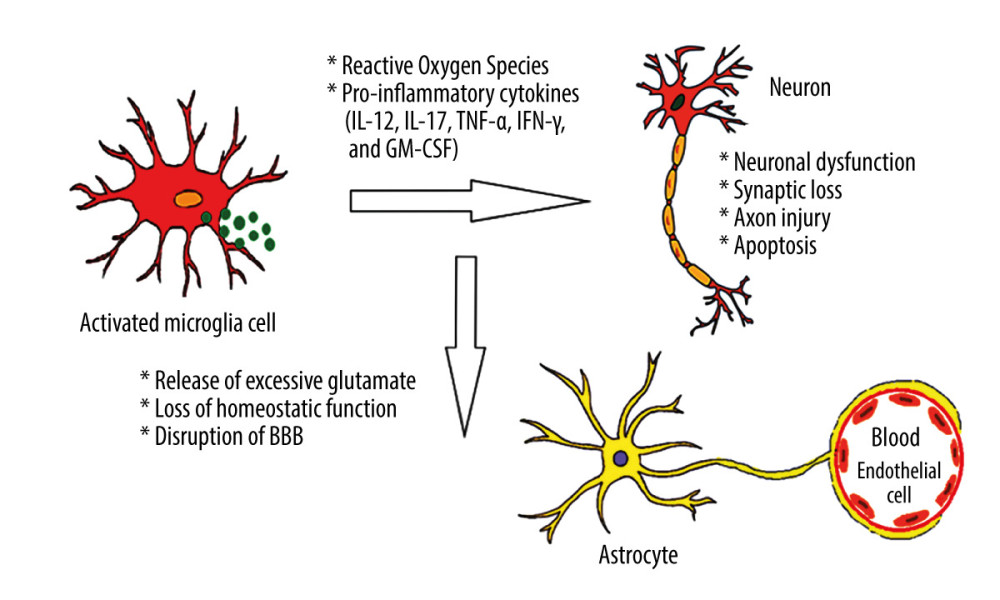 Figure 1. Effects of hyperglycemia within central nervous system. Created using Microsoft® PowerPoint® 2013 (154.0.5363.1000) MSO, Microsoft Corporation.
 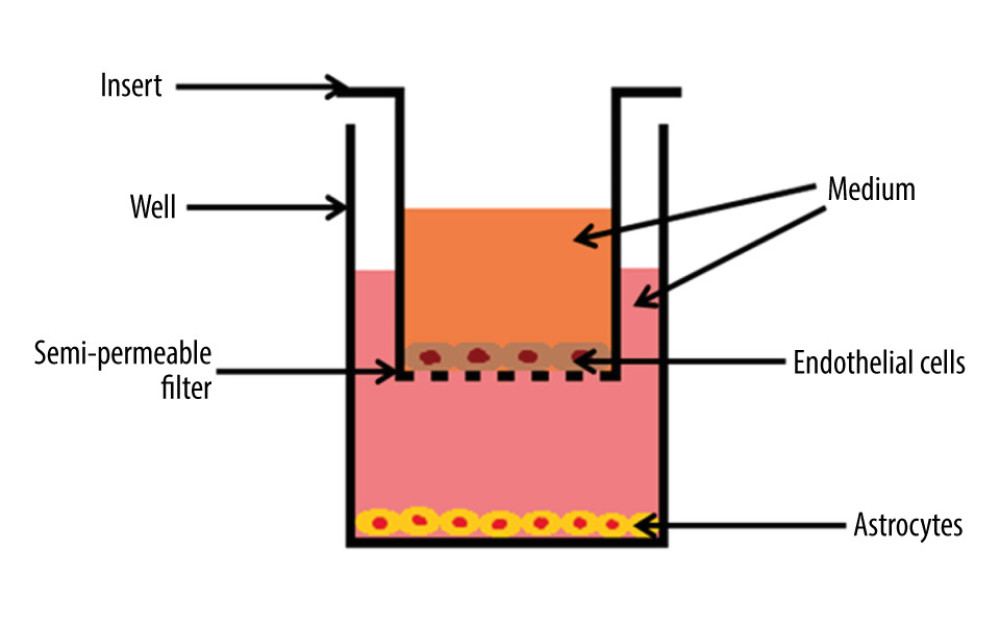 Figure 2. The cross-section scheme of in vitro model of blood–brain barrier containing co-culture of endothelial cells and astrocytes. The basement membrane with pore diameter 0.4 μm. Created using Microsoft® PowerPoint® 2013 (154.0.5363.1000) MSO, Microsoft Corporation.
 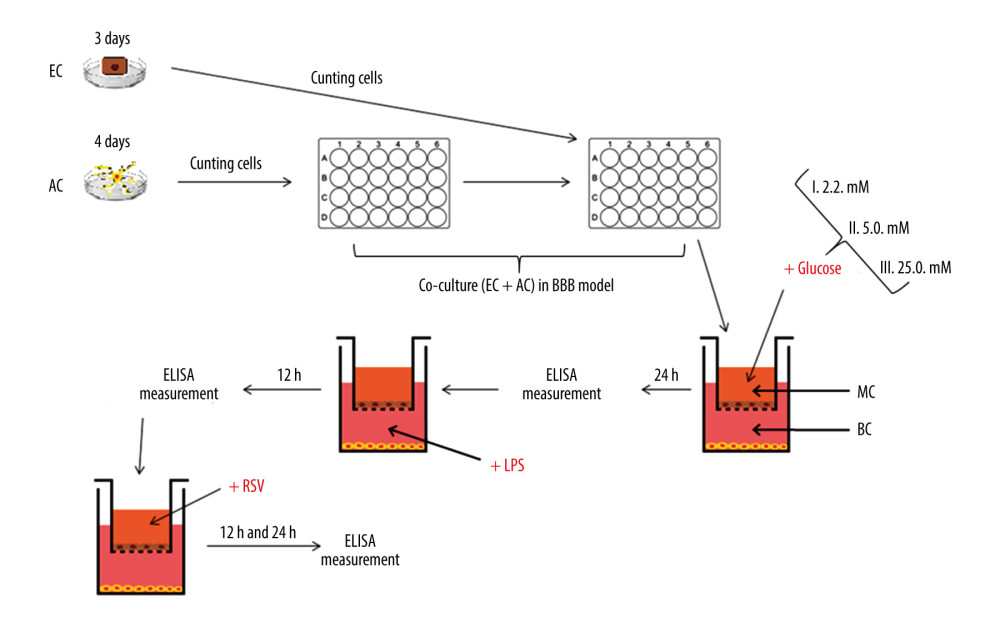 Figure 3. The diagram illustrating the process of establishing an in vitro blood–brain model and the stages of the study. EC – endothelial cells; AC – astrocytes; MC – microvascular compartment of BBB; BC – brain compartment of BBB; LPS – lipopolysaccharide’ RSV – resveratrol. Created using Microsoft® PowerPoint® 2013 (154.0.5363.1000) MSO, Microsoft Corporation.
 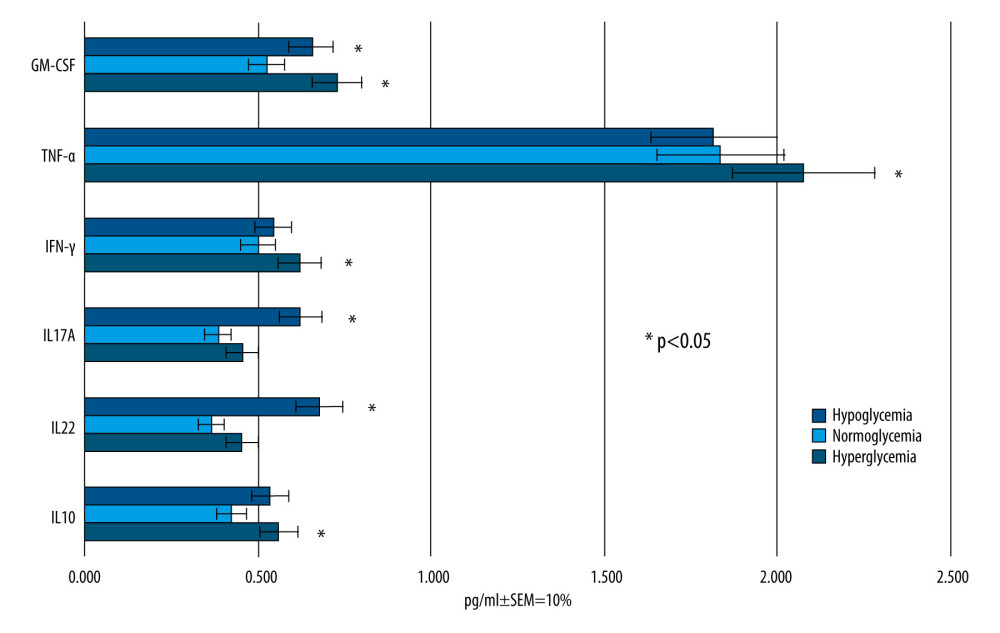 Figure 4. Mean values of cytokine concentrations (pg/ml) in brain compartment 24 h after different glucose concentrations applied in microvascular compartment. SEM – standard error of measurement (±10%). Created using Microsoft® PowerPoint® 2013 (154.0.5363.1000) MSO, Microsoft Corporation.
 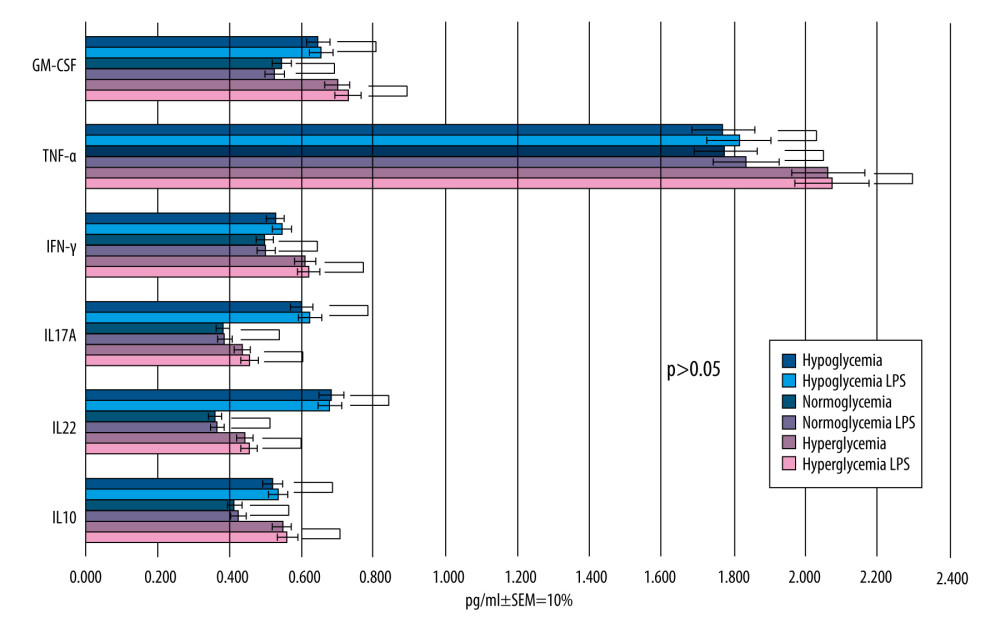 Figure 5. Mean values of cytokine concentrations (pg/ml) in brain compartment 12 h after LPS was been added to brain compartment in the 3 studied groups. In comparison, concentrations of the same cytokines in LPS-free conditions. SEM – standard error of measurement (±10%). Created using Microsoft® PowerPoint® 2013 (154.0.5363.1000) MSO, Microsoft Corporation.
 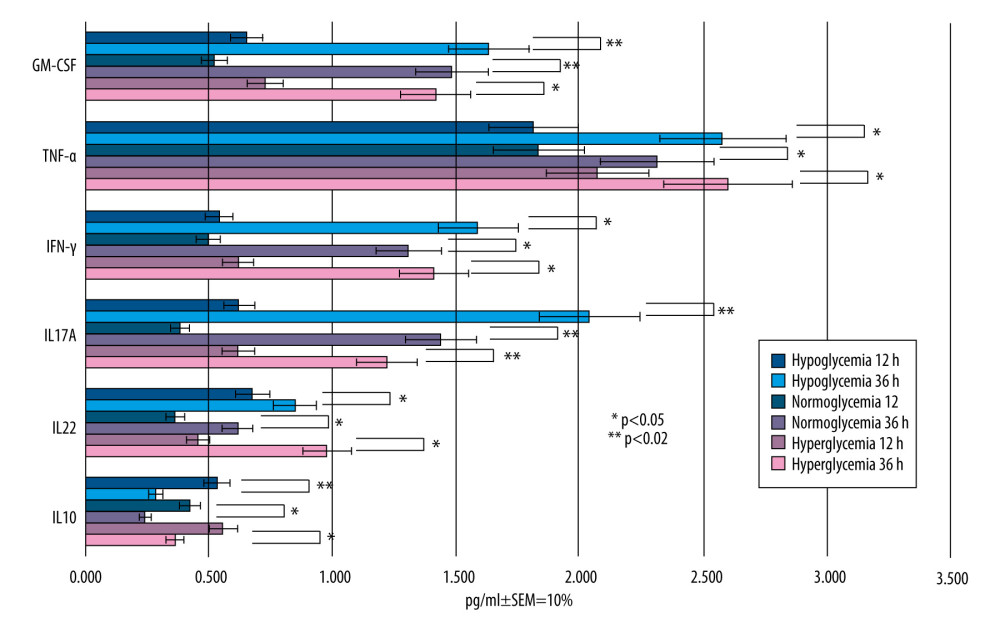 Figure 6. Mean values of cytokine concentrations (pg/ml) in brain compartment 36 h after administration of LPS compared to 12 h after LPS administration in the 3 studied groups. SEM – standard error of measurement (±10%). Created using Microsoft® PowerPoint® 2013 (154.0.5363.1000) MSO, Microsoft Corporation.
 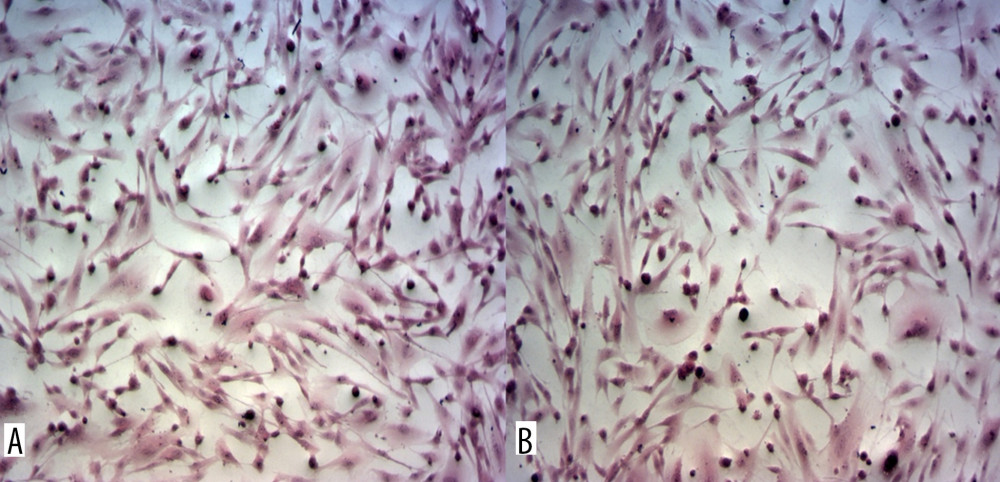 Figure 7. Astrocytes from brain compartment after glucose administration. (A) Staining with hematoxylin and eosin. (B) Astrocytes from brain compartment after glucose and LPS administration. Staining with hematoxylin and eosin. No visible changes in the morphology of the astrocytes were observed. Magnification 100×. The picture was captured using LAS-X, the standard microscope imaging software from Leica Microsystems, Wetzlar, Germany.
 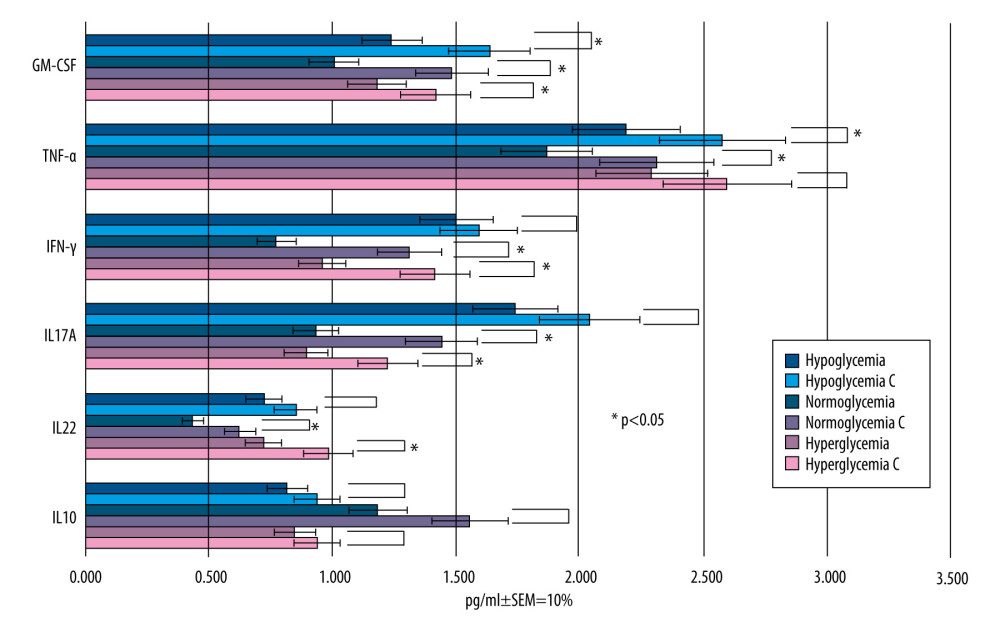 Figure 8. Mean values of cytokine concentrations in brain compartment (pg/ml) 36 h after administration of LPS and 24 h after addition of RSV to the microvascular compartment. For comparison, concentrations of the same cytokines in the samples to which LPS was added and RSV was not added (control samples are marked with the letter C). SEM – standard error of measurement (±10%). Created using Microsoft® PowerPoint® 2013 (154.0.5363.1000) MSO, Microsoft Corporation.
  Figure 9. Mean RSV concentrations (ng/ml) in the brain compartment 12 and 24 h after RSV addition to the microvascular compartment of hypo-, normo-, and hyperglycemia-simulating samples. SEM – standard error of measurement (±10%). Created using Microsoft® PowerPoint® 2013 (154.0.5363.1000) MSO, Microsoft Corporation.
  Figure 10. Resveratrol delivery systems. Created using Microsoft® PowerPoint® 2013 (154.0.5363.1000) MSO, Microsoft Corporation.
 Tables
Table 1. The 3 glucose concentrations used within microvascular compartment corresponding to decreased, normal, or increased blood glucose levels in vivo (hypo-, normo-, and hyperglycemia, respectively). Table 2. The set of controls established for experiments using the blood–brain barrier in vitro model.
 Table 3. The changes in cytokine concentrations for different glucose concentrations.
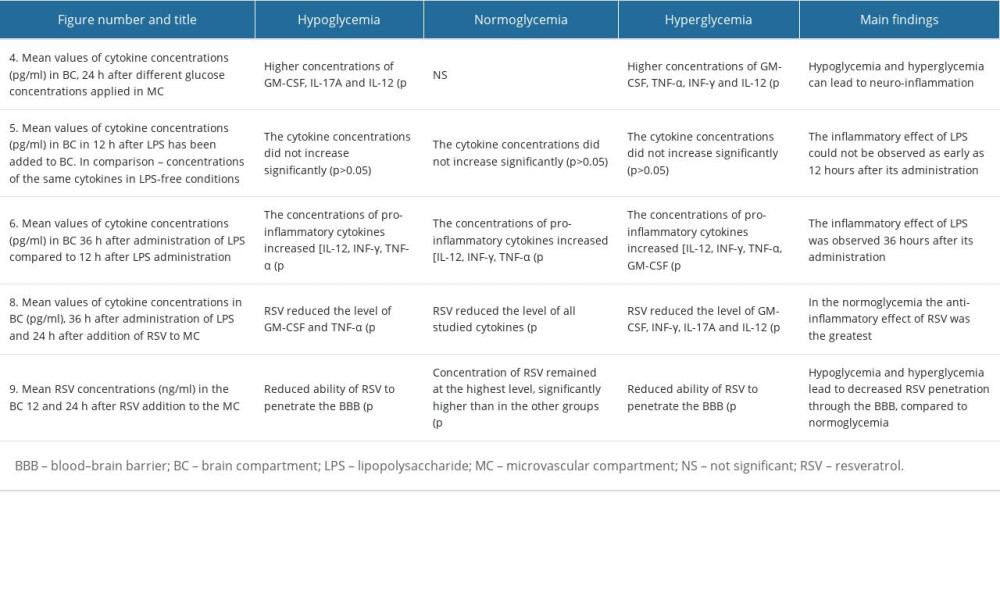
References
1. Zimmet P, Alberti KG, Magliano DJ, Bennett PH, Diabetes mellitus statistics on prevalence and mortality: Facts and fallacies: Nat Rev Endocrinol, 2016; 12(10); 616-22
2. Nan K, Han Y, Fang Q, HMGB1 gene silencing inhibits neuroinflammation via down-regulation of NF-κB signaling in primary hippocampal neurons induced by Aβ25–35: Int Immunopharmacol, 2019; 67; 294-301
3. Shoelson SE, Herrero L, Naaz A, Obesity, inflammation, and insulin resistance: Gastroenterology, 2007; 132(6); 2169-80
4. Nogueira-Machado JA, Volpe CM, HMGB1, TLR and RAGE: A functional tripod that leads to diabetic inflammation: Expert Opin Ther Targets, 2011; 15(8); 1023-35
5. Prasad S, Sajja RK, Naik P, Cucullo L, Diabetes mellitus and blood–brain barrier dysfunction: An overview: J Pharmacovigil, 2014; 2(2); 125
6. Brownlee M, Biochemistry and molecular cell biology of diabetic complications: Nature, 2001; 414(6865); 813-20
7. Giacco F, Brownlee M, Oxidative stress and diabetic complications: Circ Res, 2010; 107(9); 1058-70
8. Andersson U, Wang H, Palmblad K, High mobility group 1 protein (HMG-1) stimulates proinflammatory cytokine synthesis in human monocytes: J Exp Med, 2000; 192(4); 565-70
9. Jeong JH, Lee DH, Song J, HMGB1 signaling pathway in diabetes-related dementia: Blood–brain barrier breakdown, brain insulin resistance, and Aβ accumulation: Biomed Pharmacother, 2022; 150; 112933
10. Xiao W, Wang RS, Handy DE, Loscalzo J, NAD(H) and NADP(H) redox couples and cellular energy metabolism: Antioxid Redox Signal, 2018; 28(3); 251-72
11. Ceriello A, Motz E, Is oxidative stress the pathogenic mechanism underlying insulin resistance, diabetes, and cardiovascular disease? The common soil hypothesis revisited: Arterioscler Thromb Vasc Biol, 2004; 24(5); 816-23
12. Toth AE, Helms HC, Harazin A, Sortilin regulates blood–brain barrier integrity: FEBS J, 2022; 289(4); 1062-79
13. Kim Y, Park J, Choi YK, The role of astrocytes in the central nervous system focused on BK channel and heme oxygenase metabolites: A review: Antioxidants (Basel), 2019; 8(5); 121
14. Bélanger M, Magistretti PJ, The role of astroglia in neuroprotection: Dialogues Clin Neurosci, 2009; 11(3); 281-95
15. Liyanagamage DSNK, Martinus RD, Role of mitochondrial stress protein HSP60 in Diabetes-induced neuroinflammation: Mediators Inflamm, 2020; 2020; 8073516
16. Goldberg ND, O’Toole AG, The properties of glycogen synthetase and regulation of glycogen biosynthesis in rat brain: J Biol Chem, 1969; 244(11); 3053-61
17. Duran J, Gruart A, López-Ramos JC, Glycogen in astrocytes and neurons: Physiological and pathological aspects: Adv Neurobiol, 2019; 23; 311-29
18. Cryer PE, Hypoglycemia, functional brain failure, and brain death: J Clin Invest, 2007; 117(4); 868-70
19. Kalra S, Mukherjee JJ, Venkataraman S, Hypoglycemia: The neglected complication: Indian J Endocrinol Metab, 2013; 17(5); 819-34
20. Razavi Nematollahi L, Kitabchi AE, Stentz FB, Proinflammatory cytokines in response to insulin-induced hypoglycemic stress in healthy subjects: Metabolism, 2009; 58(4); 443-448 Erratum in: Metabolism. 2009;58(7):1046
21. Joy NG, Tate DB, Younk LM, Davis SN, Effects of acute and antecedent hypoglycemia on endothelial function and markers of atherothrombotic balance in healthy humans: Diabetes, 2015; 64(7); 2571-80
22. Kahal H, Halama A, Aburima A, Effect of induced hypoglycemia on inflammation and oxidative stress in type 2 diabetes and control subjects: Sci Rep, 2020; 10(1); 4750
23. Byun K, Bayarsaikhan E, Kim D, Activated microglial cells synthesize and secrete AGE-albumin: Anat Cell Biol, 2012; 45(1); 47-52
24. Guerin-Dubourg A, Catan A, Bourdon E, Rondeau P, Structural modifications of human albumin in diabetes: Diabetes Metab, 2012; 38(2); 171-78
25. Lyons TJ, Basu A, Biomarkers in diabetes: hemoglobin A1c, vascular and tissue markers: Transl Res, 2012; 159(4); 303-12
26. Bauernfeind FG, Horvath G, Stutz A, Cutting edge: NF-kappaB activating pattern recognition and cytokine receptors license NLRP3 inflammasome activation by regulating NLRP3 expression: J Immunol, 2009; 183(2); 787-91
27. Shaftel SS, Griffin WS, O’Banion MK, The role of interleukin-1 in neuroinflammation and Alzheimer disease: an evolving perspective: J Neuroinflammation, 2008; 5; 7
28. Cho SH, Chen JA, Sayed F, SIRT1 deficiency in microglia contributes to cognitive decline in aging and neurodegeneration via epigenetic regulation of IL-1β: J Neurosci, 2015; 35(2); 807-18
29. Halle A, Hornung V, Petzold GC, The NALP3 inflammasome is involved in the innate immune response to amyloid-beta: Nat Immunol, 2008; 9(8); 857-65
30. Ising C, Venegas C, Zhang S, NLRP3 inflammasome activation drives tau pathology: Nature, 2019; 575(7784); 669-73
31. Li Y, Liu L, Barger SW, Griffin WS, Interleukin-1 mediates pathological effects of microglia on tau phosphorylation and on synaptophysin synthesis in cortical neurons through a p38-MAPK pathway: J Neurosci, 2003; 23(5); 1605-11
32. Kitazawa M, Oddo S, Yamasaki TR, Lipopolysaccharide-induced inflammation exacerbates tau pathology by a cyclin-dependent kinase 5-mediated pathway in a transgenic model of Alzheimer’s disease: J Neurosci, 2005; 25(39); 8843-53
33. Quintanilla RA, Orellana DI, González-Billault C, Maccioni RB, Interleukin-6 induces Alzheimer-type phosphorylation of tau protein by deregulating the cdk5/p35 pathway: Exp Cell Res, 2004; 295(1); 245-57
34. Holthoff JH, Woodling KA, Doerge DR, Resveratrol, a dietary polyphenolic phytoalexin, is a functional scavenger of peroxynitrite: Biochem Pharmacol, 2010; 80(8); 1260-65
35. Foti MC, Antioxidant properties of phenols: J Pharm Pharmacol, 2007; 59(12); 1673-85
36. Wiedemann J, Rashid K, Langmann T, Resveratrol induces dynamic changes to the microglia transcriptome, inhibiting inflammatory pathways and protecting against microglia-mediated photoreceptor apoptosis: Biochem Biophys Res Commun, 2018; 501(1); 239-45
37. Moussa C, Hebron M, Huang X, Resveratrol regulates neuro-inflammation and induces adaptive immunity in Alzheimer’s disease: J Neuroinflammation, 2017; 14(1); 1
38. Berman AY, Motechin RA, Wiesenfeld MY, Holz MK, The therapeutic potential of resveratrol: A review of clinical trials: NPJ Precis Oncol, 2017; 1; 35
39. Weksler B, Romero IA, Couraud PO, The hCMEC/D3 cell line as a model of the human blood brain barrier: Fluids Barriers CNS, 2013; 10(1); 16
40. Busschots S, O’Toole S, O’Leary JJ, Stordal B, Non-invasive and non-destructive measurements of confluence in cultured adherent cell lines: MethodsX, 2014; 2; 8-13
41. Amri A, Chaumeil JC, Sfar S, Charrueau C, Administration of resveratrol: What formulation solutions to bioavailability limitations?: J Control Release, 2012; 158(2); 182-93
42. Hu R, Xia CQ, Butfiloski E, Clare-Salzler M, Effect of high glucose on cytokine production by human peripheral blood immune cells and type I interferon signaling in monocytes: Implications for the role of hyperglycemia in the diabetes inflammatory process and host defense against infection: Clin Immunol, 2018; 195; 139-48
43. Drummond JB, Barbosa IG, Dantzer R, Teixeira AL, The effect of insulin-induced hypoglycemia on inflammatory markers: A systematic review: Brain Behav Immun, 2018; 73; 41-50
44. Mayerhöfer TG, Pipa AV, Popp J, Beer’s law-why integrated absorbance depends linearly on concentration: Chemphyschem, 2019; 20(21); 2748-53
45. Yanik BM, Dauch JR, Cheng HT, Interleukin-10 reduces neurogenic inflammation and pain behavior in a mouse model of type 2 diabetes: J Pain Res, 2020; 13; 3499-512
46. Kany S, Vollrath JT, Relja B, Cytokines in Inflammatory Disease: Int J Mol Sci, 2019; 20(23); 6008
47. Takeshita Y, Kanda TThe Blood–brain barrier (BBB) and in vitro BBB models: Brain Nerve, 2015; 67(8); 1035-42 in Japanese
48. Wilhelm I, Fazakas C, Krizbai IA, In vitro models of the blood–brain barrier: Acta Neurobiol Exp (Wars), 2011; 71(1); 113-28
49. Helms HC, Abbott NJ, Burek M, In vitro models of the blood–brain barrier: An overview of commonly used brain endothelial cell culture models and guidelines for their use: J Cereb Blood Flow Metab, 2016; 36(5); 862-90
50. Czupalla CJ, Liebner S, Devraj K, In vitro models of the blood–brain barrier: Methods Mol Biol, 2014; 1135; 415-37
51. Jain KK, Nanobiotechnology-based strategies for crossing the blood–brain barrier: Nanomedicine (Lond), 2012; 7(8); 1225-33
52. Amri A, Chaumeil JC, Sfar S, Charrueau C, Administration of resveratrol: What formulation solutions to bioavailability limitations?: J Control Release, 2012; 158(2); 182-93
53. McAllister MS, Krizanac-Bengez L, Macchia F, Mechanisms of glucose transport at the blood–brain barrier: An in vitro study: Brain Res, 2001; 904(1); 20-30
54. Jurcovicova J, Glucose transport in brain – effect of inflammation: Endocr Regul, 2014; 48(1); 35-48
55. Barrett EJ, Liu Z, Khamaisi M, Diabetic microvascular disease: An Endocrine Society scientific statement: J Clin Endocrinol Metab, 2017; 102(12); 4343-10
56. Romay MC, Toro C, Iruela-Arispe ML, Emerging molecular mechanisms of vascular dementia: Curr Opin Hematol, 2019; 26(3); 199-206
57. Wu HP, Chen CH, Hsieh HC, Liu YC, Effects of insulin and glucose on cytokine production from peripheral blood mononuclear cells: Chang Gung Med J, 2008; 31(3); 253-59
58. Li MF, Zhang R, Li TT, High glucose increases the expression of inflammatory cytokine genes in macrophages through H3K9 methyltransferase mechanism: J Interferon Cytokine Res, 2016; 36(1); 48-61
59. Gonzalez Y, Herrera MT, Soldevila G, High glucose concentrations induce TNF-α production through the down-regulation of CD33 in primary human monocytes: BMC Immunol, 2012; 13; 19
60. Sousa ESA, Queiroz LAD, Guimarães JPT, The influence of high glucose conditions on macrophages and its effect on the autophagy pathway: Front Immunol, 2023; 14; 1130662
61. Surendar J, Mohan V, Pavankumar N, Increased levels of serum granulocyte-macrophage colony-stimulating factor is associated with activated peripheral dendritic cells in type 2 diabetes subjects (CURES-99): Diabetes Technol Ther, 2012; 14(4); 344-49
62. Iqbal A, Prince LR, Novodvorsky P, Effect of hypoglycemia on inflammatory responses and the response to low-dose endotoxemia in humans: J Clin Endocrinol Metab, 2019; 104(4); 1187-99
63. Kahal H, Halama A, Aburima A, Effect of induced hypoglycemia on inflammation and oxidative stress in type 2 diabetes and control subjects: Sci Rep, 2020; 10(1); 4750 Erratum in: Sci Rep. 2020;10(1):10233
64. Tsalamandris S, Antonopoulos AS, Oikonomou E, The role of inflammation in diabetes: current concepts and future perspectives: Eur Cardiol, 2019; 14(1); 50-59
65. Collier B, Dossett LA, May AK, Diaz JJ, Glucose control and the inflammatory response: Nutr Clin Pract, 2008; 23(1); 3-15
66. Esposito K, Nappo F, Marfella R, Inflammatory cytokine concentrations are acutely increased by hyperglycemia in humans: role of oxidative stress: Circulation, 2002; 106(16); 2067-72
67. Filho EW, Marcon SS, Krupek T, Blood levels of pro-inflammatory and anti-inflammatory cytokines during an oral glucose tolerance test in patients with symptoms suggesting reactive hypoglycemia: Braz J Med Biol Res, 2016; 49(8); e5195
68. Sun Q, Li J, Gao F, New insights into insulin: The anti-inflammatory effect and its clinical relevance: World J Diabetes, 2014; 5(2); 89-96
69. Ighodaro OM, Molecular pathways associated with oxidative stress in diabetes mellitus: Biomed Pharmacother, 2018; 108; 656-62
70. Auer RN, Hypoglycemic brain damage: Metab Brain Dis, 2004; 19(3–4); 169-75
71. Suckale J, Solimena M, Pancreas islets in metabolic signaling-focus on the beta-cell: Front Biosci, 2008; 13; 7156-71
72. Schilling E, Weiss R, Grahnert A, Molecular mechanism of LPS-induced TNF-α biosynthesis in polarized human macrophages: Mol Immunol, 2018; 93; 206-15
73. Li W, Yang S, Kim SO: Reprod Sci, 2014; 21(7); 939-47
74. Ciesielska A, Matyjek M, Kwiatkowska K, TLR4 and CD14 trafficking and its influence on LPS-induced pro-inflammatory signaling: Cell Mol Life Sci, 2021; 78(4); 1233-61
75. Iyer SS, Cheng G, Role of interleukin 10 transcriptional regulation in inflammation and autoimmune disease: Crit Rev Immunol, 2012; 32(1); 23-63
76. Prasad S, Sajja RK, Naik P, Cucullo L, Diabetes mellitus and blood–brain barrier dysfunction: An overview: J Pharmacovigil, 2014; 2(2); 125
77. Yoo DY, Yim HS, Jung HY, Chronic type 2 diabetes reduces the integrity of the blood–brain barrier by reducing tight junction proteins in the hippocampus: J Vet Med Sci, 2016; 78(6); 957-62
78. Andrade S, Ramalho MJ, Pereira MDC, Loureiro JA, Resveratrol brain delivery for neurological disorders prevention and treatment: Front Pharmacol, 2018; 9; 1261
79. Springer M, Moco S, Resveratrol and its human metabolites-effects on metabolic health and obesity: Nutrients, 2019; 11(1); 143
80. Walle T, Bioavailability of resveratrol: Ann NY Acad Sci, 2011; 1215; 9-15
81. Shu XH, Wang LL, Li H, Diffusion efficiency and bioavailability of resveratrol administered to rat brain by different routes: Therapeutic implications: Neurotherapeutics, 2015; 12(2); 491-501
82. Neves AR, Lúcio M, Martins S, Novel resveratrol nanodelivery systems based on lipid nanoparticles to enhance its oral bioavailability: Int J Nanomedicine, 2013; 8; 177-87
83. Singh A, Ahmad I, Ahmad S, A novel monolithic controlled delivery system of resveratrol for enhanced hepatoprotection: Nanoformulation development, pharmacokinetics and pharmacodynamics: Drug Dev Ind Pharm, 2016; 42(9); 1524-36
84. Pandita D, Kumar S, Poonia N, Lather V, Solid lipid nanoparticles enhance oral bioavailability of resveratrol, a natural polyphenol: Food Res Int, 2014; 62; 1165-74
85. Chimento A, De Amicis F, Sirianni R, Progress to improve oral bioavailability and beneficial effects of resveratrol: Int J Mol Sci, 2019; 20(6); 1381
86. Lançon A, Delmas D, Osman H, Human hepatic cell uptake of resveratrol: Involvement of both passive diffusion and carrier-mediated process: Biochem Biophys Res Commun, 2004; 316(4); 1132-37
87. de Sá Coutinho D, Pacheco MT, Frozza RL, Bernardi A, Anti-inflammatory effects of resveratrol: Mechanistic insights: Int J Mol Sci, 2018; 19(6); 1812
88. Renaud J, Martinoli MG, Resveratrol as a protective molecule for neuroinflammation: A review of mechanisms: Curr Pharm Biotechnol, 2014; 15(4); 318-29
89. Zhang F, Liu J, Shi JS, Anti-inflammatory activities of resveratrol in the brain: Role of resveratrol in microglial activation: Eur J Pharmacol, 2010; 636(1–3); 1-7
90. Komorowska J, Wątroba M, Szukiewicz D, Review of beneficial effects of resveratrol in neurodegenerative diseases such as Alzheimer’s disease: Adv Med Sci, 2020; 65(2); 415-23
91. Becher B, Spath S, Goverman J, Cytokine networks in neuroinflammation: Nat Rev Immunol, 2017; 17(1); 49-59
92. Malaguarnera L, Influence of resveratrol on the immune response: Nutrients, 2019; 11(5); 946
93. Manna SK, Mukhopadhyay A, Aggarwal BB, Resveratrol suppresses TNF-induced activation of nuclear transcription factors NF-kappa B, activator protein-1, and apoptosis: Potential role of reactive oxygen intermediates and lipid peroxidation: J Immunol, 2000; 164(12); 6509-19
94. Meng T, Xiao D, Muhammed A, Anti-inflammatory action and mechanisms of resveratrol: Molecules, 2021; 26(1); 229
95. Xu L, Botchway BOA, Zhang S, Inhibition of NF-κB signaling pathway by resveratrol improves spinal cord injury: Front Neurosci, 2018; 12; 690
96. Ma X, Sun Z, Liu Y, Resveratrol improves cognition and reduces oxidative stress in rats with vascular dementia: Neural Regen Res, 2013; 8(22); 2050-59
97. Miguel CA, Noya-Riobó MV, Mazzone GL, Antioxidant, anti-inflammatory and neuroprotective actions of resveratrol after experimental nervous system insults. Special focus on the molecular mechanisms involved: Neurochem Int, 2021; 150; 105188
98. Furihata T, Anzai N, Functional expression of organic ion transporters in astrocytes and their potential as a drug target in the treatment of central nervous system diseases: Biol Pharm Bull, 2017; 40(8); 1153-60
99. Kooij G, van Horssen J, Bandaru VV, The role of ATP-binding cassette transporters in neuro-inflammation: relevance for bioactive lipids: Front Pharmacol, 2012; 3; 74
100. Planas JM, Alfaras I, Colom H, Juan ME, The bioavailability and distribution of trans-resveratrol are constrained by ABC transporters: Arch Biochem Biophys, 2012; 527(2); 67-73
101. Murtaza G, Ullah N, Mukhtar F, Phytotherapeutics: The emerging role of intestinal and hepatocellular transporters in drug interactions with botanical supplements: Molecules, 2017; 22(10); 1699
102. Ferretta A, Gaballo A, Tanzarella P, Effect of resveratrol on mitochondrial function: Implications in parkin-associated familiar Parkinson’s disease: Biochim Biophys Acta, 2014; 1842(7); 902-15
103. Kulkarni SS, Cantó C, The molecular targets of resveratrol: Biochim Biophys Acta, 2015; 1852(6); 1114-23
104. Dias GP, Cocks G, do Nascimento Bevilaqua MC, Resveratrol: A potential hippocampal plasticity enhancer: Oxid Med Cell Longev, 2016; 2016; 9651236
105. Torres-Pérez M, Tellez-Ballesteros RI, Ortiz-López L, Resveratrol enhances neuroplastic changes, including hippocampal neurogenesis, and memory in Balb/C mice at six months of age: PLoS One, 2015; 10(12); e0145687
106. Wang D, Li SP, Fu JS, Resveratrol defends blood–brain barrier integrity in experimental autoimmune encephalomyelitis mice: J Neurophysiol, 2016; 116(5); 2173-79
107. Wei H, Wang S, Zhen L, Resveratrol attenuates the blood–brain barrier dysfunction by regulation of the MMP-9/TIMP-1 balance after cerebral ischemia reperfusion in rats: J Mol Neurosci, 2015; 55(4); 872-79
108. Torregrosa-Muñumer R, Vara E, Fernández-Tresguerres JÁ, Gredilla R, Resveratrol supplementation at old age reverts changes associated with aging in inflammatory, oxidative and apoptotic markers in rat heart: Eur J Nutr, 2021; 60(5); 2683-93
109. Song K, Li Y, Zhang H, Oxidative stress-mediated blood–brain barrier (BBB) disruption in neurological diseases: Oxid Med Cell Longev, 2020; 2020; 4356386
Figures
Figure 1. Effects of hyperglycemia within central nervous system. Created using Microsoft® PowerPoint® 2013 (154.0.5363.1000) MSO, Microsoft Corporation.Figure 2. The cross-section scheme of in vitro model of blood–brain barrier containing co-culture of endothelial cells and astrocytes. The basement membrane with pore diameter 0.4 μm. Created using Microsoft® PowerPoint® 2013 (154.0.5363.1000) MSO, Microsoft Corporation.Figure 3. The diagram illustrating the process of establishing an in vitro blood–brain model and the stages of the study. EC – endothelial cells; AC – astrocytes; MC – microvascular compartment of BBB; BC – brain compartment of BBB; LPS – lipopolysaccharide’ RSV – resveratrol. Created using Microsoft® PowerPoint® 2013 (154.0.5363.1000) MSO, Microsoft Corporation.Figure 4. Mean values of cytokine concentrations (pg/ml) in brain compartment 24 h after different glucose concentrations applied in microvascular compartment. SEM – standard error of measurement (±10%). Created using Microsoft® PowerPoint® 2013 (154.0.5363.1000) MSO, Microsoft Corporation.Figure 5. Mean values of cytokine concentrations (pg/ml) in brain compartment 12 h after LPS was been added to brain compartment in the 3 studied groups. In comparison, concentrations of the same cytokines in LPS-free conditions. SEM – standard error of measurement (±10%). Created using Microsoft® PowerPoint® 2013 (154.0.5363.1000) MSO, Microsoft Corporation.Figure 6. Mean values of cytokine concentrations (pg/ml) in brain compartment 36 h after administration of LPS compared to 12 h after LPS administration in the 3 studied groups. SEM – standard error of measurement (±10%). Created using Microsoft® PowerPoint® 2013 (154.0.5363.1000) MSO, Microsoft Corporation.Figure 7. Astrocytes from brain compartment after glucose administration. (A) Staining with hematoxylin and eosin. (B) Astrocytes from brain compartment after glucose and LPS administration. Staining with hematoxylin and eosin. No visible changes in the morphology of the astrocytes were observed. Magnification 100×. The picture was captured using LAS-X, the standard microscope imaging software from Leica Microsystems, Wetzlar, Germany.Figure 8. Mean values of cytokine concentrations in brain compartment (pg/ml) 36 h after administration of LPS and 24 h after addition of RSV to the microvascular compartment. For comparison, concentrations of the same cytokines in the samples to which LPS was added and RSV was not added (control samples are marked with the letter C). SEM – standard error of measurement (±10%). Created using Microsoft® PowerPoint® 2013 (154.0.5363.1000) MSO, Microsoft Corporation.Figure 9. Mean RSV concentrations (ng/ml) in the brain compartment 12 and 24 h after RSV addition to the microvascular compartment of hypo-, normo-, and hyperglycemia-simulating samples. SEM – standard error of measurement (±10%). Created using Microsoft® PowerPoint® 2013 (154.0.5363.1000) MSO, Microsoft Corporation.Figure 10. Resveratrol delivery systems. Created using Microsoft® PowerPoint® 2013 (154.0.5363.1000) MSO, Microsoft Corporation. Tables
Table 1. The 3 glucose concentrations used within microvascular compartment corresponding to decreased, normal, or increased blood glucose levels in vivo (hypo-, normo-, and hyperglycemia, respectively).Table 2. The set of controls established for experiments using the blood–brain barrier in vitro model.Table 3. The changes in cytokine concentrations for different glucose concentrations.Table 1. The 3 glucose concentrations used within microvascular compartment corresponding to decreased, normal, or increased blood glucose levels in vivo (hypo-, normo-, and hyperglycemia, respectively).Table 2. The set of controls established for experiments using the blood–brain barrier in vitro model.Table 3. The changes in cytokine concentrations for different glucose concentrations. In Press
Clinical Research
Effects of Single-Bout Endurance Exercise Intensity on Peripheral Neurotrophic Factors in Patients With Isc...Med Sci Monit In Press; DOI: 10.12659/MSM.952089
Review article
Anisodus tanguticus in Cancer Research: A Review of Traditional Use, Phytochemistry, Extraction Methods, an...Med Sci Monit In Press; DOI: 10.12659/MSM.952999
Clinical Research
Nasal Mucociliary Clearance and Its Relationship With Disease Severity in Patients With Multiple SclerosisMed Sci Monit In Press; DOI: 10.12659/MSM.952850
Clinical Research
Modified Thoracoabdominal Nerves Block Through the Perichondrial Approach vs Subcostal Transversus Abdomini...Med Sci Monit In Press; DOI: 10.12659/MSM.953976
Most Viewed Current Articles
17 Jan 2024 : Review article 14,176,570
Vaccination Guidelines for Pregnant Women: Addressing COVID-19 and the Omicron VariantDOI :10.12659/MSM.942799
Med Sci Monit 2024; 30:e942799
13 Nov 2021 : Clinical Research 3,762,188
Acceptance of COVID-19 Vaccination and Its Associated Factors Among Cancer Patients Attending the Oncology ...DOI :10.12659/MSM.932788
Med Sci Monit 2021; 27:e932788
14 Dec 2022 : Clinical Research 2,466,310
Prevalence and Variability of Allergen-Specific Immunoglobulin E in Patients with Elevated Tryptase LevelsDOI :10.12659/MSM.937990
Med Sci Monit 2022; 28:e937990
16 May 2023 : Clinical Research 708,927
Electrophysiological Testing for an Auditory Processing Disorder and Reading Performance in 54 School Stude...DOI :10.12659/MSM.940387
Med Sci Monit 2023; 29:e940387