31 August 2023: Clinical Research
Associations Between Mean Platelet Volume and Various Factors in Type 2 Diabetes Patients: A Single-Center Study from Poland
Karolina Marta Gacuta1ABCDEFG*, Olga Martyna Koper-LenkiewiczDOI: 10.12659/MSM.941109
Med Sci Monit 2023; 29:e941109


Abstract
BACKGROUND: Thromboembolic episodes, which are largely mediated by blood platelets, are prevalent chronic complications of diabetes. The mean platelet volume (MPV) serves as a marker for in vivo platelet activation. This study aimed to assess the factors influencing MPV in 106 patients with type 2 diabetes, compared with 59 non-diabetic individuals at a single center in Poland.
MATERIAL AND METHODS: We performed linear regression analysis, with MPV as the dependent variable and factors such as age, sex, thrombopoiesis-influencing cytokines, blood pressure, body mass index, glycosylated hemoglobin percentage, platelet count, large platelet count, lipid profile parameters, creatinine concentration, estimated glomerular filtration rate, treatment modalities, and comorbidities as independent variables. MPV was measured using the ADVIA 2120 hematology analyzer, with a reference range of 7-12 fL.
RESULTS: The analysis revealed that in patients with type 2 diabetes, an increase in platelet count by 10×10³/μL resulted in a decrease in MPV by 0.05 (P<0.001), while an increase in large platelet count by 1×10³/μL led to an increase in MPV by 0.18 (P<0.001). Additionally, patients taking β-blockers or insulin had lower MPVs by 0.77 (P=0.008) and 5.63 (P<0.001), respectively, compared with those not on these medications.
CONCLUSIONS: This study delineates the relationship between MPV, platelet parameters, and treatment modalities in type 2 diabetes, paving the way for further research to elucidate underlying mechanisms and potential clinical applications.
Keywords: Diabetes Mellitus, Type 2, mean platelet volume, Platelet Activation, Platelet Count, Humans, Poland, Blood Platelets, Insulin
Background
Type 2 diabetes is one of the major health problems of the 21st century [1]. Patients with diabetes face a considerably higher risk of developing coronary heart disease, chronic kidney disease, vision loss, peripheral arterial disease, and cerebrovascular accident. This is primarily due to the significant complications that affect both small and large blood vessels, commonly observed in individuals with diabetes [2]. The most common chronic complication of diabetes is thromboembolic episodes [3]. Platelets play a significant role in the development of thrombosis [4–6]. During platelet activation, active substances are released from alpha-granules, which additionally intensify their activation [4]. The mean platelet volume (MPV) is a well-established marker of platelet activation [5,7]. Research has revealed elevated MPV values among individuals with type 2 diabetes [8–11]. According to Lippi et al [2], MPV could serve as a valuable prognostic indicator for cardiovascular complications in patients with type 2 diabetes. Additionally, a higher MPV value was found to be independently linked to an increased risk of type 2 diabetes [12].
The initial stages of the formation and maturation of blood platelets in the bone marrow can affect their morphological parameters [13]. The hormone that stimulates the process of thrombopoiesis is a thrombopoietin (TPO) [14,15]. Bosco et al [16] and Larsen et al [17] revealed significantly increased TPO levels in patients with type 2 diabetes than in individuals with normal glucose tolerance. In patients with type 2 diabetes, the secretion of TPO is increased, probably due to elevated concentration of interleukin 6 (IL-6), which affects the synthesis of this hormone by hepatocytes [16,18]. Measurement of plasma IL-6 levels showed an increased concentration in diabetic patients compared with that of healthy control participants [19]. TPO exerts a stronger effect on megakaryocytes in the presence of IL-6. Additionally, IL-6 stimulates the growth of megakaryocytes via the IL-6 receptors present on their surface, which increases nuclear ploidy and contributes to an increase in the size of megakaryocytes and the shedding of larger cytoplasmic fragments [15,20]. The increase in the MPV value in a blood morphology test reflects this process [20].
Activation of blood platelets leads to the translocation of P-selectin from alpha granules of blood platelets to their surface, which enables them to roll along the surface of the endothelium [5]. Then, P-selectin presented on the surface of the blood platelets is released into the bloodstream, forming its soluble form (sP-selectin) [5]. An additional source of sP-selectin is Weibel-Palade bodies in endothelial cells [5]. sP-selectin has a long half-life and additionally enhances the procoagulant properties of blood platelets [5]. Studies showed that in patients with type 2 diabetes, both the expression of sP-selectin on the surface of platelets [16] and the concentration of sP-selectin [21,22] were significantly higher than that in individuals with normal glucose metabolism. Studies revealed that patients with type 2 diabetes have a significantly higher concentration of sCD40L than healthy individuals [23–25]. Receptor membrane ligand CD40L (CD154) is found on various cell surfaces, including B and T lymphocytes, natural killer cells, basophils, monocytes/macrophages, mastocytes, endothelial cells, dendritic cells, and platelets [26–28]. The interaction of its soluble form (sCD40L) with its receptor CD40 significantly increases the inflammation of the endothelium via the enhancement of IL-6 production, which also affects thrombocytopoiesis [4,26]. Additionally, sCD40L increases the expression of P-selectin [28].
Literature data indicate that besides TPO, IL-6, sCD40L, and sP-selectin [4,13,15,20,26,28], other factors can influence blood platelet activation and the MPV value [20]. Various factors have been identified, such as the percentage of glycated hemoglobin (HbA1c), fasting and postprandial blood glucose concentration, diabetes duration, platelet morphological parameters (platelet distribution width and large platelet ratio), retinopathy, and microalbuminuria, which have been indicated as factors influencing the MPV value in patients with type 2 diabetes [2,8,29,30]. Moreover, patients with type 2 diabetes have a significantly higher concentrations of lipid profile parameters, creatinine, and body mass index (BMI) than do healthy controls [23,31]. Other reported factors influencing the MPV value include age, sex, platelet count, inflammatory conditions, applied treatment, hormone profile, race, and lifestyle [20]. Therefore, it is suspected that all the above-mentioned parameters may have an influence on the MPV value also in patients with diabetes.
The analysis of factors influencing platelet activation in patients with type 2 diabetes can have significant importance because this knowledge may contribute to reducing the occurrence of thromboembolic episodes in these patients [8,29]. Therefore, in this study, we aimed to compare the factors associated with MPV in 106 patients with type 2 diabetes mellitus with that of healthy control participants at a single center in Poland.
Material and Methods
ETHICS STATEMENT:
The study was approved by the Bioethics Committee of the Medical University in Białystok (approval number APK.002.207.2022). All participants gave their written informed consent for inclusion before they participated in the study. The study participants were provided with the document to read and given an opportunity to ask questions about the study. Consents were recorded by a physician from the Department of Diabetology, Endocrinology, and Internal Diseases at the Provincial Integrated Hospital named after J. Śniadecki in Białystok.
TYPE 2 DIABETES PATIENTS:
The study group consisted of 106 patients diagnosed with type 2 diabetes (50 men and 56 women, median age 70 years, ranging from 40 to 91 years) who were hospitalized in the Department of Diabetology, Endocrinology, and Internal Diseases at the Provincial Integrated Hospital named after J. Śniadecki in Białystok. The exclusion criteria for the type 2 diabetes group included malignancy in medical history, blood transfusion, pregnancy or delivery in the last 6 months, hormone replacement therapy, autoimmune diseases, and acute inflammation. Table 1 presents the clinical and demographical characteristics of the study group.
CONTROL GROUP:
The control group consisted of 59 volunteers with normal glucose metabolism (24 men and 35 women, median age 57 years, ranging from 34 to 87 years). The exclusion criteria for the control group included family health history of diabetes (parent, brother, or sister with type 2 diabetes), impaired glucose tolerance, BMI >25 kg/m2, gestational diabetes, polycystic ovary syndrome, treatment with oral antidiabetic drugs, insulin, antithrombotic drugs, antihypertensive drugs, lipid-lowering agents, diuretics, and proton pump inhibitors.
PLATELETS MORPHOLOGICAL PARAMETERS EVALUATION:
Morphological parameters of blood platelets – platelet count (PLT), mean platelet volume (MPV), platelet distribution width (PDW), plateletcrit (PCT), and large platelet count (LPLT) – were determined in venous blood collected on K3-ethylenediaminetetraacetic acid (EDTA-K3) tubes (S-Monovette, SARSTEDT, 2.7 mL) using the ADVIA 2120 hematology analyzer (Siemens Healthcare Diagnostics, Germany). The analyzer uses a 2-dimensional optical method in which erythrocytes and blood platelets are subjected to measurement. In this method, during the initial stage of analysis, whole blood is diluted using a red blood cell (RBC)/PLT diluent solution, consisting of a weak detergent and glutaraldehyde. This leads to a process called isovolumetric ferroation, in which the shape of the cells changes to spherical without affecting their volume. This process depends on the detergent present in the reagent used. In the next stage of analysis, the blood is passed through a measurement chamber, where laser light is scattered on the surface of the examined cells. The analysis of the intensity of scattered laser light is performed at low angles (2–3°) and high angles (5–15°). The obtained results are processed into appropriate values according to the theory of Mie light scattering. Data obtained at low-angle detection indicate cell volume, while measurements provided during high-angle detection are associated with the refractive index, which depends on the presence of particles in the blood platelets. The laboratory’s normal reference range for MPV is 7–12 fL, PLT is 130–350×103/μL, PCT is 0.12–0.36%, and PDW is 40–60%.
TPO, IL-6, SP-SELECTIN, AND SCD40L EVALUATION:
TPO, IL-6, sP-selectin, and sCD40L concentrations were evaluated in blood collected into tubes without anticoagulant (S-Monovette, SARSTEDT, 2.7 mL) using kits based on the sandwich enzyme-linked immunosorbent assay technology (ELISA). TPO concentration was measured using an ELISA Quantikine Human TPO kit (Cat#: DTP00B; R&D Systems Europe Ltd., Abingdon, England). IL-6 concentration was measured using ELISA Quantikine Human IL-6 Immunoassay kit (Cat#: D6050; R&D Systems Europe Ltd.). sP-selectin concentration was measured using ELISA Quantikine Human P-Selectin Immunoassay kit (Cat#: DPSE00; R&D Systems Europe Ltd.). sCD40L concentration was measured using a human sCD40L ELISA kit (Cat#: 650 120 096; Diaclone SAS, Besançon, France). Experiments were conducted following the manufacturers’ instructions. According to the manufacturers’ specifications, samples were not diluted before analysis.
PERCENTAGE OF HBA1C EVALUATION:
The percentage of HbA1c was evaluated in whole blood collected into tubes with EDTA-K3 (S-Monovette, SARSTEDT, 2.7 mL) on the biochemical analyzer Architect ci8200 (Abbott Diagnostic, Germany). The determination of HbA1c percentage was performed using the ARCHITECT ci 8200 biochemical analyzer, using the MULTIGENT test. Blood underwent preliminary processing with a denaturing reagent, leading to erythrocyte lysis. The hemoglobin released from within the RBCs underwent degradation by a proteolytic enzyme, pepsin. The resulting hemolysate underwent further processing to determine the concentrations of total hemoglobin and glycosylated hemoglobin. A colorimetric method was utilized to determine the concentration of total hemoglobin. For this purpose, the hemolysate was subjected to the action of an alkaline solution of nonionic substances, causing a reduction in surface tension. This led to the conversion of hemoglobin to hematin, giving the solution a green color. Subsequently, the absorbance of the sample was measured, and the concentration of total hemoglobin was read from the calibration curve of this parameter. The concentration of glycosylated hemoglobin was determined using an immunoturbidimetric method, employing the inhibition of micro-particle agglutination. Initially, an alkaline solution of a nonionic detergent was added to the hemolysate, causing the conversion of hemoglobin to alkaline hematin. This resulted in a change in the color of the solution, which became more intense with higher concentrations of hemoglobin in the tested sample. In the next step, a polymer consisting of multiple copies of HbA1c immunoreactive sites was added. This caused latex particles to aggregate due to the presence of monoclonal anti-HbA1c antibodies. The binding sites on the latex particles competed with HbA1c molecules, leading to the inhibition of the agglutination process and a decrease in absorbance due to reduced light scattering. The final step in the determination of the HbA1c percentage involved calculating the ratio of HbA1c concentration to the concentration of total hemoglobin after applying a conversion factor. This result correlates with the National Glycohemoglobin Standardization Program-certified high-performance liquid chromatography method.
LIPID PROFILE PARAMETERS AND CREATININE EVALUATION:
Lipid profile parameters and creatinine concentrations were evaluated in blood collected into tubes without anticoagulant (S-Monovette, SARSTEDT, 2.7 mL) on the biochemical analyzer Architect ci8200. The concentrations of total cholesterol were determined using an enzymatic method. Cholesterol esters are enzymatically hydrolyzed by cholesterol esterase to cholesterol and free fatty acids. Free cholesterol, including that already present in the sample, is then oxidized by cholesterol oxidase to cholesterol-4-ene-3-one and hydrogen peroxide. Hydrogen peroxide combines with hydroxybenzoic acid and 4-aminoantipyrin to form a chromophore (quinoneimine dye) that is measured at a wavelength of 500 nm. The concentration of triglycerides was determined using an enzymatic method with glycerolphosphate oxidase. Triglycerides are enzymatically hydrolyzed by lipase to free fatty acids and glycerol. Glycerol is phosphorylated by adenosine triphosphate and glycerol kinase to form glycerol-3-phosphate and adenosine diphosphate. Glycerol-3-phosphate is oxidized to dihydroxyacetone phosphate by glycerol phosphate oxidase to form hydrogen peroxide. In the color reaction catalyzed by peroxidase, hydrogen peroxide reacts with 4-amino antipyrine and 4-chlorophenol to produce a red dye. The absorbance value of this dye is directly proportional to the concentration of triglycerides in the tested sample. The concentration of high-density lipoprotein cholesterol (HDL-C) was determined using a direct method, without the need for off-analyzer pre-treatment or centrifugation. This method uses 2 reagents and relies on the properties of a unique detergent. It involves accelerating the reaction of cholesterol oxidase with non-HDL esterified cholesterol, and selectively dissolving HDL cholesterol using an appropriate detergent. In the case of the first reagent, the non-HDL esterified cholesterol undergoes an enzymatic reaction, and the resulting hydrogen peroxide is consumed in a peroxidase-DSBmT (N,N-bis (4-sulphobutyl)-m-toluidine-disodium) reaction, leading to the formation of a colorless product. The second reagent consists of a detergent (capable of dissolving HDL cholesterol), cholesterol esterase, and a color-developing coupling agent, enabling the formation of color indicative of the quantitative content of HDL cholesterol. The concentration of low-density lipoprotein cholesterol (LDL-C) was calculated using the Friedewald formula. The concentration of creatinine was determined using the Jaffe creatinine method. In an alkaline pH environment, creatinine in the sample reacts with picrate to create a creatinine-picrate complex. The rate at which the absorbance at 500 nm increases, as a result of the formation of this complex, is directly proportional to the concentration of creatinine present in the sample.
STATISTICAL ANALYSIS:
The obtained results were analyzed with STATISTICA 13.3 PL software (StatSoft Inc., Tulsa, OK, USA), GraphPad Prism 8.0 (GraphPad Software, San Diego, CA, USA), and STATA 17 (StataCorp LLC, College Station, TX, USA). Since the data for platelets morphological parameters results and TPO, IL-6, sP-selectin, and sCD40L concentration results did not follow a normal distribution (Shapiro-Wilk test), to demonstrate the differences between 2 groups with quantitative variables having a non-normal distribution, the Mann-Whitney U test was utilized. This test serves as the counterpart to the t test, which is used for quantitative variables with a normal distribution [32]. Empirical research has shown that the Mann-Whitney U test generally exhibits greater statistical power than the t test. The t test demonstrates higher power only when the distribution is relatively symmetric [33]. Correlation coefficients were obtained by applying Pearson or Spearman rank correlations. Values for continuous variables are presented as median with interquartile range, if not otherwise stated. The association between variables was tested with Pearson or Spearman rank correlations and linear regression analysis, in which MPV was entered as the dependent variable and the following were the independent variables: IL-6, TPO, sP-selectin, and sCD40L, as well as age, sex, blood pressure, BMI, HbA1c percentage, PLT, LPLT, total cholesterol concentration, HDL-C and LDL-C cholesterol concentration, triglyceride concentration, creatinine concentration, estimated glomerular filtration rate (eGFR), treatment used, and coexisting diseases. Moreover, using logistic regression analysis, it was checked whether the values of platelet morphological parameters (PLT, MPV, PCT, PDW, LPLT) were associated with type 2 diabetes. Regression analysis models were created using backward stepwise regression. Differences were considered significant for 2-tailed P<0.05.
Results
PLATELETS MORPHOLOGICAL PARAMETERS RESULTS:
The median MPV in patients with type 2 diabetes was significantly higher (9.4 fL, interquartile range 8.3–10.9 fL) than that of the control group (8.5 fL, interquartile range 8.0–9.3 fL), P=0.0017 (Figure 1A). The median PLT in patients with type 2 diabetes was higher (238×103/μL, interquartile range 182–287×103/μL) than that of the control group (236×103/μL, interquartile range 204–272×103/μL); however, the difference was not significant, P=0.6833 (Figure 1B). The median LPLT in patients with type 2 diabetes was significantly higher (7.5×10³/μL, interquartile range 5.1–11.0×10³/μL) than that of the control group (6.0×10³/μL, interquartile range 4.1–7.1×10³/μL), P=0.0014 (Figure 1C). The median PCT in patients with type 2 diabetes was higher (0.22%, interquartile range 0.18–0.28%) than that of the control group (0.21%, interquartile range 0.18–0.23%); however, the difference was not significant, P=0.1081 (Figure 1D). The median PDW in patients with type 2 diabetes was significantly higher (54.4 fL, interquartile range 48.9–61.2 fL) than that of the control group (53.1 fL, interquartile range 47.2–56.5 fL), P=0.0349 (Figure 1E). The presence of increased platelet volume, as indicated by significantly higher MPV, LPLT, and PDW values, collectively, suggested elevated platelet activity among the patients with diabetes in the present study group.
TPO, IL-6, SP-SELECTIN, AND SCD40L CONCENTRATION RESULTS:
The median concentration of TPO in patients with type 2 diabetes was higher (76 pg/mL, interquartile range 51–104 pg/mL) than that of the control group (72 pg/mL, interquartile range 55–93 pg/mL); however, the difference was not significant (P=0.7210; Figure 2A). The median concentration of IL-6 in patients with type 2 diabetes was significantly higher (7.4 pg/mL, interquartile range 6.4–9.5 pg/mL) than that of the control group (5.8 pg/mL, interquartile range 5.5–6.1 pg/mL), P<0.0001 (Figure 2B). The median concentration of sP-selectin in patients with type 2 diabetes was significantly higher (128 ng/mL, interquartile range 87–161 ng/mL) than that of the control group (91 ng/mL, interquartile range 73–118 ng/mL), P=0.0008 (Figure 2C). The median concentration of sCD40L in patients with type 2 diabetes was significantly higher (96 ng/mL, interquartile range 73–121 ng/mL) than that of the control group (68 ng/mL, interquartile range 52–90 ng/mL), P=0.0010 (Figure 2D). The significant elevation in IL-6, sP-selectin, and sCD40L concentrations in patients with type 2 diabetes suggested that these molecules may contribute to the procoagulant properties of blood platelets. Notably, IL-6 is currently included in routine laboratory testing, making it a readily accessible parameter.
CONFOUNDING FACTORS RESULTS:
Potential confounding variables in our models included the age and sex of the patients. The analysis revealed a significant difference in age between the study and control groups (
CORRELATION COEFFICIENT RESULTS:
In the whole group of type 2 diabetes patients, we correlated MPV with platelets morphological parameters, TPO, IL-6, sP-selectin, and sCD40L concentrations, results of routine laboratory tests, and demographic and clinical data of patients. In type 2 diabetes patients, a negative correlation between MPV and PLT was found (r=−0.3701; P=0.0003; Figure 3A), which indicated that also in diabetes patients, a relatively stable platelet mass (platelet count × MPV) was established. Moreover, MPV positively correlated with LPLT (r=0.4212; P=0.0001; Figure 3B), which indicated LPLT as another parameter useful for evaluating platelet activity in type 2 diabetes patients. MPV did not correlate with patient sex, age, PCT, PDW, TPO, IL-6, sP-selectin, and sCD40L levels, BMI, HbA1c percentage, white blood cell count, total cholesterol, HDL-C, LDL-C, triglyceride concentration, creatinine concentration, eGFR, international normalized ratio, prothrombin time, fibrinogen, D-dimers, or systolic and diastolic blood pressure values.
LINEAR REGRESSION ANALYSIS RESULTS FOR MPV:
Univariate linear regression analysis showed that MPV in patients with type 2 diabetes was affected by PLT, LPLT, and D-dimer concentrations. The following was shown in patients with type 2 diabetes: (1) With an increase in PLT by 10×103/μL, the MPV increased by 10×β=−0.04 (decreased by 0.04). (2) With an increase in LPLT by 1×10³/μL, the MPV increased by β=0.15. (3) With an increase in D-dimer concentration by 100 μg/mL, the MPV increased by 100×β=0.02 (Table 2, Figure 4A–4C).
Multivariate linear regression analysis showed that the MPV in type 2 diabetes patients was affected by PLT, LPLT, β-blockers, and insulin. The following was found in patients with type 2 diabetes (with other parameters fixed): (1) With an increase in PLT by 10×103/μL, MPV increased by 10×β=−0.05 (decreased by 0.05). (2) With an increase in LPLT by 1×10³/μL, the MPV increased by β=0.18. (3) In patients taking β-blockers, MPV is higher by β=−0.77 (lower by 0.77 in relation to those not taking these drugs). (4) In patients taking insulin, the MPV was higher by β=−5.63 (lower by 5.63 compared to those not taking these drugs) (Table 2). The coefficient of determination R2 was 0.46, which means that the created multivariate linear regression model explains 46% of the variability of the dependent variable. The association of MPV with β-blockers and insulin intake provide information on the potential benefits of diabetes therapy regarding cardiovascular diseases.
LINEAR REGRESSION ANALYSIS RESULTS FOR PLT:
Analysis of PLT residual values did not show a normal distribution. Therefore, PLT values had to be log-transformed to obtain a normal distribution. The univariate linear regression analysis showed that PLT in patients with type 2 diabetes was influenced by white blood cell count (WBC), concentration of TPO, sP-selectin, sCD40L, and systolic blood pressure. In the whole group of patients with type 2 diabetes, the following was found: (1) With an increase in WBC by 1×10³/μL, PLT increased eβ=1.034 times (increase by 3.4%). (2) With an increase in TPO concentration by 10 pg/mL, PLT increased e10*β=0.972 times (decrease by 2.8%); ie, it will decrease 1/e10*β=1.029 times. (3) With an increase in the concentration of sP-selectin by 10 ng/mL, PLT increased e10*β=1.02 times (increase by 2%). (4) With an increase in sCD40L concentration by 10 ng/mL, PLT increased e10×β=0.971 times (decrease by 2.9%); ie, it will decrease 1/e10*β=1.030 times. (5) With an increase in systolic blood pressure by 10 mm Hg, PLT increased eβ=1.055 times (increase by 5.5%). (6) In patients taking insulin, PLT was higher eβ=0.539 times; ie, 1/eβ=1.854 times lower than in those not taking these drugs (Table 3).
Multivariate linear regression analysis showed that PLT in type 2 diabetes patients was affected by WBC, sP-selectin concentration, and intake of aspirin, insulin, and oral antidiabetic drugs. The following was found in patients with type 2 diabetes (with other parameters fixed): (1) With an increase in WBC by 1×10³/μL, PLT increased eβ=1.041 times (increased by 4.1%). (2) With an increase of sP-selectin by 10 ng/mL, PLT increased e10*β=1.02 times (increased by 2%). (3) In patients taking aspirin, PLT was eβ=1.293 times higher than in those not taking these drugs (29% higher). (4) In patients taking insulin, PLT was higher eβ=0.255 times; ie, 1/eβ=3.92 times lower than in those not taking these drugs. (5) In patients taking oral antidiabetic drugs, PLT was eβ=1.238 times higher than in those not taking these drugs (24% higher) (Table 3). The coefficient of determination R2 was 0.32, which means that the created multivariate linear regression model explains 32% of the variability of the dependent variable. The association between PLT and aspirin, insulin, and oral antidiabetic drug intake offers insights into the advantages of diabetes treatment in relation to platelet function, taking into account the well-known phenomenon of negative correlation between platelet count and MPV.
LOGISTIC REGRESSION ANALYSIS RESULTS:
Univariate logistic regression analysis showed that MPV, LPLT, and age increased the likelihood of type 2 diabetes. The analysis showed the following: (1) With an increase in MPV by 1 fL, the chance of diabetes increased OR=1.621 times (increased by 62%). (2) With an increase in PLT by 1×10³/μL, the chance of developing diabetes increased OR= 1.225 times (increased by 23%). (3) With an increase in age of 1 year, the chance of developing diabetes increased OR=1.070 times (increased by 7%) (Table 4).
Multivariate logistic regression analysis showed that MPV, LPLT, PDW, and age increased the likelihood of type 2 diabetes. The analysis showed the following (with other parameters fixed): (1) With an increase in PLT by 10×103/μL, the chance of diabetes increased e10*β=1.071 times (increased by 7%). (2) With an increase in MPV by 1 fL, the chance of developing diabetes increased OR=2.7293 times (increased by 273%). (3) With an increase in PDW by 1 fL, the chance of developing diabetes increased OR=1.051 times (increased by 5%). (4) With an increase in age of 1 year, the chance of developing diabetes increased OR=1.083 times (increased by 8%) (Table 4). These results indicate that increased MPV, PLT, PDW, and age are likewise associated with type 2 diabetes.
Discussion
The present study revealed that MPV and PLT are associated with type 2 diabetes diagnosis. We also found that MPV in patients with type 2 diabetes was affected by PLT, LPLT, β-blockers, and insulin treatment. The coefficient of determination R2 was 0.46, which means that the created multivariate linear regression model explains 46% of the variability of the dependent variable. Factors such as patient’s age, sex, cytokines influencing MPV value at the stage of thrombocytopoiesis, blood pressure, BMI, degree of lipid and carbohydrate metabolism compensation, kidney function, and coexisting diseases did not have any influence on MPV value in the present cohort of type 2 diabetes patients.
Type 2 diabetes is a known risk factor for micro- and macrovascular complications, such as stroke, cardiovascular diseases, and thromboembolism [34]. Thrombotic events are a major cause of mortality in these patients. It is reported that patients with type 2 diabetes have a 2- to 4-fold higher risk of recurrent atherothrombotic events and vascular complications, such as heart attack, stroke, and peripheral artery disease, than do patients without diabetes [35,36]. Platelet hyperactivity and endothelial dysfunction are the main factors responsible for the development of prothrombotic and inflammatory states in diabetes patients [36]. Other factors increasing the risk of thrombosis include a high BMI, hypertension, dyslipidemia, smoking, or chronic kidney disease [36–38]. Thus, exploring the factors that can influence platelet activation in patients with type 2 diabetes is important because it may lead to a reduction in the incidence of thromboembolic events in these individuals. In this context, our study, which analyses various factors that could influence MPV, a widely accepted laboratory indicator of platelet activation, holds significant value.
The literature emphasizes that MPV and PLT should be assessed together because there is a negative correlation between these 2 parameters, which means that as one of these values increases, the other decreases. This link has been well-documented in the literature and is present in various populations [20,39]. The relationship mentioned above was also confirmed in the present cohort of type 2 diabetes patients.
In the present study, univariate linear regression analysis demonstrated that, in patients with type 2 diabetes, MPV was influenced by PLT, LPLT, and D-dimer concentrations. Hwang et al suggest that the reason behind the inverse correlation between MPV and PLT is linked to the ability to maintain hemostasis by keeping a consistent platelet mass [40]. The positive association of MPV with LPLT, namely platelets larger than 20 fL, is in line with the results of Grove et al [30]. Research has suggested that the presence of LPLT in the blood can be associated with an increased risk of thrombotic and vascular complications. Platelets of larger size possess denser granules, exhibit increased secretion of serotonin and β-thromboglobulin, and produce higher levels of thromboxane A2 than do smaller platelets [22]. Studies have found that LPLT are more pro-thrombotic, meaning that they have a greater tendency to form clots than do normal-sized platelets [10]. Multivariate logistic regression analysis showed that both MPV and PLT are associated with type 2 diabetes. Thus, it could be concluded that analysis of MPV and LPLT together can provide additional information about platelet function and the risk of thrombotic events in patients with type 2 diabetes.
Recent studies show there is a relationship between D-dimer levels and MPV, indicating that in type 2 diabetes patients, increased platelet activation can reflect increased fibrinolytic activity [41,42]. D-dimers are small protein fragments produced during fibrinolysis and are well-established markers of venous thrombosis formation in the general population [42]. Previous studies indicated that increased D-dimer concentration was found in individuals with prediabetes [43], type 2 diabetes patients [42], or even first-degree relatives of type 2 diabetes patients [44]. Cheng et al [45] showed that patients with type 2 diabetes who have high plasma concentrations of D-dimer are at an increased risk of cardiovascular disease events, even after adjusting for cardiovascular risk factors and treatments. The authors concluded that by measuring D-dimer concentrations, it may be possible to improve the current risk stratification criteria for these patients [45]. Nevertheless, it is important to note that measuring D-dimer concentration exhibits limited specificity, as increases can be detected in patients with conditions such as disseminated intravascular coagulation syndrome, malignancies, pregnancy, liver diseases, inflammatory processes, and heart diseases, as well as in patients who have undergone surgery or experienced trauma [46,47]. Additionally, elevated D-dimer concentration can be falsely elevated in patients with higher triglyceride concentrations [47].
Multivariate linear regression analysis showed that MPV was affected by PLT and LPLT as well as β-blockers and insulin intake. A study conducted by Tsujimoto et al [48] revealed that patients with diabetes mellitus taking β-blockers had a significantly lower cardiovascular disease rate than did individuals not taking β-blockers. In addition, the treatment with β-blockers was found to have a preventative effect on deaths related to cardiovascular disease in patients with type 2 diabetes [48]. To the best of our knowledge, there is currently no available data in the literature regarding the correlation between platelet function and the use of β-blockers in individuals with type 2 diabetes. Multiple mechanisms can account for the suppression of platelet activation caused by β-blockers. One potential explanation is that β-blockers can exhibit their antiplatelet effect by chemically interacting with the cell membrane of platelets, which results in membrane stabilization and reduced sensitivity to agonists. An additional mechanism involves the inhibition of β2-receptors on platelets by nonselective β-blockers. This inhibition has the potential to influence the levels of adenosine 3′,5′-cyclic monophosphate (cAMP) within platelets, resulting in decreased calcium availability and consequently reducing platelet activation. In addition, platelet activation is triggered through multiple pathways in the presence of hypertension, and a decrease in blood pressure by β-blockers can subsequently lead to a reduction in platelet aggregation [49].
The available literature provides very limited and conflicting information on the correlation between platelet morphological parameters and insulin therapy in patients with type 2 diabetes [39,50–53]. Administering insulin therapy to individuals with type 2 diabetes mellitus can cause unexpected increases in platelet reactivity in vivo [50]. On the contrary, Alay et al [51] observed that an increase in MPV was seen only in the oral antidiabetic drugs group, but not in the insulin therapy group [51]. Their results are in line with those obtained by Vernekar et al and Sahpaz et al [52,53]. On the other hand, Serbas et al [39] did not find a significant difference in MPV values between patients taking oral antidiabetic drugs and those taking insulin. Nevertheless, in healthy humans, platelet function can be directly regulated by insulin through the functional insulin receptor present on platelets [54]. Insulin acts in opposition to platelet agonists such as collagen, adenosine diphosphate, adrenaline, and platelet-activating factor. This occurs as a result of insulin’s activation of inhibitory G protein via insulin receptor substrate-1 [55]. In the present study, we showed that type 2 diabetes patients taking β-blockers with insulin had lower MPV values than did those not taking these drugs. Thus, it could be hypothesized that taking β-blockers together with insulin by patients with type 2 diabetes could reduce the risk of thromboembolism complication in these patients. Undoubtedly, our findings may provide new insights into the relationship between MPV and the treatment of patients with type 2 diabetes. However, further studies are needed to elucidate the mechanisms by which β-blockers and insulin taking together influence MPV.
Some researchers propose that the reason for the enlarged size of platelets in diabetes is due to osmotic swelling caused by elevated blood glucose levels or elevated levels of certain glucose metabolites [22]. It is noteworthy in our study that there was no correlation observed between MPV and HbA1c percentage, which is in line with the results of Hekimsoy et al [9] and Wojszel et al [56]. Contrary results were obtained by Demirtunc et al [57], Kodiatte et al [29], Lippi et al [2], and Ulutus et al [8]. The reasons why the present study did not identify HbA1c percentage levels directly associated with MPV could have been due to the other studies’ inclusion of a younger population of diabetic individuals [2,8,29,57], the dominance of male [2,29] or female [57] individuals, or exclusion of individuals with hemoglobin concentration below the laboratory reference values and receiving aspirin treatment, compared with in our study group [29]. The lack of association between MPV and HbA1c is in accordance with evidence that platelet activation in patients with diabetes does not depend on glycemic control [9]. Another explanation of the absence of a correlation between MPV and HbA1c could be due to some evidences suggesting that platelet activation in individuals with diabetes is not influenced by glycemic control [58]. Therefore, further research is required to gain insight in the complex interactions between glycemic control, platelet function, and other contributing factors in order to understand the connection between MPV and the percentage of HbA1c in individuals with type 2 diabetes.
This study had limitations. One limitation was the small number of type 2 diabetes patients included. As a result, we did not conduct a prospective power analysis, which is commonly carried out in large cooperative studies involving hundreds of participants, especially when proposing a new diagnostic or therapeutic method in the study’s conclusion. Our objective was more modest, and we focused on investigating the factors that are associated with MPV in patients with type 2 diabetes. Another limitation of the study was that patients with hemoglobin concentrations below the laboratory’s reference values were included in the analysis, which could be a reason for increased MPV values, due to reactive thrombocytosis [8]. Also, the use of EDTA as an anticoagulant can influence MPV values because of platelet swelling in a time-dependent manner [59]. Additionally, we did not gather data on atrial fibrillation, obstructive sleep apnea, and seasonal variations, all of which have been reported to have associations with MPV [12]. Finally, there is also still uncertainty regarding the most precise methodology for measuring MPV, which poses a limitation to its use as a marker [59]. Therefore, to validate our study results, it is important to address all the aforementioned limitations by including a larger cohort of patients and establishing a control group.
Conclusions
The first main finding of our study is the presence of a well-documented negative correlation between MPV and PLT, as reported in the literature in various populations, also in type 2 diabetes patients. The second finding provided by our study is the association of both MPV and PLT with type 2 diabetes diagnosis. The third and probably the most interesting finding is the association of MPV with PLT, LPLT, β-blockers, and insulin treatment. Exploring factors that influence platelet activation, measured by MPV evaluated within routine cell blood count, could be important in reducing the incidence of thromboembolic events in patients with type 2 diabetes. In this context, the present study adds a piece of knowledge potentially useful for the improved treatment of patients with type 2 diabetes. However, further research is needed to better understand the underlying mechanisms and clinical implications of these observations.
Figures
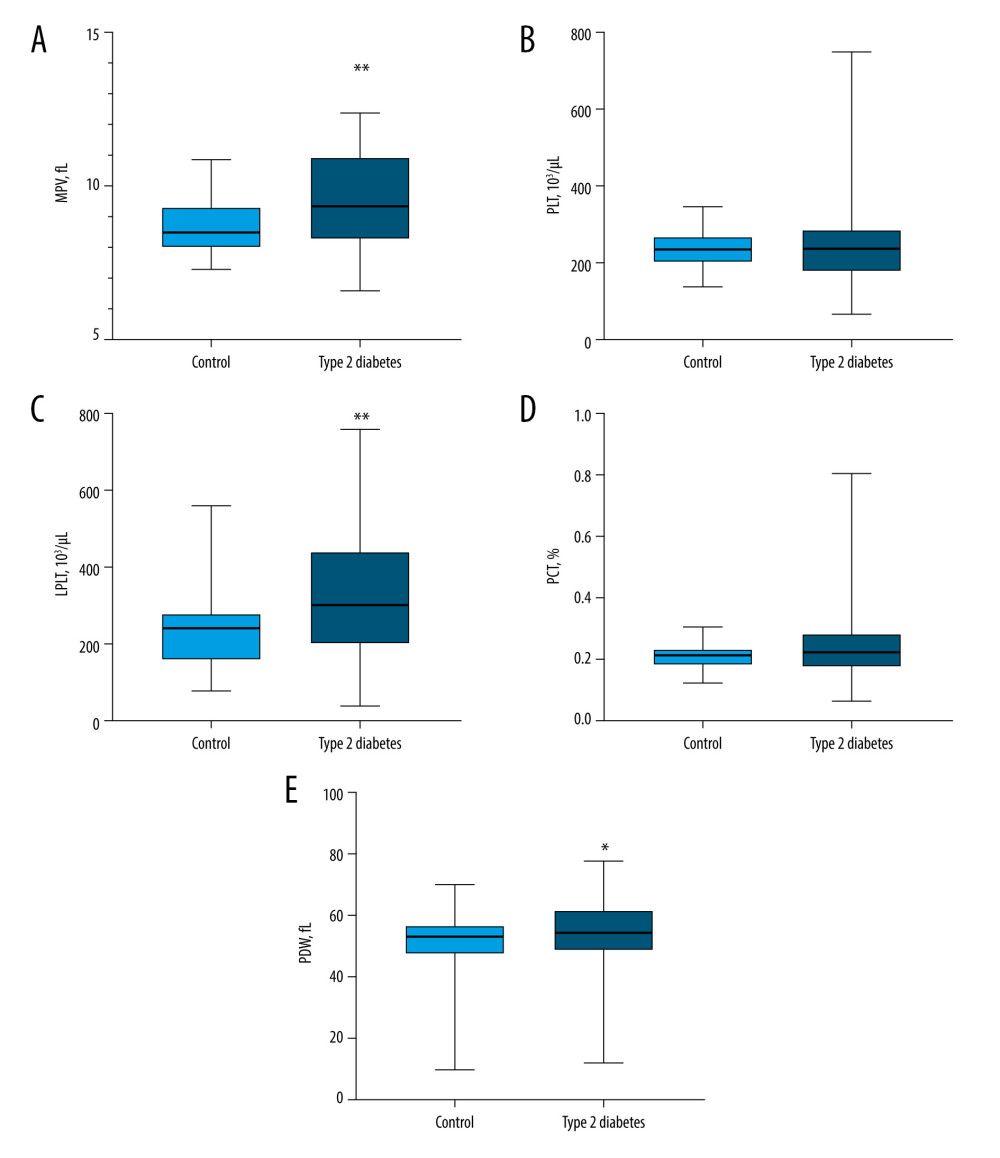 Figure 1. Platelet morphological parameters result in type 2 diabetes patients compared with those in the control group(A) The median mean platelet volume (MPV) in patients with type 2 diabetes was significantly higher compared to the control group (P=0.0017). (B) The median PLT in patients with type 2 diabetes did not differ from that of the control group (P=0.6833). (C) The median LPLT in patients with type 2 diabetes was significantly higher than that of the control group (P=0.0014). (D) The median PCT in patients with type 2 diabetes did not differ from that of the control group (P=0.1081). (E) The median PDW in patients with type 2 diabetes was significantly higher than that of the control group (P=0.0349). LPLT – large platelet count; MPV – mean platelet volume; PCT – plateletcrit; PDW – platelet distribution width; PLT – platelet count. Statistical significance: * P≤0.05, ** P≤0.01. The figure was created with the use of the GraphPad Prism 8.0 software (GraphPad Software, San Diego, CA, USA).
 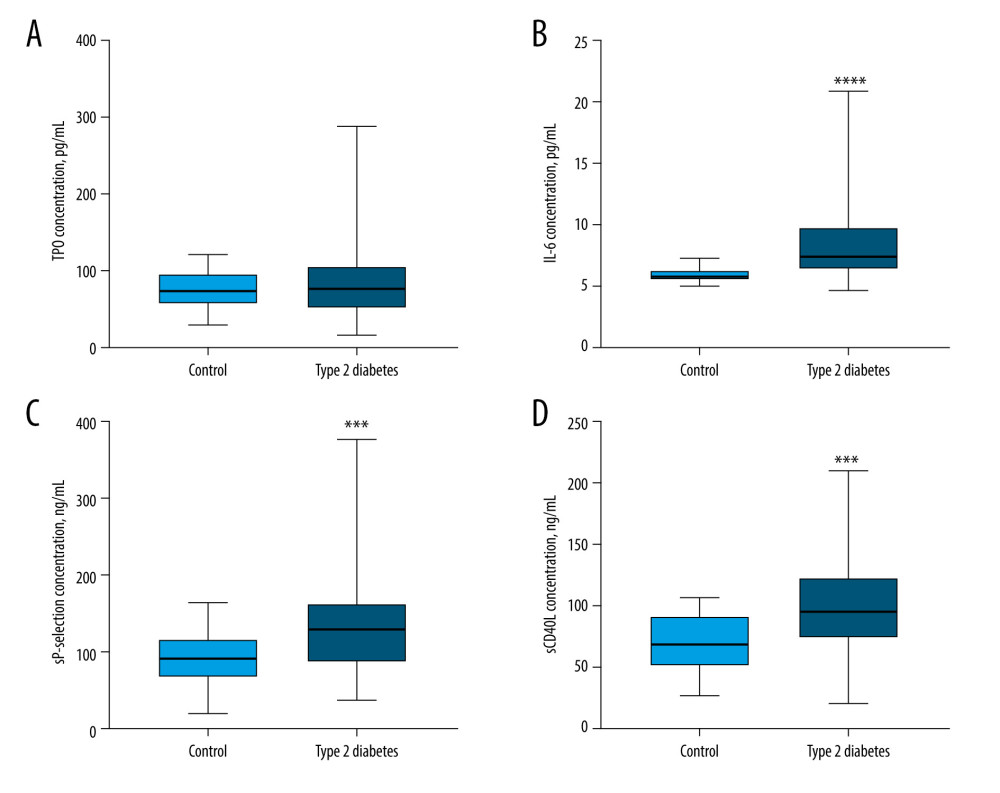 Figure 2. Comparison of TPO, IL-6, sP-selectin, and sCD40L concentration results in type 2 diabetes patients and the control group(A) The median TPO concentration in patients with type 2 diabetes did not differ from that of the control group (P=0.7210). (B) The median IL-6 concentration in patients with type 2 diabetes was significantly higher than that of the control group (P<0.0001). (C) The median sP-selectin concentration in patients with type 2 diabetes was significantly higher than that of the control group (P=0.0008). (D) The median sCD40L concentration in patients with type 2 diabetes was significantly higher than that of the control group (P=0.0010). IL-6 – interleukin 6; sCD40L – soluble form of CD40L; sP-selectin – soluble form of selectin P; TPO – thrombopoietin. Statistical significance: *** P≤0.001, **** P≤0.0001. The figure was created with the use of the GraphPad Prism 8.0 software (GraphPad Software, San Diego, CA, USA).
 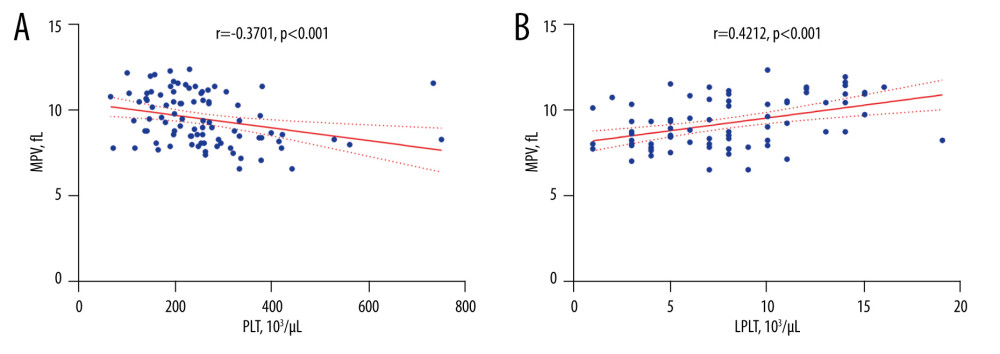 Figure 3. The correlation coefficient results(A) In type 2 diabetes patients, a negative correlation between MPV and PLT was found (r=−0.3701; P<0.001). (B) In type 2 diabetes patients, a positive correlation between MPV and LPLT was found (r=0.4212; P<0.001). LPLT – large platelet count; PLT – platelet count; MPV – mean platelet volume. The figure was created with the use of the GraphPad Prism 8.0 software (GraphPad Software, San Diego, CA, USA).
 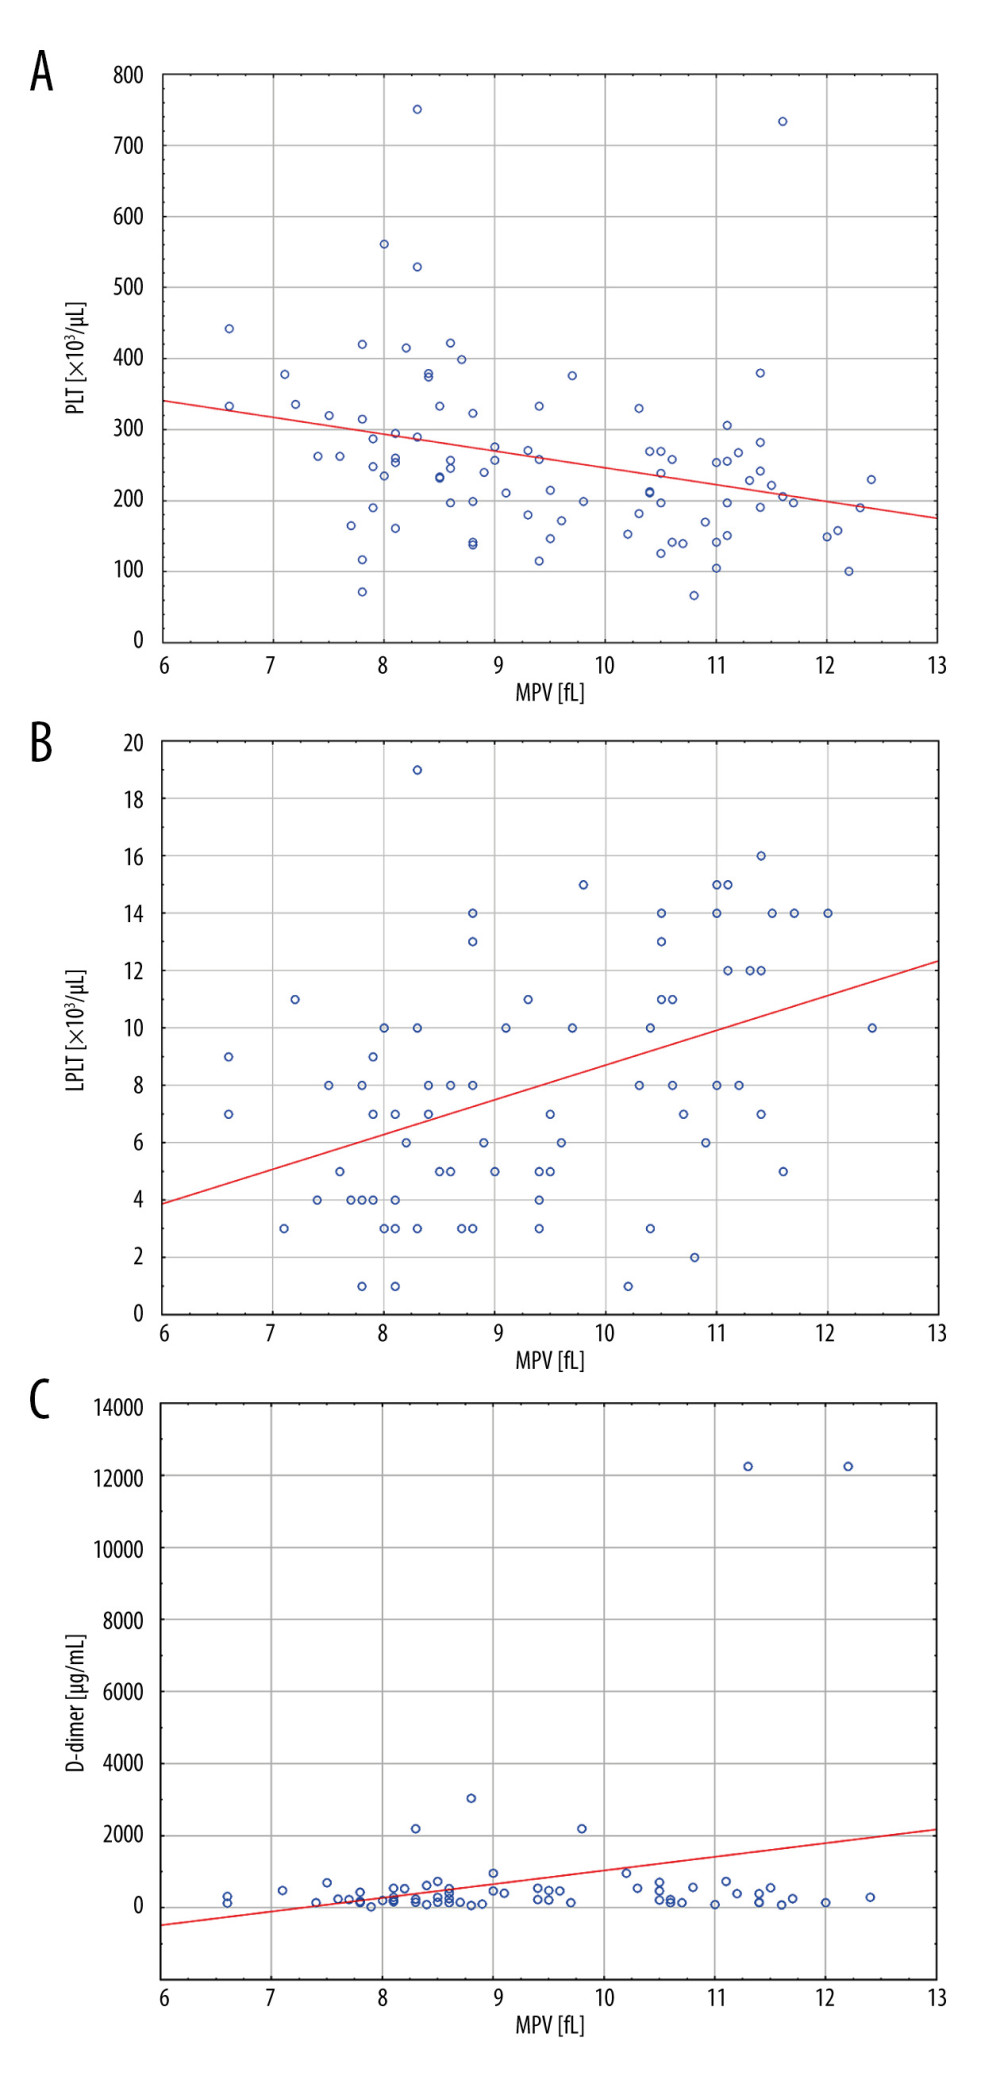 Figure 4. Linear regression analysis results for MPV(A) With an increase in PLT, the MPV value decreased (P=0.005). (B) With an increase in LPLT, the MPV value increased (P<0.001). (C) With an increase in D-dimer concentration, the MPV value increased (P=0.026). LPLT – large platelet count; PLT – platelet count; MPV – mean platelet volume. The figure was created with the use of the STATISTICA 13.3 PL software (StatSoft Inc., Tulsa, OK, USA).
 Tables
Table 1. Demographic, clinical, and routine laboratory data, coexisting diseases, and medications of patients with type 2 diabetes. Table 2. Univariate and multivariate linear regression analysis results for MPV in patients with type 2 diabetes.
 Table 3. Univariate and multivariate linear regression analysis results for PLT logarithm in patients with type 2 diabetes.
 Table 4. Univariate and multivariate logistic regression analysis.
References
1. King H, Rewers M, Diabetes in adults is now a Third World problem. World Health Organization Ad Hoc Diabetes Reporting Group: Ethn Dis, 1993; 3(Suppl); 643-48
2. Lippi G, Salvagno GL, Nouvenne A, The mean platelet volume is significantly associated with higher glycated hemoglobin in a large population of unselected outpatients: Prim Care Diabetes, 2015; 9(3); 226-30
3. Genuth SM, Palmer JP, Nathan DM: Diabetes in America, 3rd Edition, Chapter 1: Classification and diagnosis of diabetes https://www.ncbi.nlm.nih.gov/books/NBK568014/
4. Nakashima D, Onuma T, Tanabe K, Synergistic effect of collagen and CXCL12 in the low doses on human platelet activation: PLoS One, 2020; 15(10); 1-21
5. Polek A, Sobiczewski W, Matowicka-Karna JP-selectin and its role in some diseases: Postepy Hig Med Dosw (Online), 2009; 63; 465-70 [in Polish]
6. Chandrakanthan M, Nguyen TQ, Hasan Z, Deletion of Mfsd2b impairs thrombotic functions of platelets: Nat Commun, 2021; 12(1); 1-14
7. Sari O, Bashir AM, Early change in platelet count and MPV levels of patients who received hemodialysis for the first time: Mogadishu Somalia experience: Int J Clin Pract, 2022; 2022; 1503227
8. Ulutas KT, Dokuyucu R, Sefil F, Evaluation of mean platelet volume in patients with type 2 diabetes mellitus and blood glucose regulation: A marker for atherosclerosis?: Int J Clin Exp Med, 2014; 7(4); 955-61
9. Hekimsoy Z, Payzin B, Örnek T, Kandogan G, Mean platelet volume in type 2 diabetic patients: J Diabetes Complications, 2004; 18(3); 173-76
10. Inoue H, Saito M, Kouchi K, Association between mean platelet volume in the pathogenesis of type 2 diabetes mellitus and diabetic macrovascular complications in Japanese patients: J Diabetes Investig, 2020; 11(4); 938-45
11. Chang HY, Yazdani A, Li X, Quantifying platelet margination in diabetic blood flow: Biophys J, 2018; 115(7); 1371-82
12. Li Z, Wang J, Han X, Association of mean platelet volume with incident type 2 diabetes mellitus risk: The Dongfeng-Tongji cohort study: Diabetol Metab Syndr, 2018; 10(1); 4-11
13. Thon J, Italiano J, Platelet formation: Semin Hematol, 2010; 47(3); 220-26
14. Bhat FA, Advani J, Khan AA, A network map of thrombopoietin signaling: J Cell Commun Signal, 2018; 12(4); 737-43
15. Noetzli LJ, French SL, Machlus KR, New insights into the differentiation of megakaryocytes from hematopoietic progenitors: Arterioscler Thromb Vasc Biol, 2019; 39(7); 1288-300
16. Bosco O, Vizio B, Gruden G, Thrombopoietin contributes to enhanced platelet activation in patients with type 1 diabetes mellitus: Int J Mol Sci, 2021; 22(13); 1-12
17. Larsen SB, Grove EL, Hvas AM, Kristensen SD, Platelet turnover in stable coronary artery disease – influence of thrombopoietin and low-grade inflammation: PLoS One, 2014; 9(1); 1-7
18. Didion SP, Cellular and oxidative mechanisms associated with interleukin-6 signaling in the vasculature: Int J Mol Sci, 2017; 18(12); 2563
19. Brown AS, Hong Y, De Belder A, Megakaryocyte ploidy and platelet changes in human diabetes and atherosclerosis: Arterioscler Thromb Vasc Biol, 1997; 17(4); 802-7
20. Korniluk A, Koper-Lenkiewicz OM, Kamińska J, Mean platelet volume (MPV): New perspectives for an old marker in the course and prognosis of inflammatory conditions: Mediators Inflamm, 2019; 2019; 9213074
21. Pretorius L, Thomson GJA, Adams RCM, Platelet activity and hypercoagulation in type 2 diabetes: Cardiovasc Diabetol, 2018; 17(1); 1-11
22. Bavbek N, Kargili A, Kaftan O, Elevated concentrations of soluble adhesion molecules and large platelets in diabetic patients: Are they markers of vascular disease and diabetic nephropathy?: Clin Appl Thromb, 2007; 13(4); 391-97
23. Neubauer H, Setiadi P, Günesdogan B, Influence of glycaemic control on platelet bound CD40-CD40L system, P-selectin and soluble CD40 ligand in type 2 diabetes: Diabet Med, 2010; 27(4); 384-90
24. Varo N, Vicent D, Libby P, Elevated plasma levels of the atherogenic mediator soluble CD40 ligand in diabetic patients: A novel target of thiazolidinediones: Circulation, 2003; 107(21); 2664-69
25. Marx N, Imhof A, Froehlich J, Effect of rosiglitazone treatment on soluble CD40L in patients with type 2 diabetes and coronary artery disease: Circulation, 2003; 107(15); 1954-57
26. Korniluk A, Kemona H, Dymicka-Piekarska V, Multifunctional CD40L: Pro- and anti-neoplastic activity: Tumor Biol, 2014; 35; 9447-57
27. Doublier S, Zennaro C, Musante L, Soluble CD40 ligand directly alters glomerular permeability and may act as a circulating permeability factor in FSGS: PLoS One, 2017; 12(11); 1-21
28. Cognasse F, Duchez AC, Audoux E, Platelets as key factors in inflammation: Focus on CD40L/CD40: Front Immunol, 2022; 13(February); 1-11
29. Kodiatte TA, Manikyam UK, Rao SB, Mean platelet volume in type 2 diabetes mellitus: J Lab Physicians, 2012; 4(01); 5-9
30. Grove EL, Hvas AM, Mortensen SB, Effect of platelet turnover on whole blood platelet aggregation in patients with coronary artery disease: J Thromb Haemost, 2011; 9(1); 185-91
31. Colwell JA, Vascular thrombosis in type II diabetes mellitus: Diabetes, 1993; 42(1); 8-11
32. Rivas-Ruiz R, Moreno-Palacios J, Talavera JOClinical research XVI. Differences between medians with the Mann-Whitney U test: Rev Med Inst Mex Seguro Soc, 2013; 51(4); 414-19
33. Vickers AJ, Parametric versus non-parametric statistics in the analysis of randomized trials with non-normally distributed data: BMC Med Res Methodol, 2005; 5(1); 35
34. Seyed Ahmadi S, Svensson AM, Pivodic A, Risk of atrial fibrillation in persons with type 2 diabetes and the excess risk in relation to glycaemic control and renal function: A Swedish cohort study: Cardiovasc Diabetol, 2020; 19(1); 1-12
35. Kaur R, Kaur M, Singh J, Endothelial dysfunction and platelet hyperactivity in type 2 diabetes mellitus: Molecular insights and therapeutic strategies: Cardiovasc Diabetol, 2018; 17(1); 1-17
36. Camm AJ, Sabbour H, Schnell O, Managing thrombotic risk in patients with diabetes: Cardiovasc Diabetol, 2022; 21(1); 160
37. Okada H, Fukui M, Tanaka M, Visit-to-visit variability in systolic blood pressure is correlated with diabetic nephropathy and atherosclerosis in patients with type 2 diabetes: Atherosclerosis, 2012; 220(1); 155-59
38. Wattanakit K, Cushman M, Chronic kidney disease and venous thromboembolism: Epidemiology and mechanisms: Curr Opin Pulm Med, 2009; 15(5); 408-12
39. Sertbas Y, Sertbas M, Okuroglu N, Mean platelet volume changes before and after glycated hemoglobin (HbA 1c) improvement in a large study population: Arch Med Sci, 2017; 4(4); 711-15
40. Hwang DL, Yen CF, Nadler JL, Insulin increases intracellular magnesium transport in human platelets: J Clin Endocrinol Metab, 1993; 76(3); 549-53
41. Loho T, Venna V, Setiabudy RD, Correlation between vitreous advanced glycation end products, and D-dimer with blood HbA1c levels in proliferative diabetic retinopathy: Acta Med Indones, 2018; 50(2); 132-37
42. Zhuang L, Yu C, Xu F, Increased plasma D-dimer levels may be a promising indicator for diabetic peripheral neuropathy in type 2 diabetes: Front Endocrinol (Lausanne), 2022; 13(August); 1-13
43. Nwose EU, Richards RS, Jelinek HF, Kerr PG, D-dimer identifies stages in the progression of diabetes mellitus from family history of diabetes to cardiovascular complications: Pathology, 2007; 39(2); 252-57
44. Trifiletti A, Lasco A, Scamardi R, Hemostasis and fibrinolysis factors in first-degree relatives of patients with type 2 diabetes without hypertension: Pathophysiol Haemost Thromb, 2002; 32(3); 127-30
45. Cheng L, Fu Q, Zhou L, D-dimer as a predictor of cardiovascular outcomes in patients with diabetes mellitus: BMC Cardiovasc Disord, 2022; 22(1); 1-6
46. Imberti D, D-dimer testing: Advantages and limitations in emergency medicine for managing acute venous thromboembolism: Intern Emerg Med, 2007; 2(1); 70-71
47. Jia X, Zhang X, Sun D, Triglyceride to HDL-C ratio is associated with plasma D-dimer levels in different types of pancreatitis: Sci Rep, 2022; 12(1); 1-12
48. Tsujimoto T, Sugiyama T, Noda M, Kajio H, Intensive glycemic therapy in patients with type 2 diabetes on β-blockers: Diabetes Care, 2016; 39(10); 1818-26
49. Bonten TN, Plaizier CEID, Snoep JJ, Effect of β-blockers on platelet aggregation: A systematic review and meta-analysis: Br J Clin Pharmacol, 2014; 78(5); 940-49
50. Angiolillo DJ, Bernardo E, Ramírez C, Insulin therapy is associated with platelet dysfunction in patients with type 2 diabetes mellitus on dual oral antiplatelet treatment: J Am Coll Cardiol, 2006; 48(2); 298-304
51. Alay M, Atmaca M, Ucler R, The effects of blood glucose regulation and treatment regime on mean platelet volume in type 2 diabetic patients: Niger J Clin Pract, 2021; 24(6); 808
52. Vernekar PV, Ananda Vaidya K, Comparison of mean platelet volume in type 2 diabetics on insulin therapy and on oral hypoglycaemic agents: J Clin Diagnostic Res, 2013; 7(12); 2839-40
53. Şahpaz F, Ulutaş KT, Assessment of mean platelet volume in type 2 diabetics receiving insulin or oral antidiabetic agents: Dicle Med J, 2015; 42(4); 399-403
54. Ferreira IA, Mocking AIM, Feijge MAH, Platelet inhibition by insulin is absent in type 2 diabetes mellitus: Arterioscler Thromb Vasc Biol, 2006; 26(2); 417-22
55. Schneider DJ, Factors contributing to increased platelet reactivity in people with diabetes: Diabetes Care, 2009; 32(4); 525-27
56. Wojszel J, Czyzewska J, Dymicka-Piekarska VPlatelets activation in depending on glycaemic control in diabetes type 2: Pol Merkur Lekarski, 2008; 25(148); 335-39 [in Polish]
57. Demirtunc R, Duman D, Basar M, The relationship between glycemic control and platelet activity in type 2 diabetes mellitus: J Diabetes Complications, 2009; 23(2); 89-94
58. Papanas N, Symeonidis G, Maltezos E, Mean platelet volume in patients with type 2 diabetes mellitus: Platelets, 2004; 15(8); 475-78
59. Chu SG, Becker RC, Berger PB, Mean platelet volume as a predictor of cardiovascular risk: A systematic review and meta-analysis: J Thromb Haemost, 2010; 8(1); 148-56
Figures
Figure 1. Platelet morphological parameters result in type 2 diabetes patients compared with those in the control group(A) The median mean platelet volume (MPV) in patients with type 2 diabetes was significantly higher compared to the control group (P=0.0017). (B) The median PLT in patients with type 2 diabetes did not differ from that of the control group (P=0.6833). (C) The median LPLT in patients with type 2 diabetes was significantly higher than that of the control group (P=0.0014). (D) The median PCT in patients with type 2 diabetes did not differ from that of the control group (P=0.1081). (E) The median PDW in patients with type 2 diabetes was significantly higher than that of the control group (P=0.0349). LPLT – large platelet count; MPV – mean platelet volume; PCT – plateletcrit; PDW – platelet distribution width; PLT – platelet count. Statistical significance: * P≤0.05, ** P≤0.01. The figure was created with the use of the GraphPad Prism 8.0 software (GraphPad Software, San Diego, CA, USA).Figure 2. Comparison of TPO, IL-6, sP-selectin, and sCD40L concentration results in type 2 diabetes patients and the control group(A) The median TPO concentration in patients with type 2 diabetes did not differ from that of the control group (P=0.7210). (B) The median IL-6 concentration in patients with type 2 diabetes was significantly higher than that of the control group (P<0.0001). (C) The median sP-selectin concentration in patients with type 2 diabetes was significantly higher than that of the control group (P=0.0008). (D) The median sCD40L concentration in patients with type 2 diabetes was significantly higher than that of the control group (P=0.0010). IL-6 – interleukin 6; sCD40L – soluble form of CD40L; sP-selectin – soluble form of selectin P; TPO – thrombopoietin. Statistical significance: *** P≤0.001, **** P≤0.0001. The figure was created with the use of the GraphPad Prism 8.0 software (GraphPad Software, San Diego, CA, USA).Figure 3. The correlation coefficient results(A) In type 2 diabetes patients, a negative correlation between MPV and PLT was found (r=−0.3701; P<0.001). (B) In type 2 diabetes patients, a positive correlation between MPV and LPLT was found (r=0.4212; P<0.001). LPLT – large platelet count; PLT – platelet count; MPV – mean platelet volume. The figure was created with the use of the GraphPad Prism 8.0 software (GraphPad Software, San Diego, CA, USA).Figure 4. Linear regression analysis results for MPV(A) With an increase in PLT, the MPV value decreased (P=0.005). (B) With an increase in LPLT, the MPV value increased (P<0.001). (C) With an increase in D-dimer concentration, the MPV value increased (P=0.026). LPLT – large platelet count; PLT – platelet count; MPV – mean platelet volume. The figure was created with the use of the STATISTICA 13.3 PL software (StatSoft Inc., Tulsa, OK, USA). Tables
Table 1. Demographic, clinical, and routine laboratory data, coexisting diseases, and medications of patients with type 2 diabetes.Table 2. Univariate and multivariate linear regression analysis results for MPV in patients with type 2 diabetes.Table 3. Univariate and multivariate linear regression analysis results for PLT logarithm in patients with type 2 diabetes.Table 4. Univariate and multivariate logistic regression analysis.Table 1. Demographic, clinical, and routine laboratory data, coexisting diseases, and medications of patients with type 2 diabetes.Table 2. Univariate and multivariate linear regression analysis results for MPV in patients with type 2 diabetes.Table 3. Univariate and multivariate linear regression analysis results for PLT logarithm in patients with type 2 diabetes.Table 4. Univariate and multivariate logistic regression analysis. In Press
Clinical Research
Effects of Single-Bout Endurance Exercise Intensity on Peripheral Neurotrophic Factors in Patients With Isc...Med Sci Monit In Press; DOI: 10.12659/MSM.952089
Review article
Anisodus tanguticus in Cancer Research: A Review of Traditional Use, Phytochemistry, Extraction Methods, an...Med Sci Monit In Press; DOI: 10.12659/MSM.952999
Clinical Research
Nasal Mucociliary Clearance and Its Relationship With Disease Severity in Patients With Multiple SclerosisMed Sci Monit In Press; DOI: 10.12659/MSM.952850
Clinical Research
Modified Thoracoabdominal Nerves Block Through the Perichondrial Approach vs Subcostal Transversus Abdomini...Med Sci Monit In Press; DOI: 10.12659/MSM.953976
Most Viewed Current Articles
17 Jan 2024 : Review article 14,176,570
Vaccination Guidelines for Pregnant Women: Addressing COVID-19 and the Omicron VariantDOI :10.12659/MSM.942799
Med Sci Monit 2024; 30:e942799
13 Nov 2021 : Clinical Research 3,762,188
Acceptance of COVID-19 Vaccination and Its Associated Factors Among Cancer Patients Attending the Oncology ...DOI :10.12659/MSM.932788
Med Sci Monit 2021; 27:e932788
14 Dec 2022 : Clinical Research 2,466,310
Prevalence and Variability of Allergen-Specific Immunoglobulin E in Patients with Elevated Tryptase LevelsDOI :10.12659/MSM.937990
Med Sci Monit 2022; 28:e937990
16 May 2023 : Clinical Research 708,927
Electrophysiological Testing for an Auditory Processing Disorder and Reading Performance in 54 School Stude...DOI :10.12659/MSM.940387
Med Sci Monit 2023; 29:e940387