29 November 2023: Lab/In Vitro Research
Changes in Gut Microbiota at 1–60 Days in 92 Preterm Infants in a Neonatal Intensive Care Unit Using 16S rRNA Gene Sequencing
Yuanyuan Chen1BCDE, Yanbo Lu2CE, Ting Wang1CDF, Junhua Wu2AEFG*, Beirong Yu2ABGDOI: 10.12659/MSM.941560
Med Sci Monit 2023; 29:e941560


Abstract
BACKGROUND: Neonatal gut diversity is influenced by birth conditions and probiotic/antibiotic use. The gut microbiota affects brain development, immunity, and risk of diseases. Preterm infants, especially in neonatal intensive care units (NICUs), have different gut flora from full-term infants, suggesting in utero microbial colonization. This study examined gut microbiota changes in 92 NICU preterm infants in China.
MATERIAL AND METHODS: We collected data on 92 preterm infants admitted to the NICU immediately after birth, and fecal samples were collected on days 1, 3, 7, 14, 21, 28, and 60. We analyzed changes in intestinal bacteria through 16S rRNA sequencing, predicted the change in gut microbiota function over time, and compared the effects of main feeding modality on the intestinal bacteria of preterm infants.
RESULTS: At the phylum level, the top 5 phyla in total accounted for 99.69% of the abundance, in decreasing order of abundance: Proteobacteria, Firmicutes, Actinobacteria, Tenericutes, and Bacteroidetes. At the genus level, the top 10 genera in terms of abundance accounted for a total of 90.90%, in decreasing order of abundance: Pseudomonas, Staphylococcus, Klebsiella, Escherichia-Shigella, unclassified Enterobacteriaceae, Staphylococcus, Clostridium-sensu-stricto-1, Streptococcus, Sphingomonas, and Ureaplasma. The abundance of Proteobacteria and Pseudomonas showed a decreasing trend at first, reached a minimum at day 14, and then an increasing trend, while the opposite trend was observed for Firmicutes. The metabolic function of the bacterial community changed greatly at different time points. The abundance of Proteobacteria at the phylum level and Streptococcus at the genus level in formula-fed infants were significantly higher than in breast-fed infants.
CONCLUSIONS: Between 1 and 60 days, the gut microbiome in preterm infants in the NICU changed with changes in feeding patterns, with the main gut bacteria being from the phyla, Proteobacteria, and Pseudomonas.
Keywords: Infant, Premature, Gastrointestinal Microbiome, Feeding Methods, Metabolic Networks and Pathways
Background
The human gut microbiota has a highly diverse microecology, with a large number of about 1014 in healthy humans, which is 10–20 times the total number of cells in the human body [1]. In the neonatal period, the diversity of the gut microbiota is in a critical period of dynamic change, influenced not only by various factors such as birth weight, gestational age, mode of delivery, and feeding practices, but also closely related to the use of probiotics and antibiotics and the timing of their use [2–4].
Animal studies have found differences in brain morphology and neuronal development between germ-free mice and normal mice [5], suggesting that gut microbiota may be involved in brain development. Studies on germ-free mice suggest that the bacteria are critical for development of gut-associated lymphoid tissues [6]. Bacteria may also be involved in the formation and maturation of the immune system by mediating innate and adaptive immunity [7]. Intestinal bacteria also may be involved in the development of preterm diseases such as bronchopulmonary dysplasia, neonatal necrotizing small-bowel colitis, late-onset sepsis, and parenteral nutrition-associated liver disease (PNALD) in preterm infants [8–11].
Preterm infants are newborns born at a gestational age of less than 37 weeks. There are significant differences in gut microbiota between preterm and term infants [12]. Compared to term infants, preterm infants have a later onset of establishment of gut microbiota, lower abundance and diversity of gut microbiota, and higher species diversity and levels of pathogenic bacteria [13]. Previous studies have shown the gut microbiota of premature infants at the phylum level, with a significant decrease in Firmicutes and a significant increase in Proteobacteria [14]. Preterm infants had higher abundance of Bacteroides, Lactobacillus, Enterobacter, Klebsiella, and Enterococcus than term infants, while Bifidobacterium had low abundance and delayed colonization, low microbiota diversity, and delayed time to peak abundance [14,15].
Infants in the neonatal intensive care unit (NICU) are a unique patient population with underdeveloped systems and a microbiome that is just beginning to form [16], and it has been previously shown that the gut microbiomes of these infants are often similar to the microbes found in the NICU [17]. Preterm infants hospitalized in the NICU are a special cohort with underdeveloped organs, high risk of infections, undergoing many complex operations, and separation from their mothers, and need more attention and research devoted to them.
Previously, it was believed that the fetus grows in a sterile environment and that microbial colonization occurs after birth [8]. However, in recent years, studies have shown that the placenta, fetal membranes, amniotic fluid, umbilical cord blood, and fetal stool of a normal pregnancy contain microorganisms [9], and that vertical mother-to-fetal transmission of intestinal microorganisms may occur in utero [18]. A study of 218 newborns found that prenatal maternal bacterial exposure affects fetal stool microbiota [11]. Gosalbes et al [19] reported that at 7 months of age, the microbial composition of infants’ feces was still very similar to that of fetal feces, suggesting that fetal gut microbes are involved in early colonization of the human gut bacteria.
Previous studies have mainly focused on comparing preterm vs term infants, and fewer studies have been conducted on changes in gut microbiota dynamics changes in preterm infants after birth. This study aimed to investigate changes in the gut microbiota at 1–60 days in 92 preterm infants in the NICU in Ningbo Women’s and Children’s Hospital in Zhejiang, China using 16S rRNA gene sequencing.
Material and Methods
PARTICIPANTS:
Ninety-two preterm infants who were admitted to the NICU of Ningbo Women’s and Children’s Hospital immediately after birth from January 2021 to April 2022 were selected for the study. Inclusion criteria were: (1) gestational age <37 weeks; (2) admission to the NICU within 24 h after birth; and (3) consent of the family at the time of specimen collection and signing of the informed consent form. Exclusion criteria were: (1) developmental malformations of various systems such as cerebral bulging, severe complex congenital heart disease, severe hydronephrosis, including digestive malformations such as congenital megacolon and biliary atresia; (2) maternal use of immunosuppressive drugs, severe immune system disorders, or infectious diseases; (3) abandonment or death within 2 weeks; and (4) family request to withdraw during the study.
General clinical data of all enrolled children were recorded, including sex, gestational age, birth weight, mode of delivery, 1-min Apgar score, 5-min Apgar score, amniotic fluid contamination, premature rupture of membranes, feeding pattern, and antibiotic use.
The diagnostic criteria for developmental malformations in the exclusion criteria were based on the 4th Edition of Practical Neonatology [20] and Zhu Futang Practice of Pediatrics (8th Edition) [21].
SAMPLE COLLECTION:
The feces on the 1st, 3rd, 7th, 14th, 21st, 28th, and 60th postnatal days were taken by a person with sterile gloves in a special sterile sample box for collecting feces, avoiding the surface and urine contamination, and about 2 g of fresh feces were retained and immediately stored in a −80°C freezer.
DNA EXTRACTION:
We used the Tiangen Fecal DNA Extraction Kit (Tiangen Biochemical Technology Co., LTF.) to extract the total DNA of fecal bacteria. The extracted DNA was subjected to quality control.
PCR AMPLIFICATION:
The V3–V4 region of the qualified DNA product was amplified with primers (338F: ACTCCTACGGGAGGCAGCA,806R: GGACTACHVGGGTWTCTAAT) designed for the conserved region. Negative controls are also set up to detect microbial contamination of the environment and reagents.
PURIFYING AND RECOVERING AMPLIFIED GENE SEQUENCE:
The amplified products were purified and recovered using Vazyme VAHTSTM DNA Clean Beads and quantified fluorescently using the Quant-iT PicoGreen dsDNA Assay Kit. Based on the fluorescence quantification results, the samples were mixed according to the sequencing volume required for each sample in the appropriate proportion.
LIBRARY PREPARATION AND GENE SEQUENCING:
PCR products were further sequenced using Illumina’s TruSeq Nano DNA LT Library Prep Kit, in which PCR primers were amplified by adding junctions between the sequencing primer binding region and the sample tag sequence at both ends of the PCR primer. The resulting libraries were quality controlled using a DNA quality control instrument (Agilent Bioanalyzer). The quality-controlled libraries were double-ended sequenced on Illumina’s MiSeq platform sequencer.
BIOINFORMATICS ANALYSIS:
Raw data obtained in Illumina’s MiSeq platform were first excised with the QIIME2 cutadapt plug-in to excise the primer fragments of the sequences and discarded the unmatched primer sequences. The Amplicon sequence variation (ASV) was obtained after QIIME2 Dada2 quality control and denoising, and the ASV signature sequences were compared with the template sequences in the corresponding databases to obtain the corresponding taxonomic information for each ASV. Species annotation was performed using the Naive Bayes classifier, and the species were finally classified into 6 hierarchical levels: kingdom, phylum, order, family, genus, and species. Chao1 index, observed species index, Shannon index, and Simpson index were calculated separately for each sample by QIIME2 software to reflect the sample alpha diversity. Analyses of principal coordinates (PCoA) and Analysis of Similarities (ANOSIM) used the R vegan package. Functional prediction analysis was performed using PICRUSt2 gene prediction software.
STATISTICAL ANALYSES:
The data were statistically analyzed using SPSS21.0 and GraphPad Prism8.0 software, and the results are expressed as mean±SD deviation for data with normal distribution. Alpha diversity was compared using one-way ANOVA, and Welch’s ANOVA was used when the chi-square was not appropriate, and the F value was used for testing. The Kruskal-Wallis H test was used to compare the abundance of phylum and genus level flora and the abundance of metabolic functions. The above correlation statistical analysis, with
Results
CHARACTERISTICS OF PARTICIPANTS:
In this study, a total of 92 preterm infants were enrolled and a total of 448 stool specimens were collected. The numbers were 88, 77, 76, 78, 66, 48 and 15 for 1, 3, 7, 14, 21, 28 and 60 days after birth respectively (Table 1). Fifty-three (57.6%) of the 92 preterm infants were male and 39 (42.4%) were female. The average gestational age of the 92 premature infants was 30.51±2.64 weeks, of which 4 were ≤35 weeks <37 weeks, 27 were ≤32 weeks <35 weeks, 52 were ≤28 weeks <32 weeks, and 9 were ≤28 weeks. The mean birth weight was 1471.20±479.88 g. Thirty-three (35.9%) were delivered vaginally and 59 (64.1%) by caesarean section. The 1-min Apgar score was 7.97±1.08 and the 5-min Apgar score was 9.02±0.78. Fourteen (15.2%) had contaminated amniotic fluid and 27 (29.3%) had premature rupture of membranes. Breastfeeding (including mixed feeding) was present in 53 infants (57.6%), feeding intolerance was present in 19 infants (20.7%), and 90 (97.8%) had been given antibiotics after birth (Table 2).
ANALYSIS OF SEQUENCING RESULTS:
A total of 448 stool samples from 7 groups were sequenced, and a total of 48 707 014 raw sequences were obtained, with an average of 108 721 (48 707 014/448) sequences per sample. There were 45163716 valid sequences retained after filtering, chimera removal, and quality control, accounting for 92.73% (45 163 716/48 707 014) of the total, suggesting that the overall sample sequencing quality was good. The sequence lengths were concentrated in the range of 200–450 bp. There were significant differences between the original and valid sequences at different time points (original sequence F=4.698, P<0.001; valid sequence F=4.731, P<0.001), as shown in Table 3.
ASV CLUSTERING DISTRIBUTION:
A total of 21 627 ASVs were detected by 100% similarity clustering for 7 groups of effective sequences. There were 485 ASVs with the same attributes in 7 groups of samples, accounting for 2.24% of the total. There were 5125 ASVs unique to group D1, 3247 ASVs unique to group D7, 2586 ASVs unique to group D14, 2558 ASVs unique to group D21, 1674 ASVs unique to group D28, and 811 ASVs unique to group D60, as shown in Figure 1.
ALPHA DIVERSITY ANALYSIS OF GUT MICROBIOTA:
In this study, the alpha diversity analysis was mainly based on the Chao1 index and observed species index, which characterize species richness, and the Shannon index and Simpson index, which characterize diversity. The 7 groups of gut microbiota alpha diversity indices were compared, and the results showed that there were differences in Chao1, observed species, and the Shannon and Simpson index at different time points, which were statistically significant (P<0.001), as shown in Table 4 and Figure 2A–2D. These results indicate that the gut microbiota diversity and richness of preterm infants changed over time.
BETA DIVERSITY AMONG THE 7 GROUPS:
Seven groups underwent PCoA principal axis analysis. The main axes, Axis1 and Axis2, occupied 3.1% and 1.9% of the difference in sample composition, respectively. The confidence ellipse of the sample composition within each group showed a good degree of intra-group aggregation, indicating a high representativeness and reliability of the sample (Figure 3). ANOSIM statistics showed a statistically significant difference in beta diversity among the 7 groups (P=0.001). These results indicate that the gut microbiota has different clustering trends at different time points.
THE MAIN COMPOSITION OF PHYLA AND GENERA OF GUT MICROBIOTA:
In total, 45 phyla and 1409 genera were detected in this study. At the phylum level, the total relative abundance of the top 5 phyla accounted for 99.69%: Proteobacteria (61.18%), Firmicutes (34.72%), Actinobacteria (2.01%), Tenericutes (0.93%), and Bacteroidetes (0.85%) (Figure 4A).
At the genus level, the total relative abundance of the top 10 genera accounted for 90.90%: Pseudomonas (34.67%), Enterococcus (18.74%), Klebsiella (9.77%), Escherichia-Shigella (8.85%), Staphylococcus (8.47%), unclassified Enterobacteriaceae (3.25%), Clostridium-sensu-stricto1 (3.15%), Streptococcus (1.90%), and Sphingomonas (1.19%). In addition, the distribution of the top 10 genera also varied at different time points (Figure 4B). The relative abundance of Bifidobacterium (0.90%) in this study was low and ranked 12th.
DIFFERENT COMPOSITION OF GUT MICROBIOTA BETWEEN BREAST-FED AND FORMULAR-FED INFANTS:
The infants were categorized into breast-fed and formula-fed groups based on the primary feeding method, with 52 breast-fed and 40 formula-fed. The top 5 phyla of relative abundance in the formula-fed group were Proteobacteria (56.08%), Firmicutes (38.70%), Actinobacteria (2.58%), Tenericutes (1.32%), and Bacteroidetes (1.06%), while the top 5 phyla of relative abundance in the breast-fed group were Proteobacteria (62.99%), Firmicutes (33.44%), Actinobacteria (1.32%), Tenericutes (0.93%), Bacteroidetes (0.93%), and Bacteroidetes (0.90%). The relative abundance of Proteobacteria in the formula-fed group was significantly higher than in the breast-fed group (
The top 10 genera of relative abundance in the formula-fed group were Pseudomonas (36.45%), Enterococcus (20.18%), Staphylococcus (11.15%), Klebsiella (6.07%), Escherichia-Shigella (3.65%), unclassified Enterobacteriaceae (3.41%), Clostridium-sensu-stricto-1 (3.27%), Streptococcus (2.56%), Ureaplasma (1.26%), and Sphingomonas (1.17%). The top 10 genera of relative abundance in the breast-fed group were Pseudomonas (38.30%), Enterococcus (17.55%), Klebsiella (9.45%), Escherichia-Shigella (9.39%), Staphylococcus (8.00%), (3.01%), Clostridium-sensu-stricto-1 (2.98%), Streptococcus (1.45%), Sphingomonas (1.39%), and Ureaplasma (0.94%). The genera ranked 1st, 2nd, 6th, 7th, and 8th were the same, and the rest of the genera had the same composition but in a different order of abundance. The composition and order of relative abundance of the top 10 genera in the breast-fed group were consistent with the top 10 genera in all infants studied. The relative abundance of Streptococcus in the formula-fed group was significantly higher than in the breast-fed group (
ANALYSIS OF THE TREND OF DOMINANT GUT BACTERIA:
At the phylum level, the Kruskal-Wallis rank sum test showed that the relative abundances of Proteobacteria (P<0.001), Firmicutes (P<0.001), Tenericutes (P<0.001), and Bacteroidetes (P<0.001) were significantly differenct at different time points, but Actinobacteria was not (P=0.616). At different time points, the trends in relative abundance of the top 5 phyla were different. The dynamic trend of relative abundance of the top 5 phyla in terms of abundance was as follows: Proteobacteria first showed a decreasing trend, with a minimum on day 14, and then increased, with absolute dominance in the gut microbiota. The relative abundance of Firmicutes and Actinobacteria showed a trend of first increasing and then decreasing, but opposite to Proteobacteria. The relative abundances of Tenericutes and Bacteroidetes were at a maximum on day 3, with an overall decreasing trend (Figure 5A).
At the genus level, there were statistically significant differences in relative abundance of Pseudomonas (P<0.001), Staphylococcus (P<0.001), Klebsiella (P<0.001), Escherichia-Shigella (P<0.001), Staphylococcus (P<0.001), Clostridium-sensu-stricto-1 (P=0.009), Streptococcus (P<0.001), Sphingomonas (P<0.001), and Ureaplasma (P=0.006) at different time points, but not of unclassified Enterobacteriaceae (P=0.051) and Bifidobacterium (P=0.423). At different time points, the trends in relative abundance of the top 10 genera were different. The dynamic trend of relative abundance of the top 10 genera in terms of abundance was as follows: Pseudomonas first showed a decreasing trend, with a minimum on day 14, and then an increasing trend. Enterococcus was similar to Staphylococcus, showing an increasing trend at first, and then gradually decreased. Klebsiella showed an increasing trend over time. Ehrlichia-Shigella, unclassified Enterobacteriaceae, Clostridium-sensu-stricto-1, Streptococcus, Sphingomonas, and Ureaplasma were basically stable, with insignificant trend changes (Figure 5B).
The relative abundance of Bifidobacterium increased from day 1 to day 7, stayed at a relative peak from day 7 to day 21, decreased from day 21 to day 28, and then showed an upward trend after day 28 (Figure 5C).
PREDICTION OF GUT MICROBIOTA FUNCTION:
PICRUSt2 compares the 16S rRNA gene sequences of the known microbial genomes with the reference sequence to obtain the copy number of the gene family corresponding to the reference sequence, infers the nearest sequence species of the characteristic sequence, and then obtain its gene family copy number. The gene family copy number of each sample was calculated by combining the abundance of the characteristic sequences of each sample. Finally, the gene families were “mapped” to the 1 database to obtain the abundance data of metabolic pathways in each sample. A total of 184 functional pathways were obtained in the third Kyoto Encyclopedia of Genes and Genomes (KEGG) pathway, and the top 80 pathways (85.06%) were analyzed for their relative functional abundance. The Kruskal-Wallis H test revealed differences in 78 pathways, and the relative abundance of the top 10 pathways were: Biosynthesis of ansamycins (P<0.001), Valine, leucine and isoleucine biosynthesis (P=0.01), Fatty acid biosynthesis (P<0.001), Bacterial chemotaxis (P<0.001), Synthesis and degradation of ketone bodies (P<0.001), D-Alanine metabolism (P<0.001), Peptidoglycan biosynthesis (P<0.001), One carbon pool by folate (P=0.003), D-Glutamine and D-glutamate metabolism (P<0.001), and Pyruvate metabolism (P<0.001), as shown in Figure 6. These results indicate that differential functional pathways are mainly associated with the metabolism of energy and nutrients.
Discussion
The global average incidence of preterm birth is 10.6% and in China it is 6.9% [22]. Complications of preterm birth are the leading cause of death in children under 5 years of age [23]. Premature infants are a special group of neonates with low immune function, and they are susceptible to bronchopulmonary dysplasia (BPD), neonatal necrotizing small bowel colitis (NEC), and neonatal pneumonia [23]. By understanding the characteristics of gut microbiota dynamics in preterm infants, we can provide a reference for the prevention and treatment of preterm complications related to gut microbiota dysbiosis.
We longitudinally tracked changes in the gut microbiota of 92 preterm infants from birth to 60 days postnatally. High-throughput sequencing results showed that a total of 45 163 716 valid sequences were obtained, accounting for 92.73% of the total sequences (45 163 716/48 707 014), and the sequencing quality was good. The difference in the number of valid sequences among the 7 time points was statistically significant (F=4.731,
At the phylum level, we found that the preterm infants had a predominance of gut microbiota of Proteobacteria at different time points, followed by Firmicutes, Actinobacteria, Tenericutes, and Bacteroidetes. The main dominant bacteria were similar to the results of Chen et al [26] and Barrett et al [27].
Analyzing the trend of each intestinal dominant phylum over time, we found that the relative abundance of Proteobacteria showed a decreasing trend at the beginning, with a minimum on day 14, then followed by an increasing trend. Firmicutes showed similar trends in relative abundance as Actinobacteria, but showed an opposite trends to that of Proteobacteria. This differs from previous studies [28], and the effect of individualized differences in gut microbiota cannot be excluded. The gut microbiota of preterm infants is less diverse and less stable compared to full-term infants, with delayed colonization and dominant microbiota associated with the inpatient setting in the NICU [29]. Therefore, we speculate that different studies yielding different results may be related to the influence of the environment in which the preterm infant lived (ie, the NICU).
At the genus level, mainly Pseudomonas were dominant, followed by Enterococcus, Klebsiella, Escherichia-Shigella, Staphylococcus, unclassified Enterobacter, Clostridium-sensu-stricto-1, Streptococcus, Sphingomonas, and Ureaplasma. This is different from the results of a previous study [28], perhaps due to the different characteristics of preterm infants, antibiotic use, and hospital environment. Brooks et al [30] found that more than half of the dominant microbiota in NICU preterm infants were common NICU drug-resistant bacteria such as Staphylococcus epidermidis and Klebsiella pneumoniae. Dao et al [31] found that pathogenic bacteria such as Klebsiella pneumoniae and Clostridium difficile were more likely to be detected in the gut microbiota of preterm infants.
An interesting feature of this study is that we found the relative abundance of Klebsiella as a conditional pathogens showed an increasing trend over time. Klebsiella, as opportunistic pathogenic Proteobacteria organisms, can cause a variety of infections such as pneumonia, urinary tract infections, meningitis, and liver abscesses [32,33], which need to be closely monitored by clinicians.
Bifidobacteria have been shown to dominate the gut microbiota of breast-fed infants and benefit the host by accelerating the maturation of the immune response, balancing the immune system to suppress inflammation, improving intestinal barrier function, and increasing acetate production [3]. In many studies of gut bacteria in newborns, the relative abundance of Bifidobacteria typically reached 40–50%, making it a dominant genus [34,35]. However, the relative abundance of Bifidobacteria in the present study was only 0.09%. More than 75% of preterm infants hospitalized in the NICU are given antibiotics, mainly beta-lactam antibiotics, which affect the intestinal bacteria and can inhibit the growth of gram-negative bacilli [36]. However, in our study, the relatively low percentage of Bifidobacterium in preterm infants hospitalized in the NICU might be related to the high frequency of antibiotic use and mechanical ventilation, the use of central venous catheters, or an increase in invasive procedures [37].
The relative abundant of Proteobacteria in the formula-fed group was significantly higher than in the breast-fed group in the present study, which is the same as in the study of Fan et al [38]. The difference between the 2 groups in the relative abundance of Bifidobacteria was not statistically significant, which agrees with the findings of some previous studies [39].
We applied PICRUST for differential functional prediction of gut microbiota in the KEGG database. Among the metabolic pathways with statistically significant differences between the 7 time points, Valine, leucine and isoleucine biosynthesis, Fatty acid biosynthesis, Peptidoglycan biosynthesis, One carbon pool by folate, D-Glutamine and D-glutamate metabolism, and Pyruvate metabolism have an impact on the metabolic function of energy and nutrients in the body [40,41].
A previous study [42] found that in preterm infants, pyruvate levels are reduced, while leucine and valine concentrations are higher in preterm infants. Failure to supplement with folic acid during pregnancy is a risk factor for preterm birth [43], while folic acid deficiency alters the concentration of the hepatic folate pool and the activity of enzymes associated with one-carbon unit metabolism [44], thus affecting the Synthesis of nucleic acids, proteins, and lipids pathway [40]. Delayed brain maturation in preterm infants causes reduced glutamine and glutamate levels [45], and glutamate excitotoxicity is thought to be a key mechanism of white matter damage, making preterm infants a high-risk group for long-term neurodevelopmental disorders [46]. Long-chain fatty acids are synthesized in the last trimester of fetal life, so preterm infants are born with low LC-PUFA reserves, which affects their growth and development [47]. Ketone bodies promote resistance to oxidative and inflammatory stress, but ketone body concentrations are lower in preterm than in term infants, who are more susceptible to inflammatory stress [48], and bacterial tropism at the site of injury can trigger chronic inflammation [48], so preterm infants are more susceptible to infection.
Of course, this study had some limitations. Firstly, we only observed the dynamic of intestinal bacteria of preterm infants during 2-month hospitalization in the NICU, which is not a long period of observation. Secondly, this study only focused on children who were hospitalized in Ningbo Women’s and Children’s Hospital, which is limited in scope. Third, in 16s rRNA high-throughput sequencing technology, the potential bias in PCR amplification and the tendency of the diversity of genes to overstate diversity estimates may lead to biased test results. In addition, the low resolution of 16s rRNA genes may result in an inability to distinguish between closely related species. We expect to expand the scope of the study in the future to achieve a multi-center, large-sample study, so that the results of the study will be more representative.
Conclusions
In the NICU, the gut microbiome of preterm infants and their metabolic-functional pathways changed from 1 to 60 days postnatally, with the predominant gut bacteria coming from the phyla Aspergillus and Pseudomonas, while the relative abundance of Bifidobacteria was low. We also found that feeding patterns affect the gut microbiome of preterm infants.
Figures
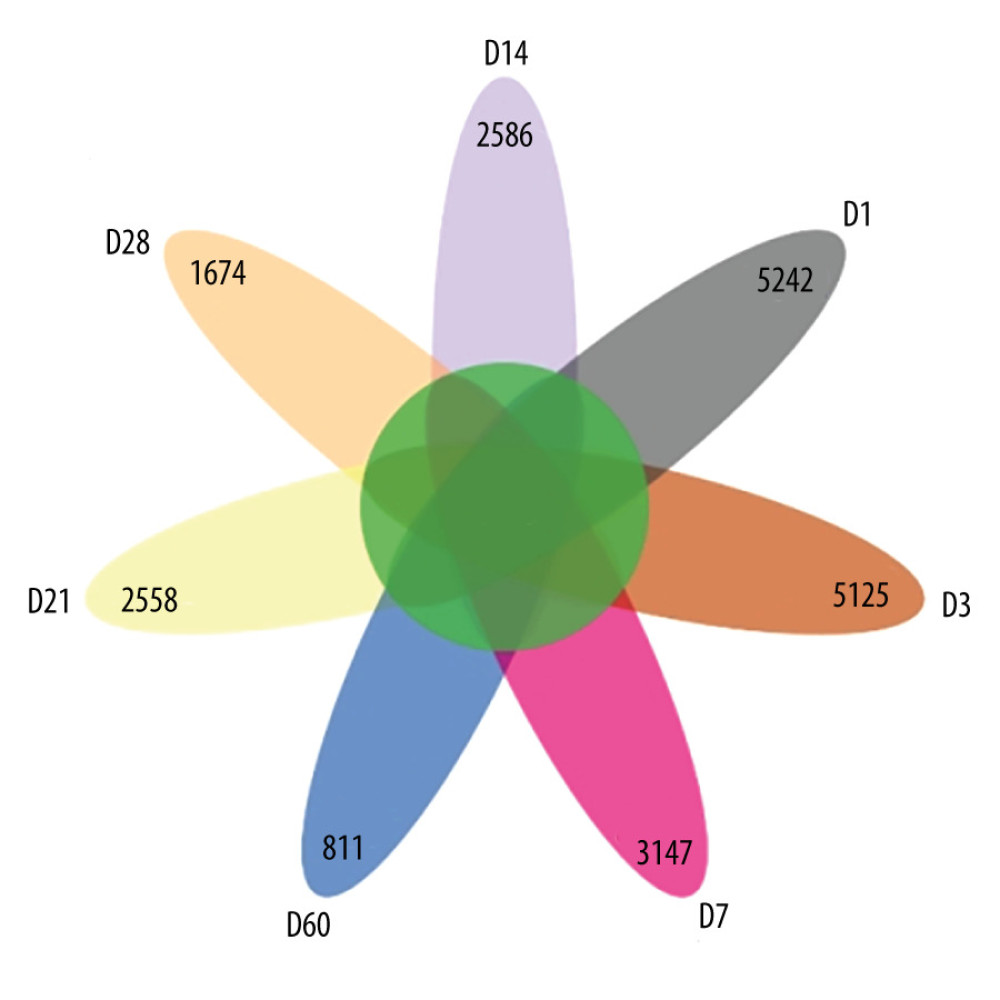 Figure 1. Amplicon sequence variation (ASV) petal diagram (R-Studio v7.2).
 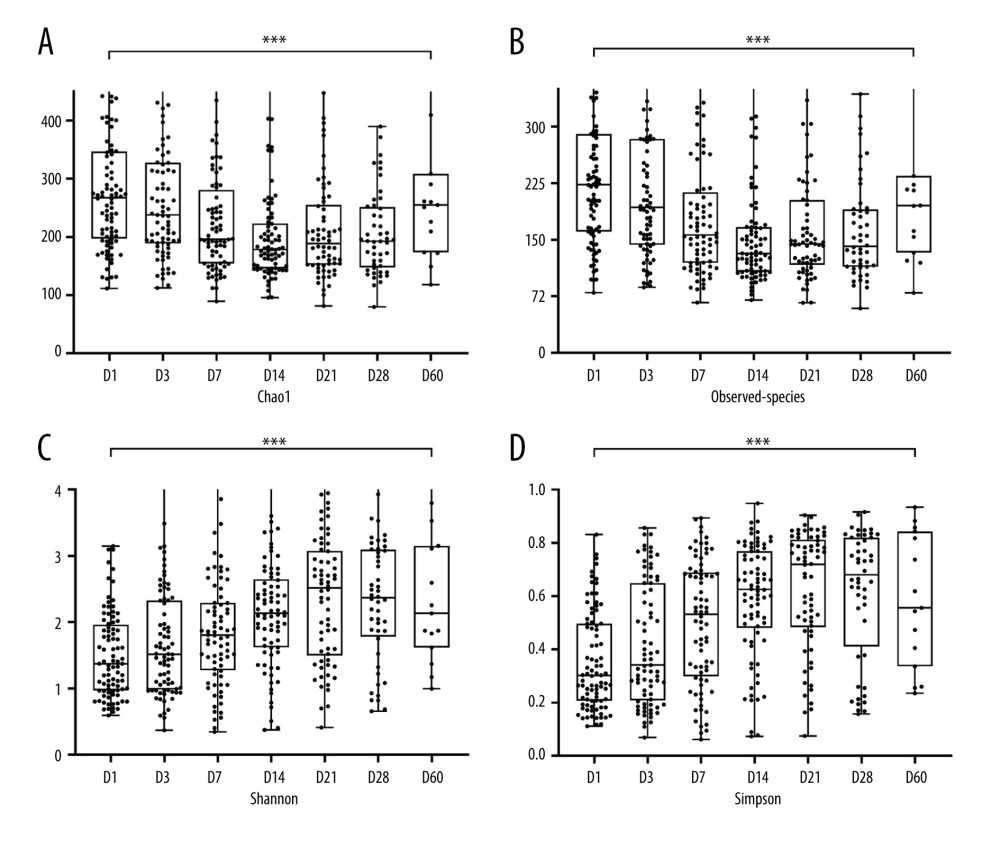 Figure 2. Box plots of alpha diversity indices at 7 time points. (A) Chao1 index. (B) Observed species index. (C) Shannon index. (D) Simpson index. *** P<0.001. (R-Studio v7.2 and GraphPad Prism8.0 software).
 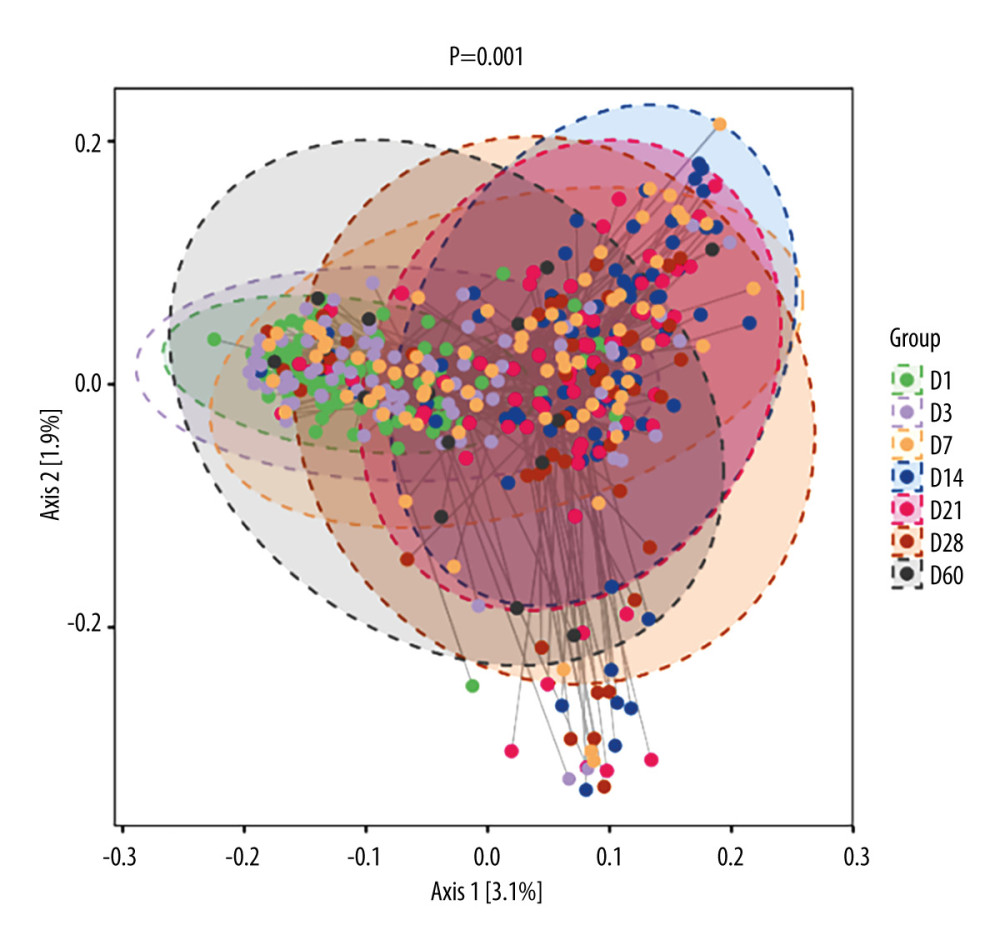 Figure 3. 2D classification plot of samples for PCoA analysis between 7 time points. The horizontal and vertical axes represent the 2 selected principal axes, and the percentages represent the values of the principal axes explaining the differences in sample composition; the scales of the horizontal and vertical axes are relative distances with no real meaning. The circles represent 95% confidence intervals. The different colors or shapes of the points represent different groups of samples. The dots of different colors or shapes represent different groups of samples, and the closer the dots are to each other, the more similar the species composition of each sample is. (R-Studio v7.2).
 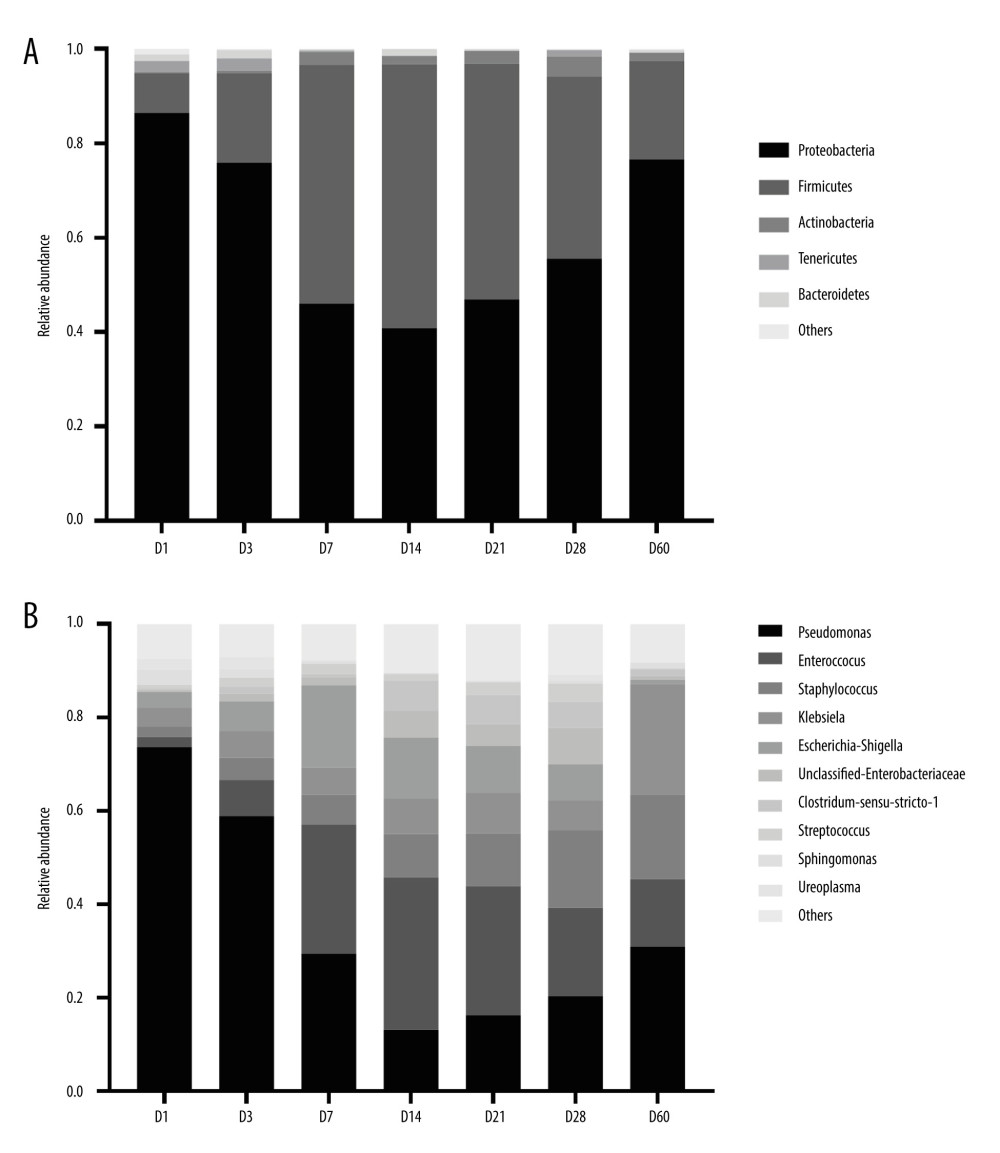 Figure 4. Histogram of the distribution of dominant intestinal bacteria in preterm infants. (A) Distribution of the top 5 phyla at different time points. (B) Distribution of the top10 genera at different time points. (GraphPad Prism8.0 software).
 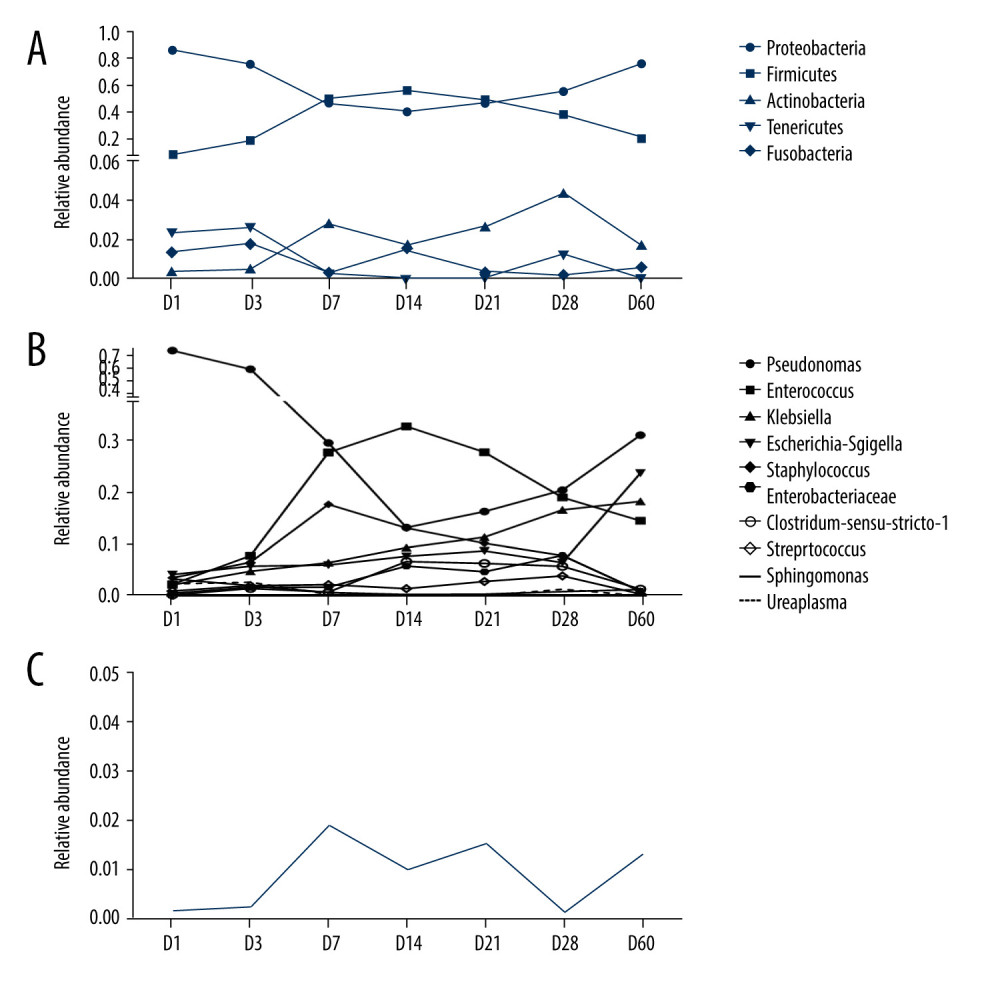 Figure 5. Line graph of relative abundance of dominant intestinal bacteria in preterm infants over time. (A) Trend of the top 5 phyla over time. (B) Trend of the top10 genera over time. (C) Trend of Bifidobacterium over time. (GraphPad Prism8.0 software).
 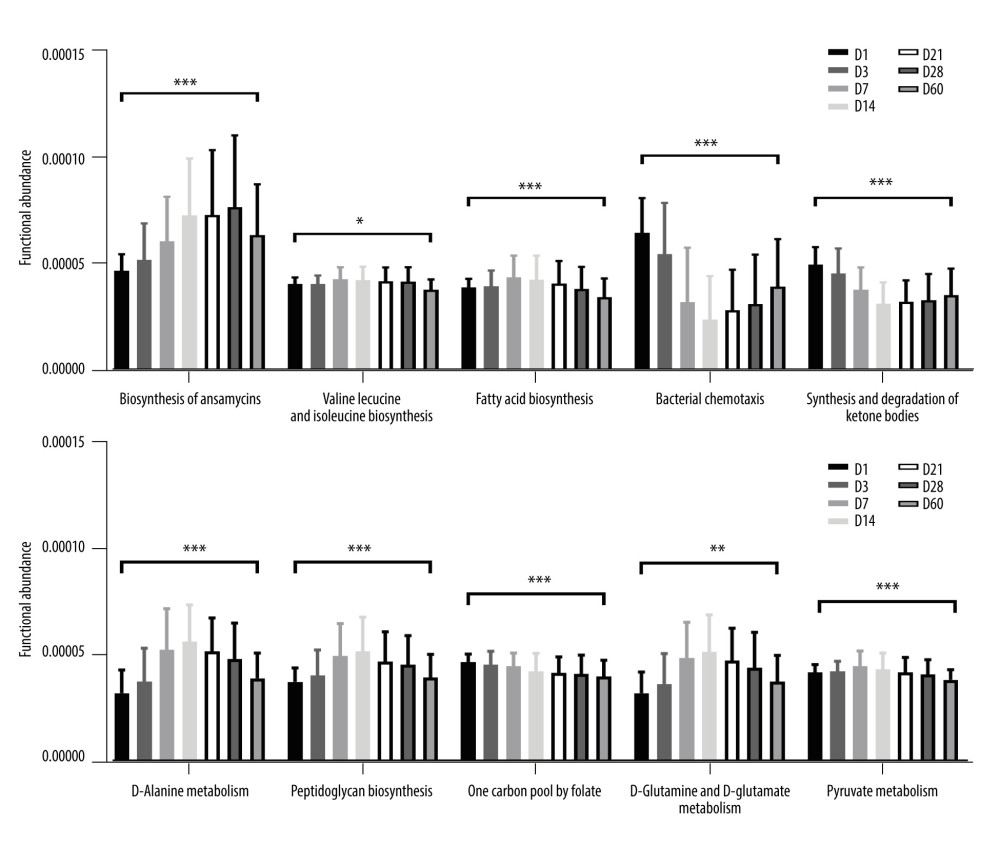 Figure 6. Predictive function analysis of the top 10 pathways ranked in relative abundance among KEGG pathways with differences at 7 time points. (GraphPad Prism8.0 software). * P<0.05, ** P<0.01, *** P<0.001.
 References
1. Sender R, Fuchs S, Milo R, Revised estimates for the number of human and bacteria cells in the body: PLoS Biology, 2016; 14(8); e1002533
2. Ignacio L, Alfaleh K, Feeding intolerance in preterm infants fed with powdered or liquid formula: A randomized controlled, double-blind pilot study: J Clin Neonatol, 2013; 2(1); 11-13
3. Ficara M, Pietrella E, Spada C, Changes of intestinal microbiota in early life: J Matern Fetal Neonatal Med, 2020; 33(6); 1036-43
4. La Rosa PS, Warner BB, Zhou Y, Patterned progression of bacterial populations in the premature infant gut: Proc Natl Acad Sci USA, 2014; 111(34); 12522-27
5. Luczynski P, Tramullas M, Viola M, Microbiota regulates visceral pain in the mouse: Elife, 2017; 6; e25887
6. Pickard JM, Maurice CF, Kinnebrew MA, Rapid fucosylation of intestinal epithelium sustains host-commensal symbiosis in sickness: Nature, 2014; 514(7524); 638-41
7. Tao YDY, Youcun Q, Regulation and effect of intestinal flora on immune response, 2019; 03 198-99-200-01-02
8. Valeria D, Argenio D, Argenio V, The prenatal microbiome: a new player for human health: High Throughput, 2018; 7(4); 38
9. Rautava S, Luoto R, Salminen SEE, Microbial contact during pregnancy, intestinal colonization and human disease: Nat Rev Gastroenterol Hepatol, 2012(10); 565-76
10. Chernikova DA, Madan JC, Housman ML, The premature infant gut microbiome during the first 6 weeks of life differs based on gestational maturity at birth: Pediatr Res, 2018; 84(1); 71-79
11. Terhi T, Niko P, Tejesvi MV, Maternal influence on the fetal microbiome in a population-based study of the first-pass meconium: Pediatr Res, 2018(3); 371-79
12. Zhang J, Dai Y, Fan S, Association between extrauterine growth restriction and changes of intestinal flora in Chinese preterm infants: J Dev Orig Health Dis; 10(5); 513-21
13. Forsgren M, Isolauri E, Salminen S, Rautava S, Late preterm birth has direct and indirect effects on infant gut microbiota development during the first six months of life: Acta Paediatr, 2017; 106(7); 1103-9
14. Chi C, Xue Y, Lv N, Longitudinal gut bacterial colonization and its influencing factors of low birth weight infants during the first 3 months of life: Front Microbiol, 2019; 10; 1105
15. Blakstad EW, Korpela K, Lee S, Enhanced nutrient supply and intestinal microbiota development in very low birth weight infants: Pediatr Res, 2019; 86(3); 323-32
16. Verma RP, Kota A, Fogel J, Immediate postnatal microbial colonization in sick term neonates admitted to NICU: Prevalence, microbiota, and associated characteristics: Am J Perinatol, 2023; 40(4); 438-44
17. Brooks B, Olm MR, Firek BA, The developing premature infant gut microbiome is a major factor shaping the microbiome of neonatal intensive care unit rooms: Microbiome, 2018; 6(1); 112
18. Neu J, The microbiome during pregnancy and early postnatal life: Semin Fetal Neonatal Med, 2016; 21(6); 373-79
19. Gosalbes M, Llop S, Vallès Y, Meconium microbiota types dominated by lactic acid or enteric bacteria are differentially associated with maternal eczema and respiratory problems in infants: Clin Exp Allergy, 2013; 43(2); 198-211
20. Xiao SQXMS, Hong MY: Practice of neonatology, 2011; 1011, Beijing, People’s Health Publishing House
21. Hu Y, Jiang Z, Shen K, Shen Y: Zhufutang practical pediatrics, 2015; 1512, People’s Health Publishing House
22. Neumann CJ, Mahnert A, Kumpitsch C, Clinical NEC prevention practices drive different microbiome profiles and functional responses in the preterm intestine: Nat Commun, 2023; 14(1); 1349
23. de Almeida VO, Pereira RA, Amantéa SL, Neonatal diseases and oxidative stress in premature infants: An integrative review: J Pediatr (Rio J), 2022; 98(5); 455-62
24. Patel AL, Mutlu EA, Sun Y, Longitudinal survey of microbiota in hospitalized preterm very-low-birth-weight infants: J Pediatr Gastroenterol Nutr, 2016; 62(2); 292-303
25. D’Agata AL, Wu J, Welandawe MKV, Effects of early life NICU stress on the developing gut microbiome: Dev Psychobiol, 2019; 61(5); 650-60
26. Chen C, Yin Q, Wu H, Bifidobacterium longum Subspecies infantis: Front Microbiol, 2019; 10; 3020
27. Barrett E, Kerr C, Murphy K, The individual-specific and diverse nature of the preterm infant microbiota: Arch Dis Child Fetal Neonatal Ed, 2013; 98(4); F334-40
28. Arbleya S, Binetti A, Salazar N, Establishment and development of intestinal microbiota in preterm neonates: FEMS Microbiol Ecol, 2012(3); 763-72
29. Heisel T, Nyaribo L, Sadowsky MJ, Gale CA, Breastmilk and NICU surfaces are potential sources of fungi for infant mycobiomes: Fungal Genet Biol, 2019; 128; 29-35
30. Brooks B, Firek BA, Miller CS, Microbes in the neonatal Intensive Care Unit resemble those found in the gut of premature infants: Microbiome, 2014; 2(1); 1
31. Dao TT, Liebenthal D, Tran TK: PLoS One, 2014; 9(3); e91999
32. Chichlowski M, Shah N, Wampler JL, Bifidobacterium longum Subspecies infantis (B. infantis) in pediatric nutrition: Current state of knowledge: Nutrients, 2020; 12(6); 1581
33. Paczosa MK, Mecsas J: Microbiol Mol Biol Rev, 2016; 80(3); 629-61
34. Zhang L-L, Miao J-J, Li MColonization and development of intestinal bifidobacteria in early infancy: hongguo Dang Dai Er Ke Za Zhi, 2015; 17(3); 207-12 [in Chinese]
35. Levis ZT, Mills DA, Differential establishment of bifidobacteria in the breastfed infant gut: Nestle Nutr Inst Workshop Ser, 2017; 88; 149-59
36. Yu Y, Qiu X, Effects of β-lactam antibiotics on neonatal intestinal microecology: International Medical and Health Review, 2006; 19(19); 60-61
37. Chen X, Shi Y, Determinants of microbial colonization in the premature gut: Mol Med, 2023; 29(1); 90
38. Fan W, Huo G, Li X, Diversity of the intestinal microbiota in different patterns of feeding infants by illumina high-throughput sequencing: World J Microbiol Biotechnol, 2013; 29(12); 2365-72
39. Liu Y, Qin S, Ma JDistribution characteristics of intestinal flora in infants under different delivery and feeding patterns: Chinese Journal of Perinatal Medicine, 2018; 7; 565-71 [in Chinese]
40. Qi LW, CL , The relationship between three major ketoacids and four major types of substance metabolism: Chemistry of Life, 2019; 39(3); 616-22
41. Gorbacheva IV, Kuznetsova OU, Gilmiyarova FN, Characteristics of the metabolic status of children of the first year of life with protein-energy deficiency depending on the gestational age at birth: Klin Lab Diagn, 2020; 65(7); 405-10
42. Ye CX, Chen SB, Wang TT, Risk factors for preterm birth: A prospective cohort study: Zhongguo Dang Dai Er Ke Za Zhi, 2021; 23(12); 1242-49
43. Wisnowski JL, Blüml S, Paquette L, Altered glutamatergic metabolism associated with punctate white matter lesions in preterm infants: PLoS One, 2013; 8(2); e56880
44. Mauro AK, Rengarajan A, Albright C, Boeldt DS, Fatty acids in normal and pathological pregnancies: Mol Cell Endocrinol, 2022; 539; 111466
45. Röhrig F, Schulze A, The multifaceted roles of fatty acid synthesis in cancer: Nat Rev Cancer, 2016(11); 732-49
46. Santoro K, Martin CR, Lipids and long chain polyunsaturated fatty acids in preterm infants: Clin Perinatol Jun, 2022; 49(2); 381-91
47. Kolb H, Kempf K, Röhling M, Ketone bodies: From enemy to friend and guardian angel: BMC Med, 2021; 19(1); 313
48. Lee CJ, Qiu TA, Sweedler JV, d-Alanine: Distribution, origin, physiological relevance, and implications in disease: Biochim Biophys Acta Proteins Proteom, 2020; 1868(11); 140482
Figures
Figure 1. Amplicon sequence variation (ASV) petal diagram (R-Studio v7.2).Figure 2. Box plots of alpha diversity indices at 7 time points. (A) Chao1 index. (B) Observed species index. (C) Shannon index. (D) Simpson index. *** P<0.001. (R-Studio v7.2 and GraphPad Prism8.0 software).Figure 3. 2D classification plot of samples for PCoA analysis between 7 time points. The horizontal and vertical axes represent the 2 selected principal axes, and the percentages represent the values of the principal axes explaining the differences in sample composition; the scales of the horizontal and vertical axes are relative distances with no real meaning. The circles represent 95% confidence intervals. The different colors or shapes of the points represent different groups of samples. The dots of different colors or shapes represent different groups of samples, and the closer the dots are to each other, the more similar the species composition of each sample is. (R-Studio v7.2).Figure 4. Histogram of the distribution of dominant intestinal bacteria in preterm infants. (A) Distribution of the top 5 phyla at different time points. (B) Distribution of the top10 genera at different time points. (GraphPad Prism8.0 software).Figure 5. Line graph of relative abundance of dominant intestinal bacteria in preterm infants over time. (A) Trend of the top 5 phyla over time. (B) Trend of the top10 genera over time. (C) Trend of Bifidobacterium over time. (GraphPad Prism8.0 software).Figure 6. Predictive function analysis of the top 10 pathways ranked in relative abundance among KEGG pathways with differences at 7 time points. (GraphPad Prism8.0 software). * P<0.05, ** P<0.01, *** P<0.001. Tables
 Table 1. Fecal sample number distribution table at different time points.
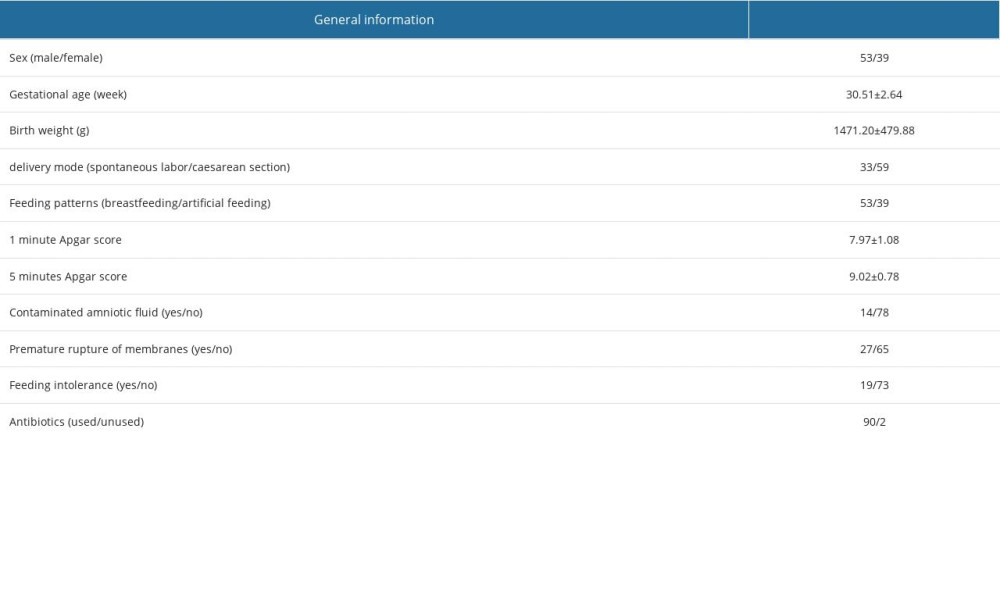 Table 2. General information of participants.
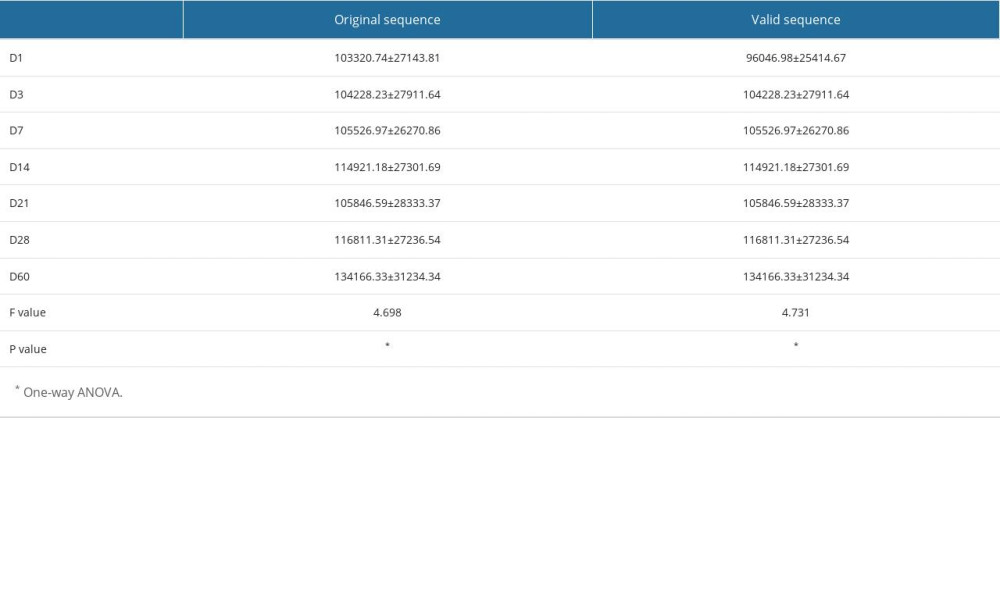 Table 3. Distribution of the mean number of sequences in the 7 groups.
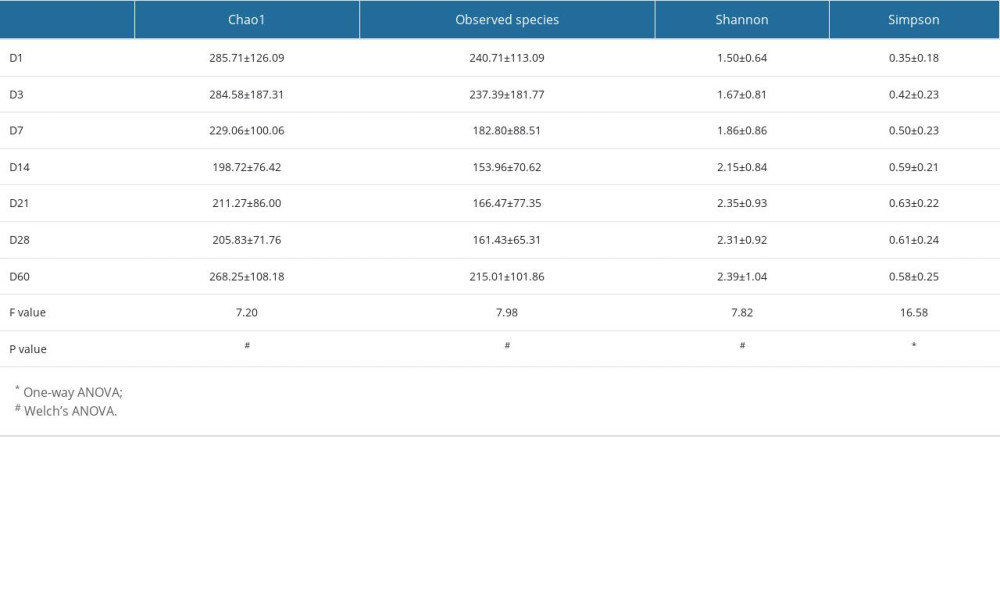 Table 4. Analysis of alpha diversity at different time points.Table 1. Fecal sample number distribution table at different time points.Table 2. General information of participants.Table 3. Distribution of the mean number of sequences in the 7 groups.Table 4. Analysis of alpha diversity at different time points.
 In Press
12 Mar 2024 : Database Analysis
Risk Factors of Age-Related Macular Degeneration in a Population-Based Study: Results from SHIP-TREND-1 (St...Med Sci Monit In Press; DOI: 10.12659/MSM.943140
12 Mar 2024 : Clinical Research
Preoperative Blood Transfusion Requirements for Hemorrhoidal Severe Anemia: A Retrospective Study of 128 Pa...Med Sci Monit In Press; DOI: 10.12659/MSM.943126
12 Mar 2024 : Clinical Research
Tissue Inhibitors of Metalloproteinase 1 (TIMP-1) and 3 (TIMP-3) as New Markers of Acute Kidney Injury Afte...Med Sci Monit In Press; DOI: 10.12659/MSM.943500
12 Mar 2024 : Review article
Optimizing Behçet Uveitis Management: A Review of Personalized Immunosuppressive StrategiesMed Sci Monit In Press; DOI: 10.12659/MSM.943240
Most Viewed Current Articles
17 Jan 2024 : Review article
Vaccination Guidelines for Pregnant Women: Addressing COVID-19 and the Omicron VariantDOI :10.12659/MSM.942799
Med Sci Monit 2024; 30:e942799
14 Dec 2022 : Clinical Research
Prevalence and Variability of Allergen-Specific Immunoglobulin E in Patients with Elevated Tryptase LevelsDOI :10.12659/MSM.937990
Med Sci Monit 2022; 28:e937990
16 May 2023 : Clinical Research
Electrophysiological Testing for an Auditory Processing Disorder and Reading Performance in 54 School Stude...DOI :10.12659/MSM.940387
Med Sci Monit 2023; 29:e940387
01 Jan 2022 : Editorial
Editorial: Current Status of Oral Antiviral Drug Treatments for SARS-CoV-2 Infection in Non-Hospitalized Pa...DOI :10.12659/MSM.935952
Med Sci Monit 2022; 28:e935952