04 December 2023: Review Articles
Clinical Application of Adaptive Optics Imaging in Diagnosis, Management, and Monitoring of Ophthalmological Diseases: A Narrative Review
Alina Szewczuk1BDEF*, Anna Zaleska-ŻmijewskaDOI: 10.12659/MSM.941926
Med Sci Monit 2023; 29:e941926


Abstract
ABSTRACT: Visualization of the retinal structure is crucial for understanding the pathophysiology of ophthalmic diseases, as well as for monitoring their course and treatment effects. Until recently, evaluation of the retina at the cellular level was only possible using histological methods, because the available retinal imaging technology had insufficient resolution due to aberrations caused by the optics of the eye. Adaptive optics (AO) technology improved the resolution of optical systems to 2 µm by correcting optical wave-front aberrations, thereby revolutionizing methods for studying eye structures in vivo. Within 25 years of its first application in ophthalmology, AO has been integrated into almost all existing retinal imaging devices, such as the fundus camera (FC), scanning laser ophthalmoscopy (SLO), and optical coherence tomography (OCT). Numerous studies have evaluated individual retinal structures, such as photoreceptors, blood vessels, nerve fibers, ganglion cells, lamina cribrosa, and trabeculum. AO technology has been applied in imaging structures in healthy eyes and in various ocular diseases. This article aims to review the roles of AO imaging in the diagnosis, management, and monitoring of age-related macular degeneration (AMD), diabetic retinopathy (DR), glaucoma, hypertensive retinopathy (HR), central serous chorioretinopathy (CSCR), and inherited retinal diseases (IRDs).
Keywords: Glaucoma, Hypertensive retinopathy, Photoreceptor Cells, Vertebrate, Retinal Diseases
Background
Retinal imaging is crucial for understanding physiological and pathological processes in the eye and monitoring disease progression and treatment effects. Until recently, evaluation of single retinal cells was only possible using histological techniques because the available retinal imaging techniques (such as scanning laser ophthalmoscopy [SLO] and optical coherence tomography [OCT]) had insufficient resolution to image structures at the cellular level, mainly due to aberrations caused by the optics of the eye. Generally, optical aberrations can be divided into 2 main groups: chromatic and monochromatic aberrations [1]. Differences in the refractive index of the eye structures for various wavelengths cause chromatic aberrations. It is possible to compensate for them using a single-wavelength light source [2]. Monochromatic aberrations are wavelength-independent and are caused by optical imperfections of eye structures, such as the tear film, cornea, and lens [1,2]. Monochromatic aberrations are classified into low-order and high-order aberrations [2]. The first can be corrected with spherical or cylindrical lenses, while high-order aberrations, also termed optical wave-front aberrations, cause parallel rays of light entering the eye to focus on different parts of the retina, greatly reducing lateral resolution and worsening the retinal image quality [1,2]. Adaptive optics (AO) technology has enhanced the performance of optical systems by correcting optical wave-front aberrations and has revolutionized methods of examining eye structures in vivo. Since its first use by Liang 20 years ago, AO technology has been applied to imaging structures in healthy eyes and various ocular diseases, allowing a better understanding of the etiology of ophthalmic diseases and accurate monitoring of their progression. This article aims to review the role of AO imaging in the diagnosis, management, and monitoring of age-related macular degeneration (AMD), diabetic retinopathy (DR), glaucoma, hypertensive retinopathy (HR), central serous chorioretinopathy (CSCR), and inherited retinal diseases (IRDs).
Methods of Adaptive Optical Imaging
AO was first used in astronomical telescopes to remove optical wave-front aberrations caused by atmospheric turbulence. This technology has improved the quality of images of distant astronomical objects. The history of the use of AO in ophthalmology is more than 20 years old – it was first used in 1997 by Liang to obtain high-quality retinal images [3]. The AO system consists of 3 basic elements – a wave-front sensor, a wave-front corrector, and a control system – which are used to identify the eye’s optical aberrations and then correct them [4]. A wave-front sensor measures the aberrations of the eye. There are many different wave-front sensors, but the Shack-Hartmann sensor (SHS) is the most commonly used type. It consists of lenslets, aiming to sample a local portion of the incident wave-front and focus collimated light onto an area detector [5]. A wave-front corrector compensates for the aberrations measured by the SHS. The most commonly used type of wave-front corrector is the deformable mirror, which works by changing the shape of the surface [4,5]. A series of electric actuators connected to the mirror deform its surface to modify the light beam and thus effectively remove optical distortion in real-time [2,4]. The control system aims to connect the first 2 elements: a wave-front sensor and a wave-front corrector [2].
AO alone does not create an image, so the AO system must be integrated into existing retinal imaging devices such as fundus cameras (FC), SLO, and OCT. The first device integrated with AO to visualize the photoreceptor mosaic was FC-AO-FC [3]. The AO-FC is also the first commercially available system – rtx1 (Imagine Eyes, Orsay, France). The rtx1 camera is characterized by high lateral resolution (1.6 microns) and fast image acquisition time (4 s), during which 40 individual images are taken [6]. Due to the short capture time, AO-FC images are minimally disturbed by eye movements [1,2]. Another advantage of AO-FC is its lower cost and better availability than AO-OCT and AO-SLO. Disadvantages of AO-FC include low axial image resolution and reduced contrast compared to other devices [1,2]. The advantage of AO-OCT is the high axial resolution (about 5 μm) compared to AO-FC (about 300 μm) and AO-SLO (about 100 μm), which enables 3D visualization of retinal structures [7]. In AO-SLO, the collimated laser light beam uses only the central 1 mm of the pupil aperture to image the eye’s structures, while the scattered light is back-focused on the focal point, resulting in increasing contrast and axial resolution [8]. The main advantages of AOSLO are its confocal configuration, allowing it to generate images of planes at different retinal depths, and its ability to integrate fluorescence and AF imaging with AO-SLO imaging [9]. Of particular interest is multimodal AO imaging; for example, the integration of OCT with the AO-SLO system to create an AO-SLO-OCT [10]. As mentioned above, AO enables non-invasive imaging of the retina at the microscopic level in vivo, allowing the analysis of individual structures such as photoreceptors (Figure 1), blood vessels (Figure 2), nerve fibers, ganglion cells, and the lamina cribrosa. The AO technique can improve lateral resolution to 2 μm providing information about the retinal structure that cannot be obtained with currently available in vivo methods [2]. The main photoreceptors parameters examined by AO imaging are cone density, spacing, reflectivity, and regularity [11,12]. For density estimation, the number of cones is divided by its area. In the case of cone spacing, the distances between adjacent cells are measured. As the cones are usually organized in a hexagonal lattice pattern, cone regularity is defined as the frequency of cones with exactly 6 adjacent cells. Reflectivity is defined as the mean intensity of the pixels corresponding to the cones [2]. To assess vascular morphology, the following parameters are measured: total vessel diameter (TD), lumen diameter (LD), and wall thickness (WT). Additional parameters are the wall-to-lumen ratio (WLR), defined as the ratio of the vessel WT to the LD, and the wall cross-sectional area (WCSA), describing the relationship between LD and TD [13]. The parameters used to assess lamina cribrosa (LC) include pore number, pore density and area, and pore ovality index [14]. In addition, using AO-OCT, it is possible to assess 3D LC parameters such as connective tissue volume fraction [15].
Diabetic Retinopathy
DR is a complication of diabetes mellitus (DM) and is the fifth leading cause of blindness worldwide [16]. DR consists of microangiopathy and neurodegenerative changes in retinal cells [17]. Assessing photoreceptors and vessels in diabetic patients is one of the main directions in AO imaging (Figure 3), although AO retinal imaging in patients with DM can be difficult due to diabetic complications such as difficulties with mydriasis, cataract, and vitreous hemorrhage [18]. Lombardo et al, using AO-FC, found a loss of cones in DM eyes compared with controls and decreased cones numbers in patients with glucose intolerance, high glycohemoglobin level, and signs of DR [19]. In other research, Lammer et al, using AOSLO, found that reduced regularity of the cone mosaic is correlated with increasing severity of DR and DME [20]. Cristescu et al, using AO-FC, showed similar results, demonstrating photoreceptor loss in DM 1 patients compared to the control group [21]. In contrast, Tan et al, using AO-FC, found that photoreceptors did not differ from the control group [22]. Cone parameters and retinal vessels were assessed by Zaleska-Zmijewska et al with the AO-FC in the course of DM. A significantly lower density of cones was observed in DR compared to the control group, as well as a decrease in density and regularity of cones as the severity of DR increased. Moreover, the artery walls were significantly thicker in the DR group compared to the control group [18]. In another study, Datlinger et al analyzed the density and morphology of photoreceptors in ischemic versus nonischemic retinal areas in the patients with DR. It was found that the areas affected by capillary non-perfusion showed severe changes in cone morphology and density compared to areas with intact capillary perfusion, and these structural changes were associated with a severe reduction in retinal sensitivity [23]. Lombardo et al found that average capillary LD in parafoveal areas was significantly narrower in eyes with nonproliferative DR (NPDR) than in the control group [24]. Ueno et al assessed the retinal vessels’ morphological parameters using AO-FC and retinal blood flow using laser speckle flowgraphy (LSFG) in patients with DM 2. The WLR was significantly higher in the proliferative DR (PDR) group than in all other groups. Furthermore, the retinal blood flow was correlated with WLR and was significantly lower in the PDR group than in the other groups [25]. Cristescu et al confirmed previous results. They assessed changes in the retinal microcirculation in patients with DM 1 and DM 2. The WLR in the eyes of diabetic patients in both groups was higher compared to the control group and there were no substantial differences between the DM1 and DM2 groups [26]. In another study, Palochak et al, using AO-SLO, showed that retinal blood flow and velocity in diabetic patients without DR were significantly higher than in the control group, and these parameters were significantly reduced in eyes with NPDR compared to the controls. The trends were similar for vessel density measured with OCTA. The researchers suggested that increased retinal blood flow and velocity can cause endothelial damage during the early stages of diabetes, resulting in reduced retinal blood flow later [27]. Using AOSLO, Tam et al assessed the characteristics of arteriovenous (AV) channels in DM2 patients without DR. The mean tortuosity of AV channels was 26% greater in DM2 patients compared to the control group, and it was suggested that the increased tortuosity of the AV channel in DM may result from a gradual loss of key capillary segments [28].
Age-Related Macular Degeneration
AMD is the leading cause of vision loss worldwide in people aged 60 years and older [29]. In this context, the benefits of identifying patients at increased risk of disease progression early is invaluable. By using AO, progression in drusen size can be determined, and its impact on the underlying retinal layers can be assessed [30]. Drusen is usually visible as poorly demarcated hyper-reflective patches and are therefore a challenge for AO imaging [30]. Rossi et al found that the contrast of drusen can be increased by capturing images from different gaze positions and combining them into a composite image using statistical operations [31]. The differences in reflectance between the drusen and reticular pseudodrusen can be assessed using AO [32]. Furthermore, the studies with the use of AO demonstrated the dynamism of drusen and pseudodrusen, showing new and regressive changes over time [33]. The researchers demonstrated an undisturbed photoreceptor mosaic for early drusen with normal regularity and cone density [34]. Boretsky et al, using AO-SLO, found increasing disruption of photoreceptors across the macula in direct relation to the progression of AMD [35]. Geographical atrophy (GA) has also been examined using AO. Changes in cone density in atrophic and adjacent regions with numerous hyporeflective clumps were revealed by Gocho using adaptive optics near-infrared reflectance (AO NIR) fundus imaging. These clumps may represent melanin-containing cells and are possible biomarkers of retinal pigment epithelium (RPE) damage [36]. Querques et al also examined AO features of functional photoreceptors of foveal sparing in eyes with GA. En-face AO images showed foveal sparing as well-demarcated regions of reduced reflectivity with fewer hyporeflective clumps compared to GA regions. [37]. Finally, AO has been used in clinical trials to assess the success of stem cell therapy in patients with exudative AMD and polypoidal choroidal vasculopathy (PCV) [38]. It should be noted that investigating wet AMD is still technically difficult due to the lack of retinal transparency [39].
Glaucoma
Glaucoma is the leading cause of irreversible blindness worldwide and is characterized by progressive dysfunction and loss of retinal ganglion cells (RGC) and their axons. Many studies have shown the use of AO in glaucoma [40–50]. In their study using AO-SLO, Takayama et al examined pathological changes in the retinal nerve fiber layer (RNFL) in eyes with glaucoma, finding a decrease in the width of the nerve fiber bundles in both clinically normal and abnormal regions of the retina. These abnormalities were correlated with the loss of visual field [40]. Hasegawa et al demonstrated the expansion of individual retinal nerve fiber (RNF) bundle narrowing in eyes with glaucoma [41]. Chen et al used AO to compare the pattern of RNF bundles in retinal regions with normal (WN) and abnormal (AB) RNFL thickness on OCT images [42]. A few studies have investigated the effects of glaucoma on photoreceptors, but the results are contradictory. Choi et al demonstrated structural changes in cone photoreceptors at the retinal locations with reduced visual sensitivity with AO images. In these locations, AO-FC en-face images showed dark areas in the cone mosaic, while AO-OCT showed shortening of the cone outer segments (OS) [43]. Structural changes in the cone mosaic have also been shown in patients with optic neuropathies and glaucoma-like VF defects [44], but Hasegawa et al found no difference in either density or spatial organization of cones in glaucomatous eyes [45]. Several studies have assessed the morphology of lamina cribrosa in glaucoma eyes. In rhesus monkeys, Vilupuru et al demonstrated greater area and elongation of LC pores in the eye with experimental glaucoma than in its healthy fellow [46]. These findings were confirmed by Akagi et al, showing significantly larger pore areas in glaucomatous eyes than in normal ones, which was significantly correlated with higher IOP [47]. Zwillinger, in turn, revealed elongated LC pores not only in primary open-angle glaucoma (POAG) eyes, but also in healthy eyes of POAG relatives [48]. Another application of AO was presented by King et al by combining AOSLO with a gonioscopic lens for trabecular meshwork imaging [49]. Finally, morphological analysis of the peripapillary microcirculation in glaucoma was assessed using AO-FC by Hugo et al, who found narrowing of the arterial LD without any change in the WT, which may suggest that the vasospastic mechanism is associated with POAG [50].
Hypertensive Retinopathy
HR is the most common ophthalmologic complication of hypertension [51]. Recently, OCT and angio OCT have also been frequently used to evaluate vasculature in patients with HR. With AO it became possible to assess vascular remodelling in HR at the microscopic level (Figure 4). Metha et al, using AO-FC, observed a significant increase in retinal arteriolar WLR and WCSA in a hypertensive group compared to the control group, and they suggested that AO enables distinguishing between 2 types of vessel wall remodelling in HR: eutrophic and hypertrophic [52]. Rosenbaum et al found that lowering blood pressure increased arterial LD without changes in WT, while chronic antihypertensive treatment led to normalization of remodelling [53]. The correlation of WLR with hypertension and microvascular abnormalities has been confirmed by other studies [54–57]. Gallo et al investigated whether retinal arteriolar WLR and LD parameters can distinguish hypertensive from healthy subjects [58], and they also assessed vascular parameters in people with masked arterial hypertension (MAH), finding that AO analysis could help diagnose hypertension, particularly in cases of MAH [58]. In addition, a case report presenting the application of AO-SLO in a patient with malignant hypertension has been published [59].
Central Serous Chorioretinopathy
CSCR is a common type of maculopathy, with multiple causes, including hyperperfusion and hyperpermeability of the choroid vasculature [60]. Ochinciuci et al, using AO-FC, showed that photoreceptor density was significantly reduced in eyes with CSCR compared to healthy eyes [60]. Ooto et al, using AO-SLO, revealed abnormal cone mosaic and reduced cone density in eyes with resolved CSCR, and these abnormalities were correlated with decreased VA [61]. Meirelles et al, using AO, showed changes in the photoreceptors mosaic in the eye after CSCR resolution, suggesting that resolved CSCR may cause photoreceptor changes, even after clinical recovery [62]. Gerardy et al examined cone mosaic in the asymptomatic fellow eye in patients with unilateral CSCR, showing reduced cone density in the fovea, suggesting that photoreceptors may be affected independently of the development of CSCR [63]. Vienola et al, using AO-SLO, revealed hyperautofluorescent punctate patches in patients with CSCR, which may correspond to the accumulation of fluorophores within macrophages from RPE and photoreceptors during the active stage of the disease [64].
Inflammatory Diseases
Retinal vasculitis is characterized by inflammation of the retinal vessels [65]. Inflammatory changes in the retinal vessels can be assessed by AF, indocyanine angiography, and angio OCT [66]. In vivo visualization of inflammatory changes in the vessels using AO can be a valuable diagnostic tool. AO technology enabled visualization of vessel sheeting in patients with confirmed autoimmune diseases and made it possible to monitor changes over time, such as the decrease and resolution of sheathings. The AO findings were correlated with the results of fundus photography and AF [66]. These findings were confirmed by Errera et al in a study using AO in patients with retinal vasculitis in the course of Lyme disease and presumed tuberculosis [67]. They observed increased vein diameter and thinning of the perivenous sheathing during treatment on subsequent follow-ups [68]. In addition to vascular changes in inflammatory diseases, abnormalities in the outer retina and RPE also occur [69]. Biggee et al demonstrated alterations of the parafoveal cone mosaic in eyes with posterior uveitis. In addition, after starting therapy, AO showed an improvement in cone density in the parafoveal region [69]. Photoreceptor abnormalities were also confirmed by other studies, such as those evaluating photoreceptor mosaic in idiopathic multifocal choroiditis [70], acute posterior placental syphilitic chorioretinopathy (ASPPC) [71], Behçet’s disease (BD) [72], and white dot syndrome [73].
Inherited Retinal Diseases (IRD)
IRD is a group of clinically and genetically heterogeneous conditions characterized by retinal dysfunction that can be stationary or progressive and even lead to visual loss [74]. AO imaging is an important tool in studying the pathogenesis and progression of IRD, allowing high-resolution characterization of the retinal cellular structure (Figure 5) such as phenotyping of hereditary retinal diseases and correlation of the findings with specific genetic mutations, which are essential for better selection of patients for new therapies (including stem cells and gene modification therapies) and better control of treatment outcomes [75,76]. Examples of studies in which IRD were assessed using AO are shown in Table 1.
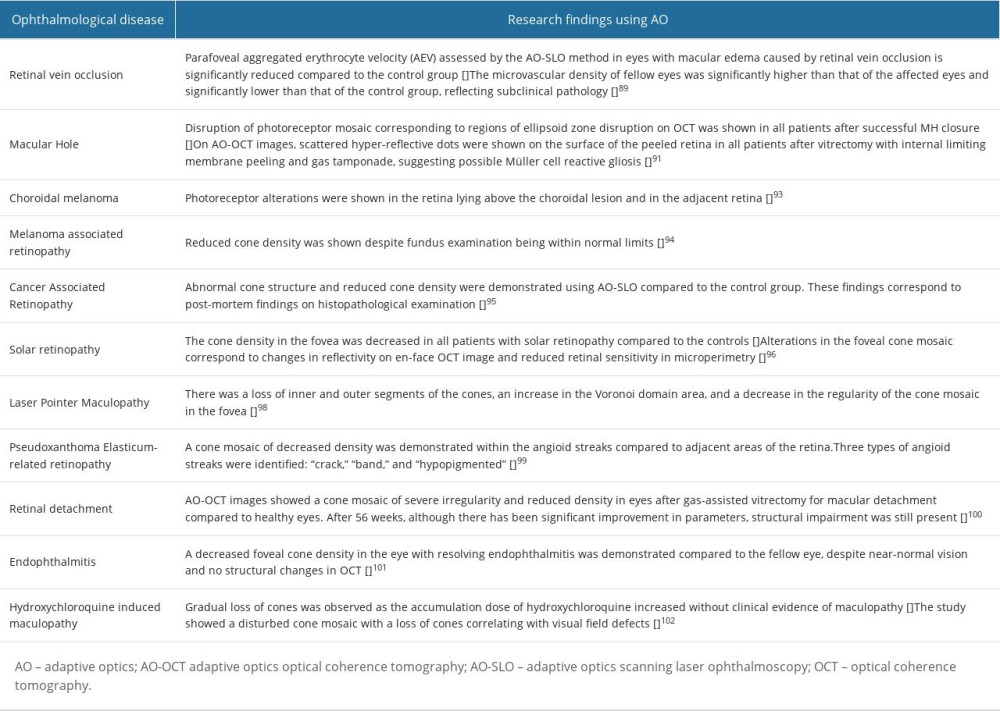
Other Pathologies
AO technology has found application in many other ophthalmic diseases [89–103]. Examples of diseases studied with AO are shown in Table 2.
Future Developments
Despite the numerous studies using AO described in this article, AO technology is not yet widely used in clinical practice. For widespread use of AO in everyday practice, it is necessary to standardize measurement parameters, terminology, and proper validation of AO devices. The development of normative databases is also crucial to popularize AO in clinical ophthalmology [104]. The large size of AO equipment, as well as its high cost and difficulties in operation, cause many inconveniences in clinical applications. The development of AO hardware and software in the future may overcome these problems [105–107]. The most important directions for the development of AO are the miniaturization of AO hardware, lowering production costs, and developing user-friendly software, which will contribute to better AO availability. Further improvements in the resolution of AO imaging, as well as the combination of different methods and the development of multimodal AO systems, will improve imaging and analysis of eye structures [108]. Finally, artificial intelligence is expected to play an increasingly important role in analyzing images and interpreting results obtained with AO [109].
Conclusions
AO technology offers the possibility to assess lesions at a microscopic level, previously only available on post-mortem histological examination. This enables early disease detection at clinically asymptomatic stages and provides more effective monitoring of disease progression and treatment outcomes. In addition, AO provides the opportunity to improve our understanding of the pathogenesis of ophthalmic diseases.
Figures
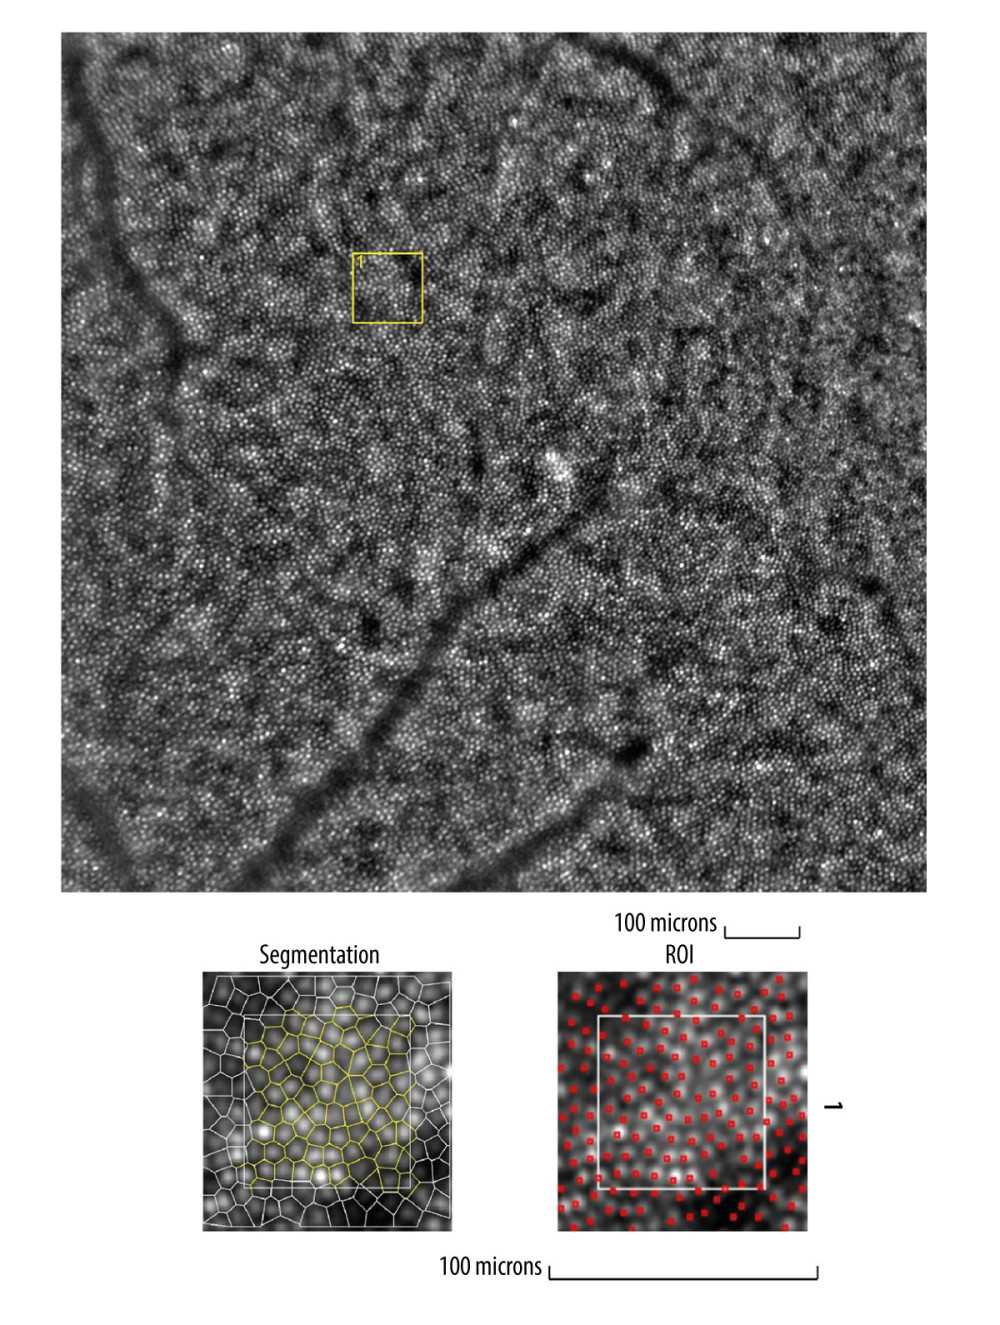 Figure 1. Image of normal cone mosaicImage of normal cone mosaic in a healthy volunteer obtained with adaptive optics camera 4°×4° degree square (Rtx-1, Imagine Eyes, Orsay, France). The analysis was performed at superior 2° from the fovea (top). The region of interest (ROI) (yellow square in the top image) was used for automated cone segmentation (bottom left) and detection (bottom right) using dedicated software. Red squares correspond to automatically identified cones (bottom right). The image is from the author’s collection.
 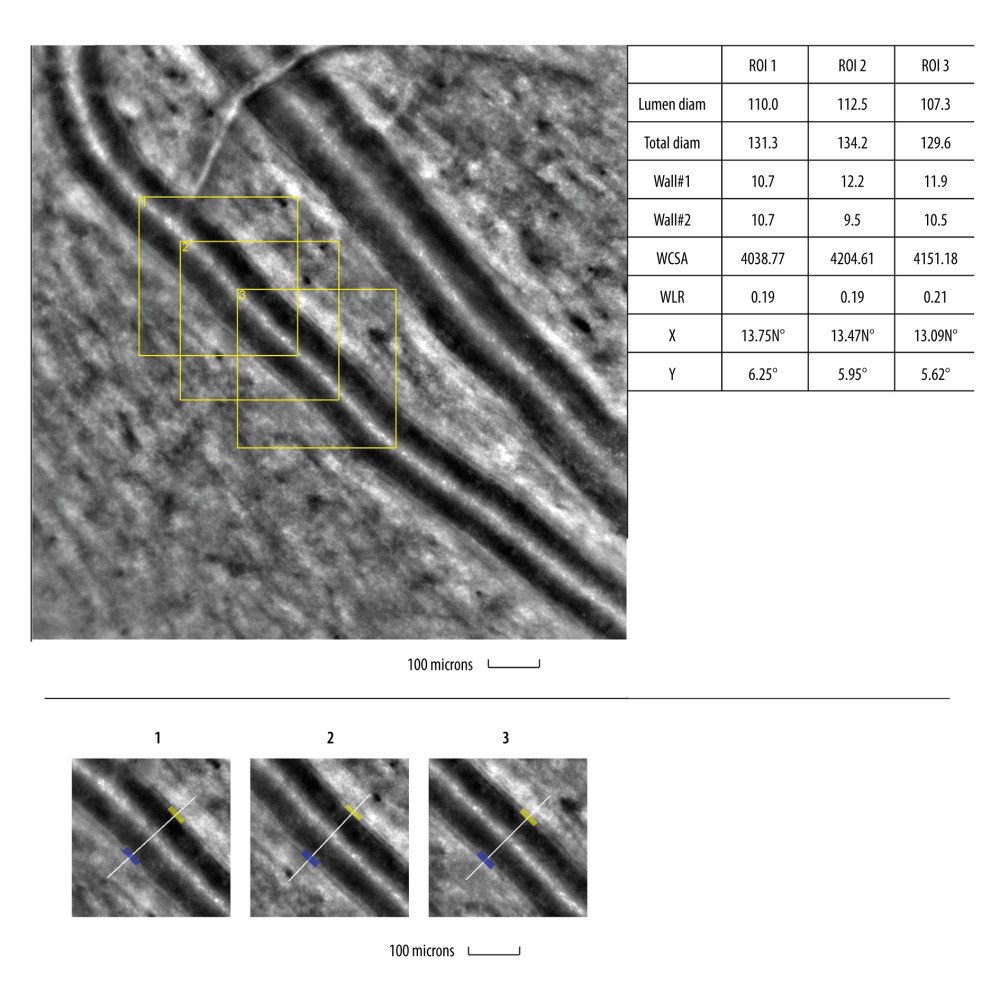 Figure 2. Image of normal retinal arteriole and venuleEvaluation of retinal arteriolar morphology in a healthy volunteer with adaptive optics camera 4°×4° degree square (Rtx-1, Imagine Eyes, Orsay, France) and measurement of morphological parameters using AOdetect software (top). The parameters calculated from the 3 selected regions of interest, for each time landmark (100 μm width and height each) (bottom). The image is from the author’s collection.
 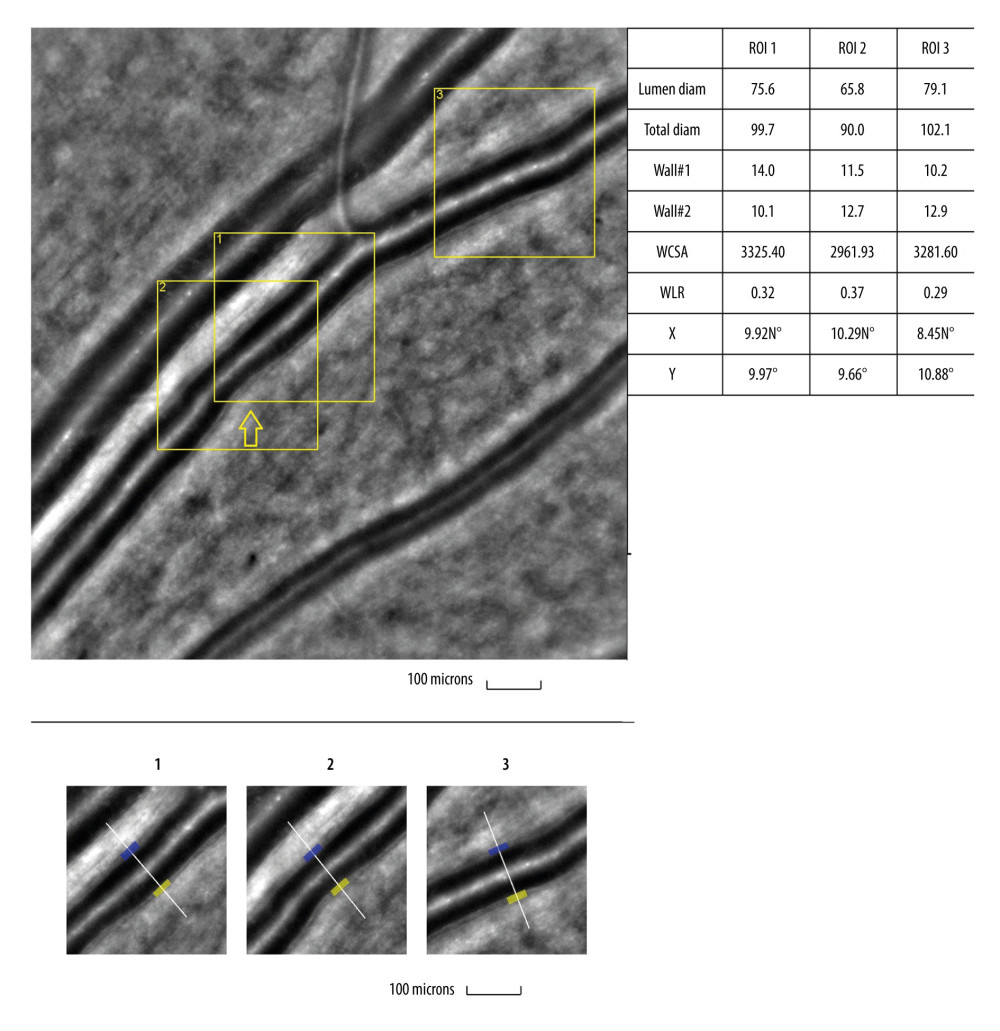 Figure 3. Image of retinal vessels in a patient with diabetes mellitus type 2Evaluation of retinal arteriolar morphology in a patient with diabetes mellitus type 2 with adaptive optics camera 4°×4° degree square (Rtx-1, Imagine Eyes, Orsay, France) and measurement of morphological parameters using AOdetect software. Retinal artery with focal luminal narrowing (yellow arrow) and increased wall-to-lumen ratio (WLR 0,33; 0,37; 0,29) (top). The parameters calculated from the 3 selected regions of interest, for each time landmark (100 μm width and height each) (bottom). The image is from the author’s collection
 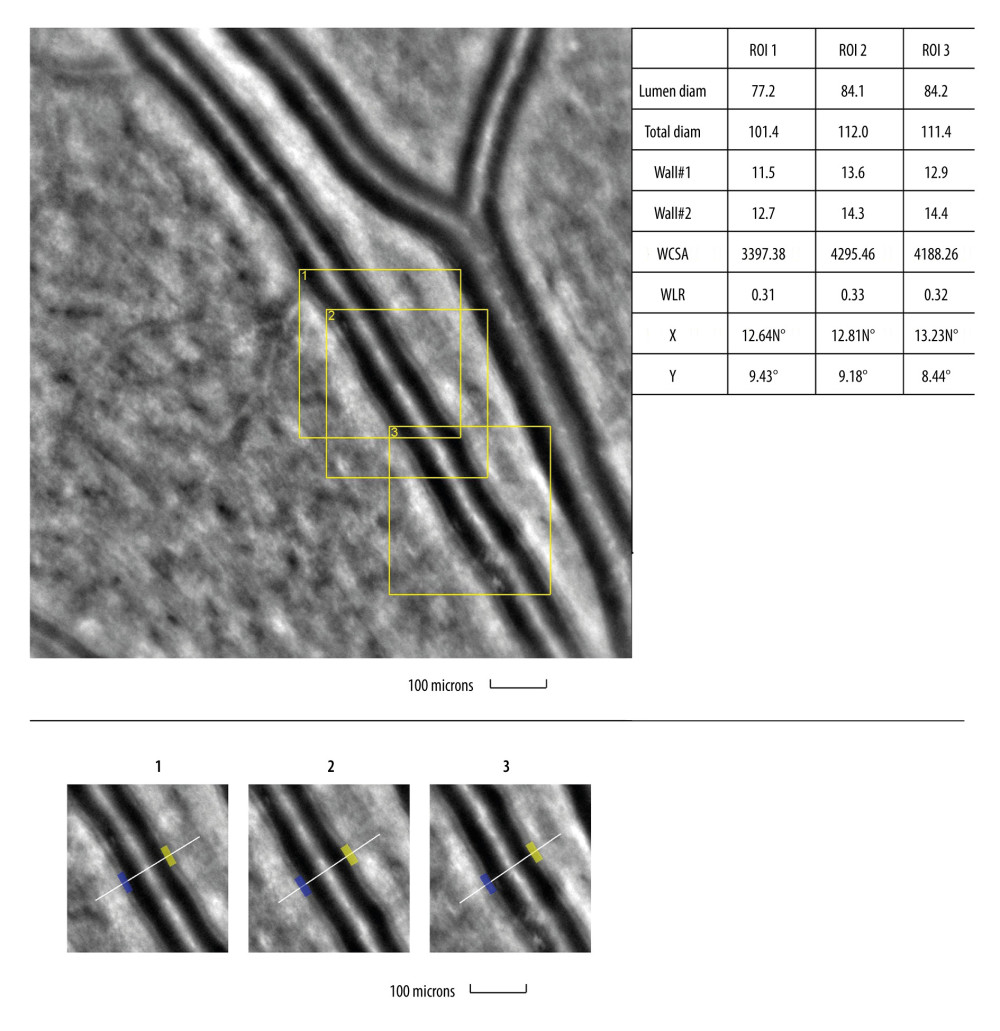 Figure 4. Image of retinal vessels in a patient with hypertensive retinopathyEvaluation of retinal arteriolar morphology in a patient with hypertensive retinopathy with adaptive optics camera 4°×4° degree square (Rtx-1, Imagine Eyes, Orsay, France) and measurement of morphological parameters using AOdetect software. Retinal artery with increased wall-to-lumen ratio (WLR 0,31; 0,33; 0,32) (top). The parameters calculated from the 3 selected regions of interest, for each time landmark (100 μm width and height each) (bottom). The image is from the author’s collection.
 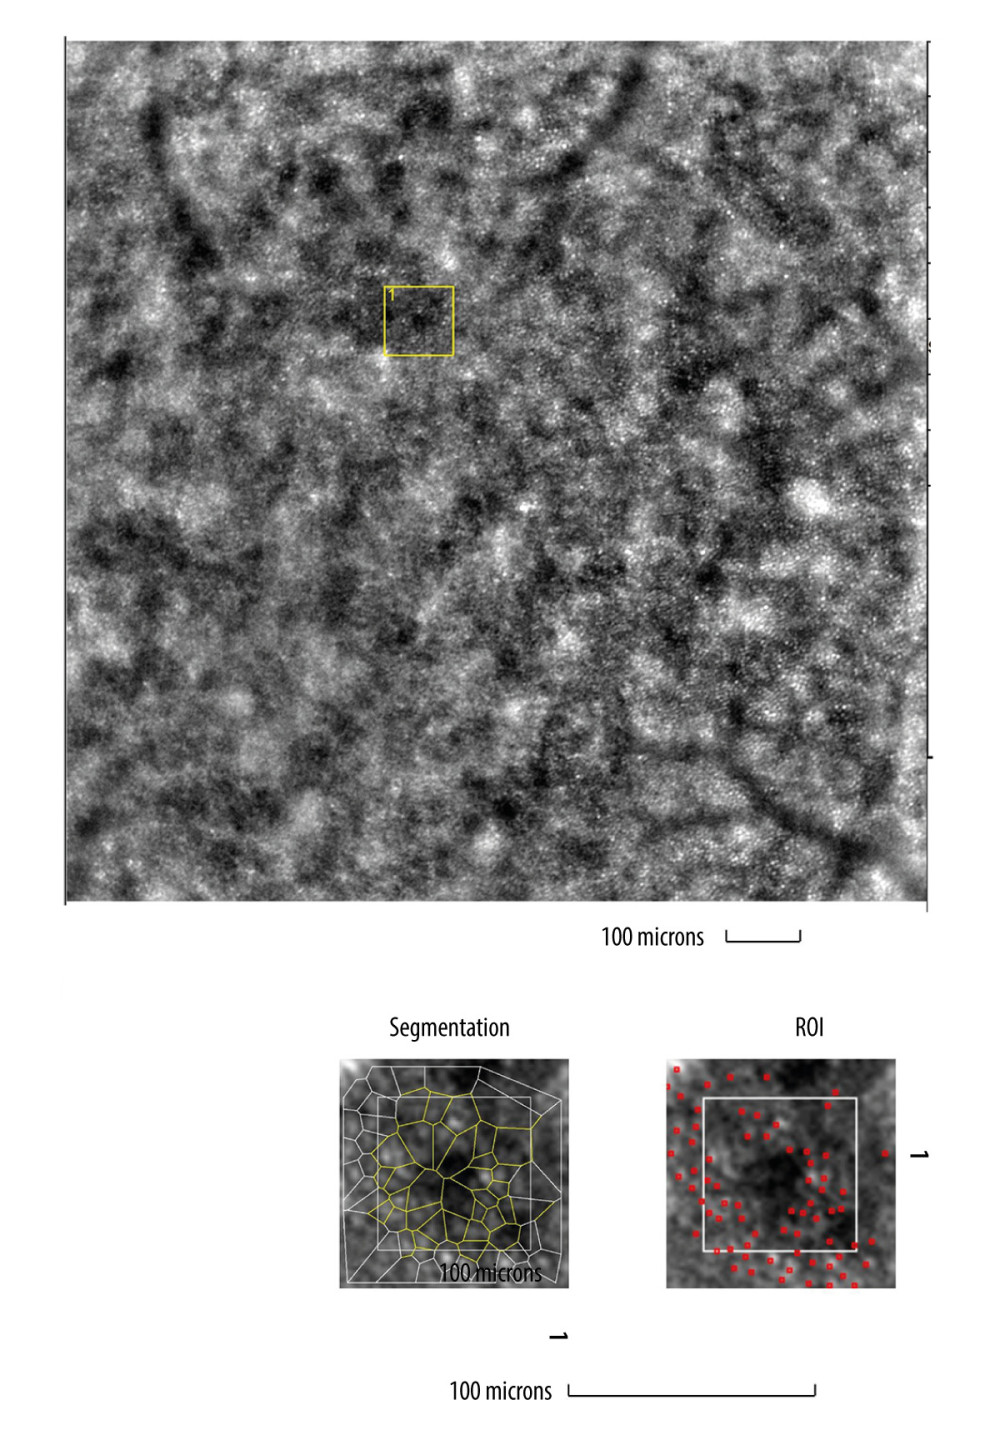 Figure 5. Image of cone mosaic in a patient with cone-rod dystrophyImage of cone mosaic in a patient with cone-rod dystrophy obtained with adaptive optics camera 4°×4° degree square (Rtx-1, Imagine Eyes, Orsay, France). The analysis was performed at superior 2° from the fovea. Empty spaces at the photoreceptor level and a disrupted mosaic of photoreceptors are demonstrated (top). The region of interest (ROI) (yellow square in the top image) was used for automated cone segmentation (bottom right) and detection (bottom left) using dedicated software. Red squares correspond to automatically identified cones (bottom right). Low density of the cones and the defect in the cones is demonstrated (bottom). The image is from the author’s collection.
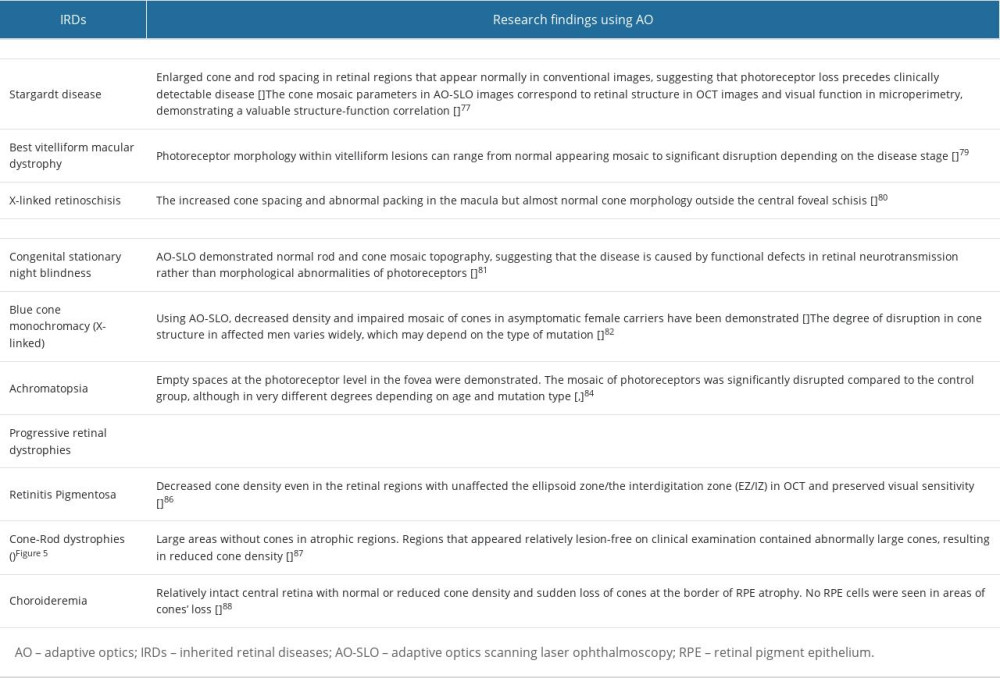
References
1. Burns SA, Elsner AE, Sapoznik KA, Adaptive optics imaging of the human retina: Prog Retin Eye Res, 2019; 68; 1-30
2. Akyol E, Hagag AM, Sivaprasad S, Adaptive optics: Principles and applications in ophthalmology [published correction appears in Eye (Lond). 2021;35(6): 1796]: Eye (Lond), 2021; 35(1); 244-64
3. Liang J, Williams DR, Miller DT, Supernormal vision and high-resolution retinal imaging through adaptive optics: J Opt Soc Am A Opt Image Sci Vis, 1997; 14(11); 2884-92
4. Lombardo M, Serrao S, Devaney N, Adaptive optics technology for high-resolution retinal imaging: Sensors (Basel), 2012; 13(1); 334-66
5. Hampson KM, Turcotte R, Miller DT, Adaptive optics for high-resolution imaging: Nat Rev Methods Primers, 2021; 1; 68
6. Ulińska M, Zaleska-Żmijewska A, Szaflik JThe new possibilities of the in vivo retinal imaging with the use of adaptive optics: Klinika Oczna/Acta Ophthalmologica Polonica, 2017; 119(1); 63-66 [in Polish]
7. Zhang B, Li N, Kang J, Adaptive optics scanning laser ophthalmoscopy in fundus imaging, a review and update: Int J Ophthalmol, 2017; 10(11); 1751-58
8. Mohankumar A, Gurnani B, Scanning laser ophthalmoscope: StatPearls February 20, 2023, Treasure Island (FL), StatPearls Publishing
9. Merino D, Loza-Alvarez P, Adaptive optics scanning laser ophthalmoscope imaging: technology update: Clin Ophthalmol, 2016; 10; 743-55
10. Zhang P, Wahl DJ, Mocci J, Adaptive optics scanning laser ophthalmoscopy and optical coherence tomography (AO-SLO-OCT) system for in vivo mouse retina imaging: Biomed Opt Express, 2022; 14(1); 299-314
11. Litts KM, Cooper RF, Duncan JL, Carroll J, Photoreceptor-based biomarkers in AOSLO retinal imaging: Invest Ophthalmol Vis Sci, 2017; 58(6); BIO255-BIO267
12. Cooper RF, Wilk MA, Tarima S, Carroll J, Evaluating descriptive metrics of the human cone mosaic: Invest Ophthalmol Vis Sci, 2016; 57(7); 2992-3001
13. Bakker E, Dikland FA, van Bakel R, Adaptive optics ophthalmoscopy: A systematic review of vascular biomarkers: Surv Ophthalmol, 2022; 67(2); 369-87
14. Ivers KM, Li C, Patel N, Reproducibility of measuring lamina cribrosa pore geometry in human and nonhuman primates with in vivo adaptive optics imaging: Invest Ophthalmol Vis Sci, 2011; 52(8); 5473-80
15. Nadler Z, Wang B, Schuman JS, In vivo three-dimensional characterization of the healthy human lamina cribrosa with adaptive optics spectral-domain optical coherence tomography: Invest Ophthalmol Vis Sci, 2014; 55(10); 6459-66
16. Magliano DJ, Boyko EJ: IDF Diabetes Atlas 10th edition Scientific Committee, 2021, Brussels, International Diabetes Federation
17. Kupis M, Samelska K, Zaleska-Żmijewska AIntroduction to pathophysiology of diabetic retinopathy: Klinika Oczna/Acta Ophthalmologica Polonica, 2021; 123(2); 69-73 [in Polish]
18. Zaleska-Żmijewska A, Wawrzyniak ZM, Dąbrowska A, Adaptive optics (rtx1) high-resolution imaging of photoreceptors and retinal arteries in patients with diabetic retinopathy: J Diabetes Res, 2019; 2019; 9548324
19. Lombardo M, Parravano M, Lombardo G, Adaptive optics imaging of parafoveal cones in type 1 diabetes: Retina, 2014; 34(3); 546-57
20. Lammer J, Prager SG, Cheney MC, Cone photoreceptor irregularity on adaptive optics scanning laser ophthalmoscopy correlates with severity of diabetic retinopathy and macular edema: Invest Ophthalmol Vis Sci, 2016; 57(15); 6624-32
21. Cristescu IE, Baltă F, Zăgrean L, Cone photoreceptor density in type I diabetic patients measured with an adaptive optics retinal camera: Rom J Ophthalmol, 2019; 63(2); 153-60
22. Tan W, Wright T, Rajendran D, Cone-photoreceptor density in adolescents with type 1 diabetes: Invest Ophthalmol Vis Sci, 2015; 56(11); 6339-43
23. Datlinger F, Wassermann L, Reumueller A, Assessment of detailed photoreceptor structure and retinal sensitivity in diabetic macular ischemia using adaptive optics-OCT and microperimetry: Invest Ophthalmol Vis Sci, 2021; 62(13); 1
24. Lombardo M, Parravano M, Serrao S, Analysis of retinal capillaries in patients with type 1 diabetes and nonproliferative diabetic retinopathy using adaptive optics imaging: Retina, 2013; 33(8); 1630-39
25. Ueno Y, Iwase T, Goto K, Association of changes of retinal vessels diameter with ocular blood flow in eyes with diabetic retinopathy: Sci Rep, 2021; 11(1); 4653
26. Cristescu IE, Zagrean L, Balta F, Retinal microcirculation investigation in type I and II diabetic patients without retinopathy using an adaptive optics retinal camera: Acta Endocrinol (Buchar), 2019; 15(4); 417-22
27. Palochak CMA, Lee HE, Song J, Retinal blood velocity and flow in early diabetes and diabetic retinopathy using adaptive optics scanning laser ophthalmoscopy: J Clin Med, 2019; 8(8); 1165
28. Tam J, Dhamdhere KP, Tiruveedhula P, Disruption of the retinal parafoveal capillary network in type 2 diabetes before the onset of diabetic retinopathy: Invest Ophthalmol Vis Sci, 2011; 52(12); 9257-66
29. United Nations: World Population Ageing 2019 Highlights, 2019, United Nations URL: https://digitallibrary.un.org/record/3846855
30. Zayit-Soudry S, Duncan JL, Syed R, Cone structure imaged with adaptive optics scanning laser ophthalmoscopy in eyes with nonneovascular age-related macular degeneration: Invest Ophthalmol Vis Sci, 2013; 54(12); 7498-509
31. Rossi EA, Norberg N, Eandi C, A new method for visualizing drusen and their progression in flood-illumination adaptive optics ophthalmoscopy. [published correction appears in Transl Vis Sci Technol. 2022;11(10):29]: Transl Vis Sci Technol, 2021; 10(14); 19
32. Querques G, Kamami-Levy C, Blanco-Garavito R, Appearance of medium-large drusen and reticular pseudodrusen on adaptive optics in age-related macular degeneration: Br J Ophthalmol, 2014; 98(11); 1522-27
33. Zhang Y, Wang X, Godara P, Dynamism of dot subretinal drusenoid deposits in age-related macular degeneration demonstrated with adaptive optics imaging: Retina, 2018; 38(1); 29-38
34. Godara P, Siebe C, Rha J, Assessing the photoreceptor mosaic over drusen using adaptive optics and SD-OCT: Ophthalmic Surg Lasers Imaging, 2010; 41(Suppl); S104-S108
35. Boretsky A, Khan F, Burnett G, In vivo imaging of photoreceptor disruption associated with age-related macular degeneration: A pilot study: Lasers Surg Med, 2012; 44(8); 603-10
36. Gocho K, Sarda V, Falah S, Adaptive optics imaging of geographic atrophy: Invest Ophthalmol Vis Sci, 2013; 54(5); 3673-80
37. Querques G, Kamami-Levy C, Georges A, Adaptive optics imaging of foveal sparing in geographic atrophy secondary to age-related macular degeneration: Retina, 2016; 36(2); 247-54
38. Takagi S, Mandai M, Gocho K, Evaluation of transplanted autologous induced pluripotent stem cell-derived retinal pigment epithelium in exudative age-related macular degeneration: Ophthalmol Retina, 2019; 3(10); 850-59
39. Paques M, Meimon S, Rossant F, Adaptive optics ophthalmoscopy: Application to age-related macular degeneration and vascular diseases: Prog Retin Eye Res, 2018; 66; 1-16
40. Takayama K, Ooto S, Hangai M, High-resolution imaging of retinal nerve fiber bundles in glaucoma using adaptive optics scanning laser ophthalmoscopy: Am J Ophthalmol, 2013; 155(5); 870-81
41. Hasegawa T, Ooto S, Akagi T, Expansion of retinal nerve fiber bundle narrowing in glaucoma: An adaptive optics scanning laser ophthalmoscopy study: Am J Ophthalmol Case Rep, 2020; 19; 100732
42. Chen MF, Chui TY, Alhadeff P, Adaptive optics imaging of healthy and abnormal regions of retinal nerve fiber bundles of patients with glaucoma: Invest Ophthalmol Vis Sci, 2015; 56(1); 674-81
43. Choi SS, Zawadzki RJ, Lim MC, Evidence of outer retinal changes in glaucoma patients as revealed by ultrahigh-resolution in vivo retinal imaging: Br J Ophthalmol, 2011; 95(1); 131-41
44. Choi SS, Zawadzki RJ, Keltner JL, Changes in cellular structures revealed by ultra-high resolution retinal imaging in optic neuropathies: Invest Ophthalmol Vis Sci, 2008; 49(5); 2103-19
45. Hasegawa T, Ooto S, Takayama K, Cone integrity in glaucoma: An adaptive-optics scanning laser ophthalmoscopy study: Am J Ophthalmol, 2016; 171; 53-66
46. Vilupuru AS, Rangaswamy NV, Frishman LJ, Adaptive optics scanning laser ophthalmoscopy for in vivo imaging of lamina cribrosa: J Opt Soc Am A Opt Image Sci Vis, 2007; 24(5); 1417-25
47. Akagi T, Hangai M, Takayama K, In vivo imaging of lamina cribrosa pores by adaptive optics scanning laser ophthalmoscopy: Invest Ophthalmol Vis Sci, 2012; 53(7); 4111-19
48. Zwillinger S, Paques M, Safran B, In vivo characterization of lamina cribrosa pore morphology in primary open-angle glaucoma: J Fr Ophtalmol, 2016; 39(3); 265-71
49. King BJ, Burns SA, Sapoznik KA, Adaptive optics imaging of the human trabecular meshwork in vivo: Transl Vis Sci Technol, 2019; 8(5); 5
50. Hugo J, Chavane F, Beylerian M, Morphologic analysis of peripapillary retinal arteriole using adaptive optics in primary open-angle glaucoma: J Glaucoma, 2020; 29(4); 271-75
51. Dziedziak J, Zaleska-Żmijewska A, Szaflik JP, Impact of arterial hypertension on the eye: A review of the pathogenesis, diagnostic methods, and treatment of hypertensive retinopathy: Med Sci Monit, 2022; 28; e935135
52. Mehta RA, Akkali MC, Jayadev C, Morphometric analysis of retinal arterioles in control and hypertensive population using adaptive optics imaging: Indian J Ophthalmol, 2019; 67(10); 1673-77
53. Rosenbaum D, Mattina A, Koch E, Effects of age, blood pressure and antihypertensive treatments on retinal arterioles remodeling assessed by adaptive optics: J Hypertens, 2016; 34(6); 1115-22
54. Arichika S, Uji A, Ooto S, Effects of age and blood pressure on the retinal arterial wall, analyzed using adaptive optics scanning laser ophthalmoscopy: Sci Rep, 2015; 5; 12283
55. Meixner E, Michelson G, Measurement of retinal wall-to-lumen ratio by adaptive optics retinal camera: A clinical research: Graefes Arch Clin Exp Ophthalmol, 2015; 253(11); 1985-95
56. Hillard JG, Gast TJ, Chui TY, Retinal arterioles in hypo-, normo-, and hypertensive subjects measured using adaptive optics: Transl Vis Sci Technol, 2016; 5(4); 16
57. Koch E, Rosenbaum D, Brolly A, Morphometric analysis of small arteries in the human retina using adaptive optics imaging: relationship with blood pressure and focal vascular changes: J Hypertens, 2014; 32(4); 890-98
58. Koch E, Rosenbaum D, Brolly A, Morphometric analysis of small arteries in the human retina using adaptive optics imaging: Relationship with blood pressure and focal vascular changes: J Hypertens, 2014; 32(4); 890-98
59. Arichika S, Uji A, Yoshimura N, Adaptive optics assisted visualization of thickened retinal arterial wall in a patient with controlled malignant hypertension: Clin Ophthalmol, 2014; 8; 2041-43
60. Ochinciuc R, Ochinciuc U, Stanca HT, Photoreceptor assessment in focal laser-treated central serous chorioretinopathy using adaptive optics and fundus autofluorescence: Medicine (Baltimore), 2020; 99(15); e19536
61. Ooto S, Hangai M, Sakamoto A, High-resolution imaging of resolved central serous chorioretinopathy using adaptive optics scanning laser ophthalmoscopy: Ophthalmology, 2010; 117(9); 1800-9e18092
62. Meirelles ALB, Rodrigues MW, Guirado AF, Photoreceptor assessment using adaptive optics in resolved central serous chorioretinopathy: Arq Bras Oftalmol, 2017; 80(3); 192-95
63. Gerardy M, Yesilirmak N, Legras R, Central serous chorioretinopathy: high-resolution imaging of asymptomatic fellow eyes using adaptive optics scanning laser ophthalmoscopy: Retina, 2022; 42(2); 375-80
64. Vienola KV, Lejoyeux R, Gofas-Salas E, Autofluorescent hyperreflective foci on infrared autofluorescence adaptive optics ophthalmoscopy in central serous chorioretinopathy: Am J Ophthalmol Case Rep, 2022; 28; 101741
65. Agarwal A, Rübsam A, Zur Bonsen L, A Comprehensive update on retinal vasculitis: etiologies, manifestations and treatments: J Clin Med, 2022; 11(9); 2525
66. Mahendradas P, Vala R, Kawali A, Adaptive optics imaging in retinal vasculitis: Ocul Immunol Inflamm, 2018; 26(5); 760-66
67. Errera MH, Laguarrigue M, Rossant F, High-resolution imaging of retinal vasculitis by flood illumination adaptive optics ophthalmoscopy: A follow-up study: Ocul Immunol Inflamm, 2020; 28(8); 1171-80
68. Errera MH, Laguarrigue M, Rossant F, High-resolution imaging of retinal vasculitis by flood illumination adaptive optics ophthalmoscopy: A follow-up study: Ocul Immunol Inflamm, 2020; 28(8); 1171-80
69. Biggee K, Gale MJ, Smith TB, Parafoveal cone abnormalities and recovery on adaptive optics in posterior uveitis: Am J Ophthalmol Case Rep, 2016; 1; 16-22
70. Amarasekera S, Williams AM, Freund KB, Multimodal imaging of multifocal choroiditis with adaptive optics ophthalmoscopy: Retin Cases Brief Rep, 2022; 16(6); 747-53
71. Giansanti F, Mercuri S, Vannozzi L, Adaptive optics imaging to analyze the photoreceptor layer reconstitution in acute syphilitic posterior placoid chorioretinopathy: Life (Basel), 2022; 12(9); 1361
72. Kadomoto S, Uji A, Arichika S, Macular cone abnormalities in Behçet’s disease detected by adaptive optics scanning light ophthalmoscope: Ophthalmic Surg Lasers Imaging Retina, 2021; 52(4); 218-25
73. Agarwal A, Soliman MK, Hanout M, Adaptive optics imaging of retinal photoreceptors overlying lesions in white dot syndrome and its functional correlation: Am J Ophthalmol, 2015; 160(4); 806-16e2
74. Daich Varela M, Esener B, Hashem SA, Structural evaluation in inherited retinal diseases: Br J Ophthalmol, 2021; 105(12); 1623-31
75. Georgiou M, Kalitzeos A, Patterson EJ, Adaptive optics imaging of inherited retinal diseases: Br J Ophthalmol, 2018; 102(8); 1028-35
76. Gill JS, Moosajee M, Dubis AM, Cellular imaging of inherited retinal diseases using adaptive optics: Eye (Lond), 2019; 33(11); 1683-98
77. Song H, Rossi EA, Latchney L, Cone and rod loss in Stargardt disease revealed by adaptive optics scanning light ophthalmoscopy: JAMA Ophthalmol, 2015; 133(10); 1198-203
78. Razeen MM, Cooper RF, Langlo CS, Correlating photoreceptor mosaic structure to clinical findings in stargardt disease: Transl Vis Sci Technol, 2016; 5(2); 6
79. Scoles D, Sulai YN, Cooper RF, Photoreceptor inner segment morphology in best vitelliform macular dystrophy: Retina, 2017; 37(4); 741-48
80. Duncan JL, Ratnam K, Birch DG, Abnormal cone structure in foveal schisis cavities in X-linked retinoschisis from mutations in exon 6 of the RS1 gene: Invest Ophthalmol Vis Sci, 2011; 52(13); 9614-23
81. Godara P, Cooper RF, Sergouniotis PI, Assessing retinal structure in complete congenital stationary night blindness and Oguchi disease: Am J Ophthalmol, 2012; 154(6); 987-1001e1
82. Carroll J, Rossi EA, Porter J, Deletion of the X-linked opsin gene array locus control region (LCR) results in disruption of the cone mosaic: Vision Res, 2010; 50(19); 1989-99
83. Carroll J, Dubra A, Gardner JC, The effect of cone opsin mutations on retinal structure and the integrity of the photoreceptor mosaic: Invest Ophthalmol Vis Sci, 2012; 53(13); 8006-15
84. Genead MA, Fishman GA, Rha J, Photoreceptor structure and function in patients with congenital achromatopsia: Invest Ophthalmol Vis Sci, 2011; 52(10); 7298-308
85. Georgiou M, Singh N, Kane T, Photoreceptor structure in GNAT2-associated achromatopsia: Invest Ophthalmol Vis Sci, 2020; 61(3); 40
86. Nakatake S, Murakami Y, Funatsu J, Early detection of cone photoreceptor cell loss in retinitis pigmentosa using adaptive optics scanning laser ophthalmoscopy: Graefes Arch Clin Exp Ophthalmol, 2019; 257(6); 1169-81
87. Wolfing JI, Chung M, Carroll J, High-resolution retinal imaging of cone-rod dystrophy: Ophthalmology, 2006; 113(6); 1019e1
88. Morgan JI, Han G, Klinman E, High-resolution adaptive optics retinal imaging of cellular structure in choroideremia: Invest Ophthalmol Vis Sci, 2014; 55(10); 6381-97
89. Iida Y, Muraoka Y, Uji A, Associations between macular edema and circulatory status in eyes with retinal vein occlusion: An adaptive optics scanning laser ophthalmoscopy study: Retina, 2017; 37(10); 1896-904
90. Pinhas A, Dubow M, Shah N, Fellow eye changes in patients with nonischemic central retinal vein occlusion: assessment of perfused foveal microvascular density and identification of nonperfused capillaries: Retina, 2015; 35(10); 2028-36
91. Hansen S, Batson S, Weinlander KM, Assessing photoreceptor structure after macular hole closure: Retin Cases Brief Rep, 2015; 9(1); 15-20
92. Navajas EV, Schuck NJ, Athwal A, Long-term assessment of internal limiting membrane peeling for full-thickness macular hole using en face adaptive optics and conventional optical coherence tomography: Can J Ophthalmol, 2023; 58(2); 90-96
93. Rodrigues MW, Say EA, Shields CL, Adaptive optics of small choroidal melanoma: Ophthalmic Surg Lasers Imaging Retina, 2017; 48(4); 354-57
94. Dabir S, Mangalesh S, Govindraj I, Melanoma associated retinopathy: A new dimension using adaptive optics: Oman J Ophthalmol, 2015; 8(2); 125-27
95. Williams ZR, Rossi EA, DiLoreto DA, In vivo adaptive optics ophthalmoscopy correlated with histopathologic results in cancer-associated retinopathy: Ophthalmol Retina, 2018; 2(2); 143-51
96. Poornachandra B, Bhanushali D, Akkali MC, Solar retinopathy-correlation between adaptive optics and spectral domain optical coherence tomography with visual acuity: Graefes Arch Clin Exp Ophthalmol, 2021; 259(5); 1161-66
97. Wu CY, Jansen ME, Andrade J, Acute solar retinopathy imaged with adaptive optics, optical coherence tomography angiography, and en face optical coherence tomography: JAMA Ophthalmol, 2018; 136(1); 82-85
98. Vitellas C, Doble N, Wells-Gray EM, Cone photoreceptor integrity assessed with adaptive optics imaging after laser pointer-induced retinal injury: Retin Cases Brief Rep, 2022; 16(5); 586-92
99. Murro V, Mucciolo DP, Giorgio D, Adaptive optics imaging in patients affected by Pseudoxanthoma elasticum: Am J Ophthalmol, 2021; 224; 84-95
100. Reumueller A, Wassermann L, Salas M, Morphologic and functional assessment of photoreceptors after macula-off retinal detachment with adaptive-optics OCT and microperimetry: Am J Ophthalmol, 2020; 214; 72-85
101. Dave VP, Kumar S, Mulani Y, Foveal cone count reduction in resolved endophthalmitis: An adaptive optics scanning laser ophthalmoscopy (AO-SLO)-based prospective pilot study: Br J Ophthalmol, 2021; 105(11); 1520-24
102. Debellemanière G, Flores M, Tumahai P, Assessment of parafoveal cone density in patients taking hydroxychloroquine in the absence of clinically documented retinal toxicity: Acta Ophthalmol, 2015; 93(7); e534-e40
103. Bae EJ, Kim KR, Tsang SH, Retinal damage in chloroquine maculopathy, revealed by high resolution imaging: A case report utilizing adaptive optics scanning laser ophthalmoscopy: Korean J Ophthalmol, 2014; 28(1); 100-7
104. Morgan JIW, Chui TYP, Grieve K, Twenty-five years of clinical applications using adaptive optics ophthalmoscopy [Invited]: Biomed Opt Express, 2022; 14(1); 387-428
105. Jian Y, Lee S, Ju MJ, Lens-based wavefront sensorless adaptive optics swept source OCT: Sci Rep, 2016; 6; 27620
106. Park JH, Kong L, Zhou Y, Large-field-of-view imaging by multi-pupil adaptive optics: Nat Methods, 2017; 14(6); 581-83
107. Camino A, Ng R, Huang J, Depth-resolved optimization of a real-time sensorless adaptive optics optical coherence tomography: Opt Lett, 2020; 45(9); 2612-15
108. Liu L, Wu Z, Qi M, Application of adaptive optics in ophthalmology: Photonics, 2022; 9(5); 288
109. Cunefare D, Huckenpahler AL, Patterson EJ, RAC-CNN: multimodal deep learning based automatic detection and classification of rod and cone photoreceptors in adaptive optics scanning light ophthalmoscope images: Biomed Opt Express, 2019; 10(8); 3815-32
Figures
Figure 1. Image of normal cone mosaicImage of normal cone mosaic in a healthy volunteer obtained with adaptive optics camera 4°×4° degree square (Rtx-1, Imagine Eyes, Orsay, France). The analysis was performed at superior 2° from the fovea (top). The region of interest (ROI) (yellow square in the top image) was used for automated cone segmentation (bottom left) and detection (bottom right) using dedicated software. Red squares correspond to automatically identified cones (bottom right). The image is from the author’s collection.Figure 2. Image of normal retinal arteriole and venuleEvaluation of retinal arteriolar morphology in a healthy volunteer with adaptive optics camera 4°×4° degree square (Rtx-1, Imagine Eyes, Orsay, France) and measurement of morphological parameters using AOdetect software (top). The parameters calculated from the 3 selected regions of interest, for each time landmark (100 μm width and height each) (bottom). The image is from the author’s collection.Figure 3. Image of retinal vessels in a patient with diabetes mellitus type 2Evaluation of retinal arteriolar morphology in a patient with diabetes mellitus type 2 with adaptive optics camera 4°×4° degree square (Rtx-1, Imagine Eyes, Orsay, France) and measurement of morphological parameters using AOdetect software. Retinal artery with focal luminal narrowing (yellow arrow) and increased wall-to-lumen ratio (WLR 0,33; 0,37; 0,29) (top). The parameters calculated from the 3 selected regions of interest, for each time landmark (100 μm width and height each) (bottom). The image is from the author’s collectionFigure 4. Image of retinal vessels in a patient with hypertensive retinopathyEvaluation of retinal arteriolar morphology in a patient with hypertensive retinopathy with adaptive optics camera 4°×4° degree square (Rtx-1, Imagine Eyes, Orsay, France) and measurement of morphological parameters using AOdetect software. Retinal artery with increased wall-to-lumen ratio (WLR 0,31; 0,33; 0,32) (top). The parameters calculated from the 3 selected regions of interest, for each time landmark (100 μm width and height each) (bottom). The image is from the author’s collection.Figure 5. Image of cone mosaic in a patient with cone-rod dystrophyImage of cone mosaic in a patient with cone-rod dystrophy obtained with adaptive optics camera 4°×4° degree square (Rtx-1, Imagine Eyes, Orsay, France). The analysis was performed at superior 2° from the fovea. Empty spaces at the photoreceptor level and a disrupted mosaic of photoreceptors are demonstrated (top). The region of interest (ROI) (yellow square in the top image) was used for automated cone segmentation (bottom right) and detection (bottom left) using dedicated software. Red squares correspond to automatically identified cones (bottom right). Low density of the cones and the defect in the cones is demonstrated (bottom). The image is from the author’s collection. In Press
11 Mar 2024 : Clinical Research
Enhancement of Frozen-Thawed Human Sperm Quality with Zinc as a Cryoprotective AdditiveMed Sci Monit In Press; DOI: 10.12659/MSM.942946
12 Mar 2024 : Database Analysis
Risk Factors of Age-Related Macular Degeneration in a Population-Based Study: Results from SHIP-TREND-1 (St...Med Sci Monit In Press; DOI: 10.12659/MSM.943140
12 Mar 2024 : Clinical Research
Preoperative Blood Transfusion Requirements for Hemorrhoidal Severe Anemia: A Retrospective Study of 128 Pa...Med Sci Monit In Press; DOI: 10.12659/MSM.943126
12 Mar 2024 : Clinical Research
Tissue Inhibitors of Metalloproteinase 1 (TIMP-1) and 3 (TIMP-3) as New Markers of Acute Kidney Injury Afte...Med Sci Monit In Press; DOI: 10.12659/MSM.943500
Most Viewed Current Articles
17 Jan 2024 : Review article
Vaccination Guidelines for Pregnant Women: Addressing COVID-19 and the Omicron VariantDOI :10.12659/MSM.942799
Med Sci Monit 2024; 30:e942799
14 Dec 2022 : Clinical Research
Prevalence and Variability of Allergen-Specific Immunoglobulin E in Patients with Elevated Tryptase LevelsDOI :10.12659/MSM.937990
Med Sci Monit 2022; 28:e937990
16 May 2023 : Clinical Research
Electrophysiological Testing for an Auditory Processing Disorder and Reading Performance in 54 School Stude...DOI :10.12659/MSM.940387
Med Sci Monit 2023; 29:e940387
01 Jan 2022 : Editorial
Editorial: Current Status of Oral Antiviral Drug Treatments for SARS-CoV-2 Infection in Non-Hospitalized Pa...DOI :10.12659/MSM.935952
Med Sci Monit 2022; 28:e935952