16 October 2020: Clinical Research
Evaluation of Periodontal Phenotypes Using Cone-Beam Computed Tomography, Intraoral Scanning by Computer-Aided Design, and Prosthetic-Driven Implant Planning Technology
Magdalena Bednarz-Tumidajewicz1AB, Aleksandra Sender-Janeczek2EF, Jacek Zborowski2CDE, Tomasz Gedrange3DEF, Tomasz Konopka2CDE, Agata Prylińska-Czyżewska4BCD, Elżbieta Dembowska5EFG*, Wojciech Bednarz12ABCDOI: 10.12659/MSM.924469
Med Sci Monit 2020; 26:e924469


Abstract
BACKGROUND: Two clinical parameters, the gingival thickness (GT) and the width of keratinized tissue (WKT), describe the gingival phenotype, which is defined as the 3-dimensional volume of the gingiva. The periodontal phenotype additionally includes the thickness of the labial plate of the alveolar crest (TLPAC).
MATERIAL AND METHODS: Thirty patients with healthy periodontium on the upper canines and incisors underwent measurements for crestal, supracrestal, free gingival thickness (FGT), the alveolar crest-gingival margin (AC-GM), alveolar crest-cementoenamel junction distance, and the TLPAC at 2, 4, and 8 mm apically from the edge of the alveolar crest using cone-beam computed tomography (CBCT) with computer-aided design and prosthetic-driven implant planning technology. For each tooth, the gingival and periodontal phenotype was evaluated on the basis of the gingival thickness, width of keratinized tissue (WKT), and TLPAC measurements. Each patient’s periodontal phenotype was evaluated according to the coronal width/length ratio of both the upper central incisors.
RESULTS: The dentogingival units had varying average values for the 3 periodontal phenotypes (thin phenotype: FGT 0.65±0.06 mm, WKT 4.85±1.18 mm, AC-GM 3.17±0.64 mm, TLPAC2 0.66±0.28 mm; medium phenotype: FGT 0.87±0.07 mm, WKT 5.49±1.23 mm, AC-GM 3.36±0.65 mm, TLPAC2 0.76±0.37 mm; and thick phenotype: FGT 1.20 mm, WKT 6.00 mm, AC-GM 3.90 mm, TLPAC2 0.90 mm). Positive correlations were seen among WKT, FGT, AC-GM, and TLPAC2.
CONCLUSIONS: Positive correlations between the FGT and WKT, and the AC-GM distance confirm that measurements using CBCT with computer-aided design and prosthetic-driven implant planning technology can evaluate the gingival phenotype and TLPAC2 for the periodontal phenotype.
Keywords: Alveolar Bone Loss, Cone-Beam Computed Tomography, Phenotype, Alveolar Process, Computer-Aided Design, Dental Implants, Dental Prosthesis Design, Gingiva
Background
Two clinical parameters, the gingival thickness (GT) and the width of keratinized tissue (WKT), describe the gingival phenotype, which is defined as the 3-dimensional volume of the gingiva [1,2]. Determination of the gingival and periodontal phenotypes can be useful while planning implantological and orthodontic treatment, where radiological diagnostics are required. The periodontal phenotype additionally includes the thickness of the labial plate of the alveolar crest (TLPAC). Phenotype assessment should be performed when the periodontium is healthy. Assessment of the gingival phenotype has been carried out with the use of visual methods [3], using the gingival transparency method while probing the gingival grooves with a periodontal probe [4–6], transparency and shape of the upper incisor crowns, height of the gingival papillae, width of the keratinized tissue (WKT) [7–10] and recently, by using Colorvue periodontal probes [11]. The gingival phenotype can be determined more precisely using biometry of the WKT and GT.
The GT thickness can be measured with the use of invasive methods such as a needle, an endodontic tool, or a periodontal probe, or with the use of radiological methods like parallel profile radiographs and cone-beam computed tomography (CBCT) [12–16]. Noninvasive methods include using an ultrasonic device and optical coherence tomography [13,16–20]. Measurements of the WKT are most often carried out using a periodontal probe calibrated every 1 mm [20]. Radiological images obtained by computed tomography scans are increasingly assessed while planning dental treatment [7,21–25]. Scientists have begun to use 3D visualization for assessment of the periodontal phenotype using the CBCT method. The authors emphasize that it is an examination with high validity and accuracy [22,23,25,26]. It allows assessment of the dimensions of the TLPAC; however, determining the parameters of soft tissues was often impossible due to their adhesion to the lips, cheeks, and tongue [27,28]. Kobayashi et al. emphasized that the low resolution and contrast in CBCT scanning makes it impossible to assess the soft tissues [28]. Januario et al. used plastic lips, cheeks, and the tongue retractor for measuring the gingival thickness and the cementoenamel junction (CEJ) to marginal gingival distance in the method they named, ‘soft-tissue cone-beam computed tomography’ (ST-CBCT) [27].
The computer-aided design (CAD)/computer-aided manufacturing (CAM) technology is used at the stage of prosthetic design and reconstruction, and in design and fabrication of the zirconia dental root analogue implants after tooth extraction [23,29]. The possibility of intraoral scanning of teeth as well as the surface of the oral cavity’s mucous membrane with the use of a 3D camera has been useful in the volumetric assessment of the results of gingival thickening after augmentation procedures [30,31].
Automatic, computer-aided combining of 3D visualizations of the jaw bone and teeth, and the scanning of teeth and oral cavity soft tissues is possible with the recently developed PDIP® software (Prosthetic-driven Implant Planning, Carestream Health, France) [32]. The implant planning software superimposes the standard tessellation language (STL) files generated by intraoral scanning and the DICOM (Digital Imaging and Communications in Medicine) files generated by CBCT imaging. In addition to its basic application in implant prosthetic treatment planning (recommended by the manufacturer), it obtains the image of the hard tissues in each dentogingival unit of the patient as well as the outline of the surface of soft tissues that cover them. This, in turn, allows soft tissue thickness measurements at specific points. 3D tomographic imaging additionally allows distance measurements between the edge of the alveolar crest bone and the cementoenamel junction of the tooth (AC-CEJ), and the gingival margin (AC-GM), and identification of possible dehiscence or fenestration of the alveolar crest as well as measurement of the TLPAC and the size of the anatomical and clinical crowns.
The research hypothesis assumed that the assessment of the patient’s periodontological phenotype based only on the average clinical crown width/length ratio (CW/CL) value of the upper central incisors according to Olsson and Linde [3] is unreliable, and the best method is to determine the phenotype for a patient’s particular gingival unit. It was decided to determine the usefulness of the CBCT/CAD PDIP method in this regard. Therefore, the purpose of the study was to check the validity of assessing the periodontological phenotype by these methods and to assign measurement values obtained from the CBCT/CAD PDIP study of each dental-gingival unit to the patient’s phenotype determined according to the average CW/CL ratio of the upper central incisors.
Tests were performed to evaluate the periodontal phenotype, namely the gingival phenotype, and to carry out additional measurements of the TLPAC in the maxillary anterior teeth using CBCT/CAD and PDIP technology. Additionally, a correlation was sought between the attached supracrestal tissue width, namely the AC-CEJ distance and AC-GM, and the remaining parameters determining the periodontal phenotype.
Material and Methods
PATIENT SELECTION:
The study had 30 volunteer patients; 16 males and 14 females, who provided written consent for participation. All the patients had indications for CBCT imaging for diagnostic purposes; to establish a dental treatment plan in 29 cases (6 patients before implant treatment, 9 patients before surgical treatment of wedged teeth, 14 patients for assessment of the periodontological phenotype before orthodontic treatment) and 1 case for evaluation after endodontic and implant prosthetic treatment [33]. Clinical and radiological studies were conducted in the Specialist Outpatient Medical Clinic MEDIDENT, Gorlice, Poland. The average age of the patients was 34 years (range 24–54 years). Inclusion criteria for participating patients was a lack of general diseases, good oral hygiene, approximal plaque index ratio <15%, healthy periodontium, bleeding on probing <10%, no loss of clinical attachment (CAL) in the examined sites (CAL=0), no use of drugs that could influence the structure of the periodontal tissues, no addictions, especially nicotinism, no use of removable prosthetic restorations and orthodontic appliances, and no contraindications for X-ray examinations. The study was conducted in accordance with the 1975 Declaration of Helsinki as revised in 2000. The study was approved by the Ethics Committee of the Wroclaw Medical University (No. KB-245/2018).
CONE-BEAM COMPUTED TOMOGRAPHY/COMPUTER-AIDED DESIGN AND CLINICAL MEASUREMENTS:
The CBCT/CAD measurements were carried out using the CS 8100 3D Access tomography device (Carestream Dental, France) and the 3D CS 3600 intraoral scanner (Carestream Dental, France) with the use of the PDIP software (Carestream Dental, France). All CBCT examinations were performed at 90 kV and 3.20 mA for 15 s (voxel size 150 mm; grey scale 15 bit; focal spot 0.6 mm; field of view 80×90 mm). The OnDemand 3D software package (KaVo, Brea, California, United States) was used for image reconstruction and visual analysis (Figure 1).
For each patient, 6 dentogingival units were examined, making a total of 180 upper canines and incisors. The probing depth (PD), CAL, and WKT were examined in each dentogingival unit using a periodontal probe calibrated every 1 mm (UNC 15, Hu Friedy, USA). Using the CBCT/CAD and PDIP technology, the researchers measured free gingival thickness (FGT) as a distance between the surface of the gingiva and the surface of the tooth root halfway between the CEJ and the marginal gingiva; supracrestal gingival thickness (SGT) as a distance between the surface of the gingiva and the surface of the tooth root at a distance of 1 mm apically from the CEJ; and crestal gingiva thickness (CGT) as a distance between the surface of the gingiva and the bone at a distance of 1 mm from the edge of the alveolar crest, perpendicular to these surfaces (Figure 2). The TLPAC was measured in a plane perpendicular to the tooth axis, midbuccal from the inner to the labial surface of the bone of the alveolar crest. The TLPAC was measured at 3 points: 2 mm, 4 mm, and 8 mm from the margin of the labial plate of the alveolar crest in the apical direction (Figures 3–5). Moreover, the section between the edge of the alveolar crest and the gingival margin, (AC-GM) and the cementoenamel junction (AC-CEJ) was measured in compatibility with the direction of the tooth axis (Figure 6). Figure 7 shows the final visualization of the radiological measurements of the evaluated parameters.
The clinical crown length (CL) of both upper central incisors as a distance between the gingival margin in the zenith point, and the incisal edge and the clinical crown width (CW) as the mesio-distal distance at the level of one-third the crown length, was measured in each patient using orthodontic calipers with an accuracy of 0.01 mm. The CW/CL ratio was obtained by dividing the average value of the CW by the average value of the CL.
For each patient, the periodontal phenotype was evaluated based on the shape of both the upper central incisors, namely their ratio CW/CL. If the value of the CW/CL was ≤0.8, the patient’s periodontal phenotype was considered thin (long-narrow crown form, N group), and if it was >0.8, it was considered thick (square-wide crown form, W group). For each dentogingival unit, the gingival phenotypes were determined on the basis of gingival thickness (GT) measurements made using the CBCT/CAD and PDIP methods. GT ≤0.7 mm: thin gingival phenotype; GT >0.7 mm ≤1.0 mm: medium gingival phenotype; and GT >1.0 mm: thick gingival phenotype, for each examined point (FGT, SGT, CGT).
As it is possible to determine the vertical and horizontal dimensions of the medial incisal teeth in the jaw, and also in CBCT/CAD and PDIP imaging, it was decided that the degree of reliability of the first method measurements would be determined on the basis of these measurements and clinical measurements made using an orthodontic caliper (criterion standard). In both the methods, 2 measurements were made. In the CBCT/CAD and PDIP method, intra-examiner reliability was 96.7% for CL and CW values, and in the second method 95% and 96.7%, respectively. Intra-examiner reliability between methods was 91.7% compliance.
All measurements were performed by one researcher (WB) with 30 years of clinical experience, and experienced in using the intraoral scanner and 3D software.
STATISTICAL ANALYSIS:
Continuous data in all groups were stated as median, and lower and upper quartiles (M [25Q÷75Q]) for non-normally distributed variables or as mean and standard deviation (mean±SD) for normally distributed variables.
Statistical differences between independent groups were calculated by ANOVA for groups with heterogeneous variance or the nonparametric Mann-Whitney U test or Kruskal-Wallis rank sum test (homogeneity of variance was verified using Bartlett’s test).
Statistical significance between frequencies was calculated by χ2df with Yate’s correction with the appropriate number of degrees of freedom (df) (df=(m–1)*(n–1)), where m is the number of rows, n is the number of columns). For selected pairs of parameters, correlation analysis was performed by calculating Spearman’s correlation coefficient. P≤0.05 was considered to be statistically significant. Statistical analysis was calculated using the statistical computer program package EPIINFO Ver. 7.1.1.14 (from 2 July 2013) (Centers for Disease Control and Prevention, [CDC] Atlanta, Georgia, US).
Results
In all 30 patients, the clinical attachment was located at the CEJ level (CAL=0) in each dentogingival unit. The mean PD value for 180 teeth was 1.23±0.43 mm, and the mean value of the WKT was 5.28±1.26 mm. The remaining mean values of the assessed parameters displayed on the screen from the CBCT/CAD visualization using the PDIP software are presented in Table 1. The mean values were FGT 0.81±0.18 mm, SGT 1.58±0.32 mm, and CGT 0.87±0.24 mm. Free gingiva at the upper left canines was the thinnest, the mean value of FGT was 0.66±0.11 mm, and supracrestal gingiva at the upper right central incisor was the thickest at 1.79±0.23 mm (Table 2). The periodontal phenotype according to the CW/CL ratio of the upper central incisors showed that only 9 (30%) patients were characterized as the thin phenotype, and 21 (70%) patients as the thick phenotype. In the long-narrow crown form (N) group, the mean value of FGT was 0.74±0.13 mm, SGT was 1.46±0.31 mm, and CGT was 0.79±0.25 mm. In the square-wide crown form (W) group, the mean values were 0.84±0.20 mm, 1.63±0.31 mm, and 0.91±0.24 mm, respectively; the differences were statistically significant. While comparing the mean values of FGT, SGT, and CGT between the N and W groups for particular groups of teeth, statistically significant differences were seen only for the SGT of the central incisors, and FGT and CGT of the canines (Table 3). Table 4 presents the frequency and distribution of dentogingival units in the N and W group, depending on the scope of the FGT, SGT, and CGT values. In the W group (126 dentogingival units), the FGT was >1 mm in 12 (9.52%) cases, FGT >0.7 mm ≤1.0 mm in 72 (57.14%) cases, and FGT ≤0.7 mm in 42 (33.33%) cases. In the N group (54 dentogingival units), the FGT was >1 mm in 1 (1.85%) case, FGT >0.7 mm ≤1.0 mm in 20 (37.04%) cases, and the FGT ≤0.7 mm in 33 (61.11%) cases.
An analysis of correlations between the clinical and the radiological parameters carried out for all 180 dentogingival units showed statistical significance between the WKT, AC-GM, TLPAC measured at 2 mm (TLPAC2) and 4 mm (TLPAC4) in the apical direction from the edge of the bone and FGT. SGT confirms the validity of establishing these parameters, which define the gingival phenotype (WKT, GT, AC-GM) and the periodontal phenotype (TLPAC2 and TLPAC4), respectively (Table 5).
Allocation of the dentogingival units to the appropriate gingival phenotypes on the basis of FGT measurements in accordance with the patterns presented above were 7.22% (13 sites) as the thick gingival phenotype, 51.11% (92 sites) as the medium gingival phenotype, and 41.67% (75 sites) as the thin gingival phenotype. On the basis of the SGT, the breakdown was 96.11% (173 sites) thick phenotype, 3.33% (6 sites) medium phenotype, and 0.56% (1 site) thin phenotype. Therefore, a comparison of the values of particular clinical and radiological parameters in such phenotype groups was not conducted because the numbers were too small for analysis. Based on the CGT measurements, the thick gingival phenotype was determined in 21.67% cases, the medium phenotype in 44.44% cases, and the thin phenotype in 33.89% cases. No statistically significant differences were seen between the assessed parameters in the phenotype groups created based on the CGT values (WKT, AC-CEJ, TLPAC2, TLPAC4, TLPAC8). However, statistically significant differences were seen between the AC-GM thin and thick phenotypes (p=0.001), and the medium and thick phenotypes (p=0.007).
In the thin gingival phenotype determined on the basis of FGT values (Table 6), the mean value of the TLPAC2 was more apical than the edge of the alveolar crest and equal to 0.66±0.28 mm, in the medium phenotype it was 0.76±0.38 mm, and in the thick phenotype, the median was 0.90 mm (3.80÷4.40 mm). There was a statistically significant difference between the thin and thick phenotypes with regard to TLPAC2 (p=0.021), and between the thin and the medium phenotypes, it was on the verge of significance (p=0.057). Similarly, the mean value of the TLPAC4 in the thin phenotype was equal to 0.50±0.26 mm, in the medium phenotype it was 0.44±0.28 mm, and in the thick phenotype, the median was 0.70 mm (0.50÷0.80 mm). With regard to TLPAC4, the difference between the thin and thick phenotypes was statistically significant (p=0.011). There were no statistically significant differences between the gingival phenotypes with regard to TLPAC8.
The mean value of the AC-CEJ distance in the thin phenotype was 2.35±0.64 mm, in the medium phenotype it was 2.16±0.54 mm, and in the thick phenotype the median was 2.10 mm (1.90 mm÷2.30 mm). A statistically significant difference (p=0.037) was observed only between the AC-CEJ values in the thin and medium phenotypes. The average value of the AC-GM distance was 3.17±0.64 mm in the thin phenotype, 3.36±0.65 mm in the medium phenotype, and the median was 3.90 mm (3.80÷4.40 mm) in the thick phenotype. The differences in the AC-GM values between the thin and thick phenotypes, and the medium and thick phenotypes were statistically significant (p=0.000, p=0.002, respectively). Differences between the thin and thick phenotypes were on the verge of significance (p=0.060).
Discussion
Olson and Lindhe reported that the biotype is influenced by gingival thickness and the TLPAC, which is supposed to be correlated to the shape of the upper central incisors [3]. Values close to 1.0 for the CW/CL ratio of the left upper central incisors are supposed to indicate the thick periodontium biotype; and the thin and long clinical crowns indicate the thin periodontium biotype. Among recent studies only Stein et al. confirmed the existence of such correlations and the usefulness of the CW/CL ratio of the upper central incisors in determining the periodontal phenotype [14]. Other studies do not confirm it [5,6,9,10]. The lack of usefulness of this method in determining the periodontal phenotype was confirmed in a similar way in our study as the necessity to assess each dentogingival unit individually was proven. Although statistically significant differences between the values of FGT, SGT and CGT in the phenotype groups created on the basis of the CW/CL ratio were proven, the assessment of particular dentogingival units in these groups did not show statistically significant differences, except for the SGT of the central incisors and, the FGT and CGT of the canines. In the group with the thick periodontal phenotype (CW/CL ratio >0.08 mm), FGT was thicker than 1 mm only in 9.52% of dentogingival units, and it was thinner than 0.7 mm in 33.33% units.
Although the methods based on free gingival transparency while probing are better, they are also subjective. The best method is direct measurement of gingival thickness. Determining the phenotype based on the gingival thickness criterion is most often GT <1 mm as the thin phenotype and GT >1 mm as the thick phenotype [4,7,20], or GT <1.5 mm as the thin phenotype and GT >2 mm as the thick phenotype [34]. In our study it was assumed that the lower value for a thick gingiva was equal to 1 mm, and for a thin gingiva it was ≤0.7 mm. The difference between these values determined a gingiva of medium thickness.
There are large discrepancies regarding the location of gingival thickness measurements. La Rocca et al. verified GT at 1 mm from the gingival margin [35], Claffey et al. measured it at 2 mm from the gingival margin [34], and Zucchelli et al. used 1.5 mm from the gingival margin [36]. Using a periodontal probe, Shah et al. measured GT in the middle of the keratinized gingiva [20], and Ganji et al. measured it 3 mm from the CEJ [22]. Some researchers take GT measurements at 2 or more sites [14,35,37–39]. La Rocca et al. measured gingival thickness using the bone-sounding method at 3 points; 1 mm apically from the GM, 1 mm coronally from the mucogingival junction and at the midpoint [35]. Furtak et al. determined the points depending on the clinical parameters of each dentogingival unit [38], which was reflected in this study, and determined them as FGT, SGT, and CGT. While assessing the thickness of the labial plate of the bone, Stein et al. proceeded similarly using parallel profile radiographs [14].
Cone-beam computed tomography and noninvasive scanning in combination with the PDIP software were used in our study. The CBCT examination, despite using ionizing radiation, is an accepted and safe method [25,27], and intraoral scanning is an entirely noninvasive method. The authors also emphasize the accuracy and validity of CBCT [24,25,27,35]. Icen et al. demonstrated the importance of appropriate resolution settings, field of view size, and voxel size for achieving optimal measurement accuracy [40]. Studies have confirmed the effectiveness and repeatability of linear measurements in CBCT imaging and intraoral scanners [40–42]. The precision of the results for the CBCT and CAD scans is 0.2 mm [42], and the precision of the linear measurements performed by the observer on CBCT are 0.0864 mm [41]. Use of CAD software compatible with the intraoral scanner is also recommended [43].
In our study, phenotypes were broken down according to the FGT, SGT, and CGT values within the range ≤0.7 mm, >0.7 mm ≤1.0 mm, and >1.0 mm as thin, medium, and thick phenotypes, respectively. In the phenotype classification based on SGT values, only 1 dentogingival unit was characterized as the thin phenotype, 6 as the medium phenotype, and 173 as the thick phenotype. Therefore, despite the presence of positive correlations between the parameters defining the periodontal phenotypes and statistically significant differences between the phenotypes created according to the SGT criterion having been proven, we did not take them into account. An attempt to create such a breakdown should be made with a larger group. On the other hand, no statistically significant differences were seen in the phenotype breakdown based on the CGT values criterion, except with the AC-GM and the correlations between them, which were proven while comparing the assessed parameters. Therefore, only the phenotype breakdown based on the FGT criterion was considered.
Another parameter describing the gingival phenotype is the WKT, which was measured clinically. Egreja et al. proved a positive correlation between the width of the keratinized gingiva (WKG) and the GT measured invasively in the upper central and lateral incisors and canines in 60 patients aged 20–35 years [44]. Using a periodontal probe, Shah et al. measured the WKG in 400 patients in the anterior region of the maxilla [20]. The mean value of the WKG was 4.38 mm for the central incisors, 5.18 mm for the lateral incisors, and 4.11 mm for the canines. The presence of a positive correlation between the WKG and GT measured invasively using an endodontic tool at the midpoint of the keratinized gingiva was also proven, which confirms the validity of defining them while determining the phenotype. The authors of this study also proved the existence of such a correlation. The dentogingival units with the thin periodontal phenotype had mean values of 4.85 mm for WKT, 5.49 mm in the medium phenotype and a median of 6.00 mm in the thick phenotype. The differences between them were statistically significant.
The current study also tested whether there was a correlation between AC-CEJ and AC-GM, and the remaining GT and WKT parameters. In the study by Fisher et al. [9], supracrestal gingival height does not correlate with the biotype determined using the transparency method according to El Nahass. El Nahass et al. assessed the AC-CEJ distance for the central and lateral incisors based on 73 cone-beam tomographic scans [21]. The mean values of AC-CEJ were equal to 2.10 mm and 2.09 mm, respectively. Younes et al. using CBCT scans of 21 patients, found that the mean distances from the CEJ to the alveolar crest of the maxillary central and lateral incisors, and canines were equal to 1.98 mm, 2.03 mm, and 2.47 mm, respectively [19]. In our study, the mean value for all the assessed dentogingival units was 2.23 mm. These findings correspond with findings reported by Januario et al. [27]. and Nowzari et al. [24]. However, Cook et al. assessed the periodontal biotypes in 60 patients on the basis of clinical studies of the upper central and lateral incisors, and for canines, gypsum models and CBCT visualizations [45]. In the thin periodontal phenotype, the AC-CEJ distance ranged from 3.35 mm to 3.39 mm, and it was significantly greater than seen in the individuals with the thick biotype, where it was 3.06 mm to 3.15 mm. The authors showed a positive correlation of the periodontal biotype in relation to the thickness of the labial plate of the bone, AC-CEJ distance, WKT, and probe transparency.
No correlations between AC-CEJ, GT, and WKT were observed in our study. However, a positive correlation was seen between GT and WKT and the AC-GM distance, which was equal to an average of 3.17 mm in the thin periodontal phenotype, 3.36 mm in the medium phenotype, and the median was 3.90 mm in the thick phenotype. The differences between the values were statistically significant.
The TLPAC is another important parameter that can be assessed by CBCT when determining the periodontal phenotype. While assessing the TLPAC, Stein et al. conducted a radiovisiography examination using the parallel profile radiographs technique [14]. This examination, however, can only be conducted in the anterior section of the dentition, while CBCT can be conducted in any section of the dentition [22]. Many authors assessed the thickness of the labial plate of the bone and the locations of the measurement points were diverse depending on the adopted reference point, namely, CEJ or the edge of the alveolar crest [19,21,24,25,35,46–49]. Braut et al. measured facial bone thickness from the labial side of the front teeth of the upper jaw in 125 patients (498 teeth) using CBCT [46]. The first measurement point (MP1) was located 4 mm apically from the CEJ, and the second one was in the middle of the root position (MP2). The authors reported that in 90% of cases the bone was thinner than 1 mm in 62.9% cases at MP1 and 80.1% at MP2. The bone was not found in 25.7% cases at MP1 and 10% cases at MP2. Bone thickness of 1 mm or more was found only in 11.4% cases at MP1 and 9.8% cases at MP2. La Rocca et al. determined the thickness of the labial plate of the bone 4 mm apically from CEJ, on the apex level of the root and at the midpoint [35]. The mean bone thickness (BT) was 1.24 mm, 0.81 mm, and 2.78 mm, respectively. They showed no correlation between bone thickness and gingival thickness in any of the examined areas, however, the gingival width was directly related to the crestal BT.
Adopting the edge of the alveolar crest as a reference point is, according to the authors of this study, a better solution, which is consistent with numerous reports [19,21,25,47]. The location of the edge of the alveolar crest can be different in various types of gingival phenotypes. The occurrence of bone dehiscence, which makes it impossible to measure bone thickness at a point that is, for example, 4 mm further apically from CEJ in some dentogingival units, is also possible. The distance of the AC-CEJ in healthy periodontium is additionally assessed as supracrestal tissue attachment [1].
Frost et al. assessed the thickness of the labial plate 2 mm apically to the edge of the alveolar crest [47]. Younes et al. assessed it 1, 2, 3, 4, and 5 mm apically to the edge of the alveolar crest [19], Temple et al. assessed it 1, 3, and 5 mm from the edge of the alveolar crest [25]. Stein et al. measured it in 3 areas at the edge of the alveolar crest, in one-third of the apical and one-third of the crown part of the root, where the mean values were 0.57 mm, 0.77 mm, and 0.85 mm, respectively [14]. El Nahass et al. measured the thickness of the labial plate at the level of the edge of the alveolar crest, and 1 mm, 2 mm and 4 mm apically [21]. The mean values for the central incisors were 0.60 mm, 0.71 mm, 0.78 mm, 0.81 mm respectively, and for the lateral incisors, 0.57 mm, 0.73 mm, 0.84 mm, and 0.84 mm, respectively. Fuentes et al. measured the thickness of the labial plate of the bone at 5 points on the basis of 50 CBCT scans at the bone margin, at the root apex level and 3 intermediate points [48]. The means of the bone thickness were higher than in the studies quoted above, and were equal to 1.14 mm for the central incisors, 0.95 mm for the lateral incisors and 1.15 mm for the canines. Similarly, higher values of the labial plate of the bone in the anterior part of the maxilla were shown by Ghassemian et al. [49] and Nowzari et al. [24]. In the study carried out by Younes et al., the mean values of the TLPAC2 and TLPAC4 at the central incisors were 1.10 mm for both, at the lateral incisors 1.21 mm and 1.22 mm, and at the canines 0.99 mm and 1.00 mm, respectively [19]. In our study, the mean values of TLPAC2 determined for all 180 dentogingival units were 0.73 mm, the TLPAC4 value was 0.56 mm, and the TLPAC8 value was 0.45 mm.
The mean values of TLPAC2 in the dentogingival units of the phenotypes based on FGT values in this study were equal to 0.66 mm in the thin phenotype, 0.76 mm in the medium phenotype and 0.90 mm in the thick phenotype. The presence of a strong correlation between TLPAC2 and FGT was shown, which is consistent with other studies [19,50]. However, Fu et al. made soft tissue measurements 2 mm more apically than the bone margin [50], and Younes et al. made them 3 mm below the edge of the gum with an ultrasonic probe 4 mm in diameter [19]. A clear positive correlation between the buccal bone thickness and attached gingival thickness was also shown by Ganji et al. in the upper premolar area in the Saudi population [22].
One limitation of this study was the insufficient sample size and the lack of random selection of patients. The study included 30 patients with indications for CBCT imaging, who agreed to participate in the study. Another limitation was the single researcher (WB) who performed all the measurements. Despite the limitations of this study, clinical and radiological parameters characterizing incisors and canines of the jaw in the studied group of patients were determined. The mean values of the dentogingival units with the thin periodontal phenotype were 0.65±0.06 mm for FGT, 4.85±1.18 mm for WKT, 3.17±0.64 mm for AC-GM, and 0.66±0.28 mm for TLPAC2. In the medium periodontal phenotype, the mean values were 0.87±0.07 mm for FGT, 5.49±1.23 mm for WKT, 3.36±0.65 mm for AC-GM, and 0.76±0.37 mm for TLPAC2. In the thick phenotype, median values were 1.20 mm (1.10÷1.20 mm) for FGT, 6.00 mm (6.00÷7.00 mm) for WKT, 3.90 mm (3.80÷4.40 mm) for AC-GM, and 0.90 mm (0.70÷1.10 mm) for TLPAC2. These studies will be continued in a larger cohort.
Conclusions
Evaluation of the periodontal and gingival phenotypes in a patient, using the method based on the CW/CL ratio of both upper central incisors, is unreliable. The phenotype should be evaluated for each dentogingival unit.
The positive correlation between WKT, FGT and AC-GM distance confirms the importance of determining these parameters in the assessment of the gingival phenotype and additionally, the TLPAC2 in determining the periodontal phenotype.
Using CBCT/CAD and PDIP technology allows determination of the gingival and the periodontal phenotype, and can be useful while planning implantological and orthodontic treatment, where radiological diagnostics are required. In each case of gingival and periodontal phenotype assessment, a clinical examination of the patient should be performed along with the determination of PD, CAL, and WKT in the healthy periodontium.
Figures
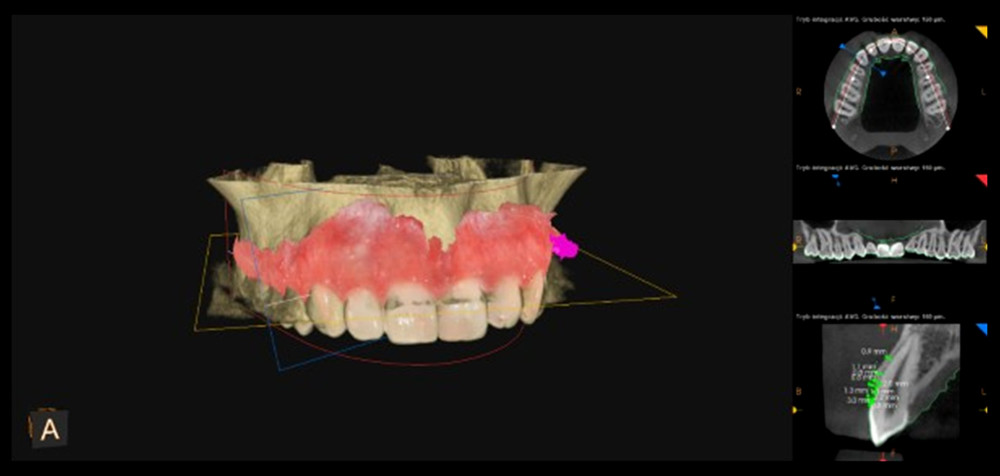 Figure 1. 3D visualization after superimposing the standard tessellation language files generated by intraoral scanning and Digital Imaging and Communications in Medicine files generated by cone-beam computerized tomography imaging using PDIP® software (Prosthetic-driven Implant Planning, Carestream Health, France).
 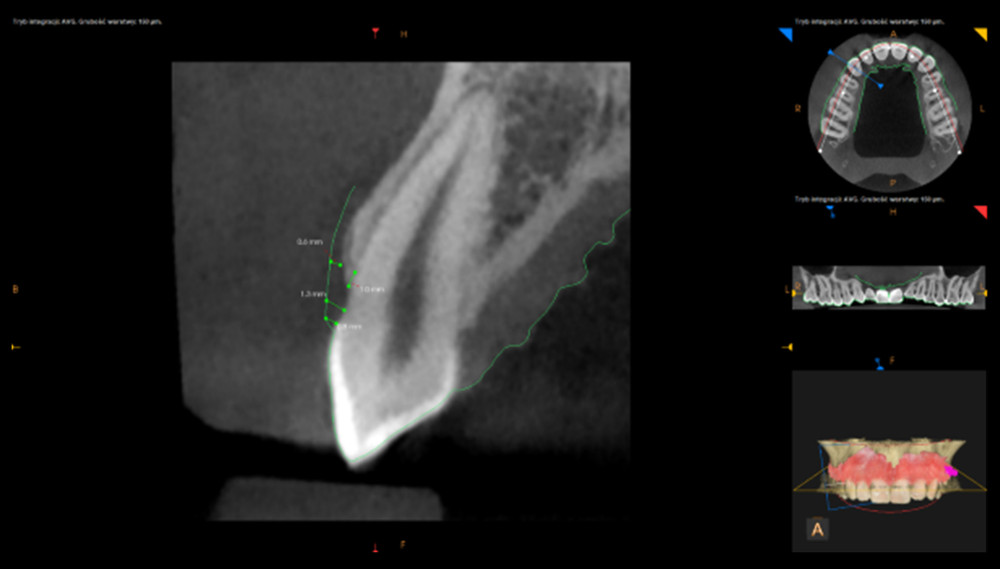 Figure 2. Measurements of the free gingival thickness, marginal gingiva, supracrestal, and crestal gingival thickness of dentogingival unit 13.
 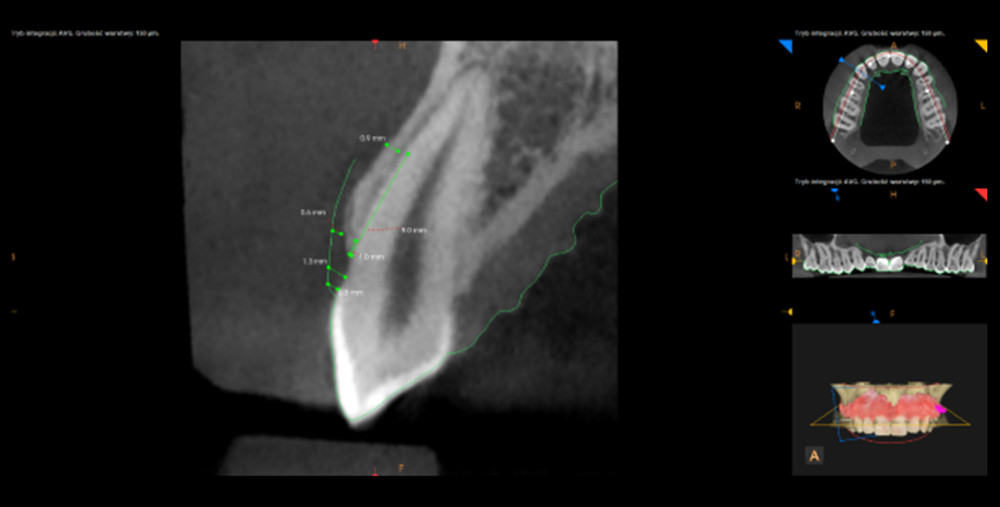 Figure 3. Measurement of the thickness of the labial plate of the alveolar crest at 8 mm of dentogingival unit 13.
  Figure 4. Measurement of the thickness of the labial plate of the alveolar crest at 4 mm of dentogingival unit 13.
 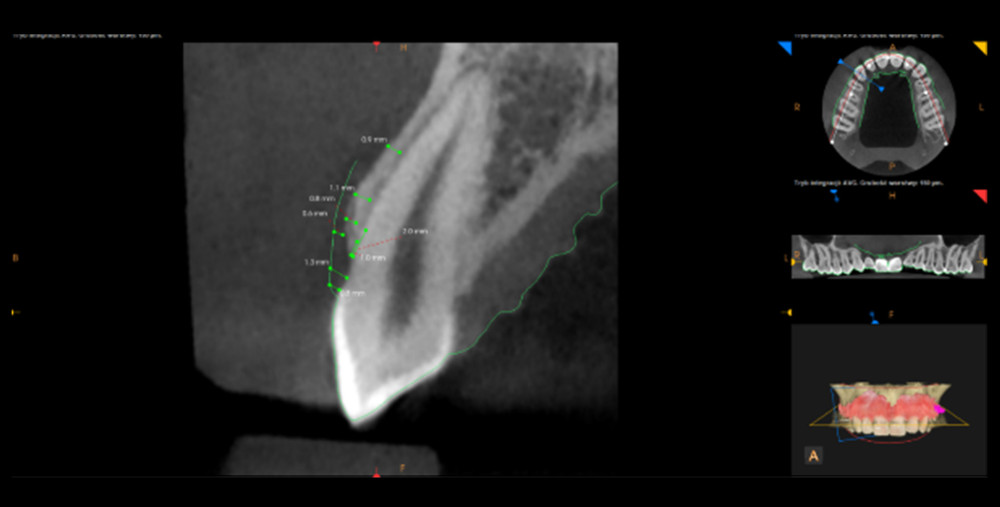 Figure 5. Measurement of the thickness of the labial plate of the alveolar crest at 2 mm of dentogingival unit 13.
 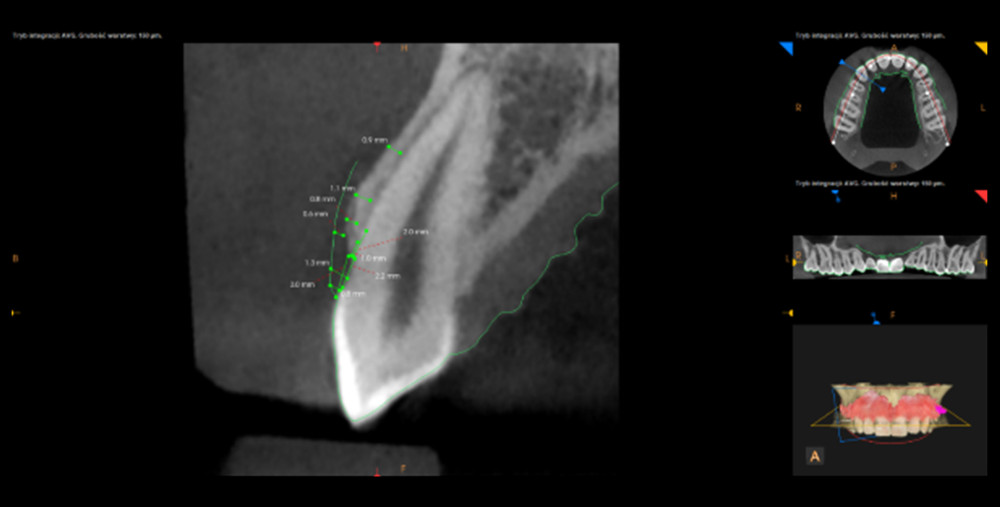 Figure 6. Measurement of the alveolar crest-gingival margin and alveolar crest-cementoenamel junction distance of dentogingival unit 13.
 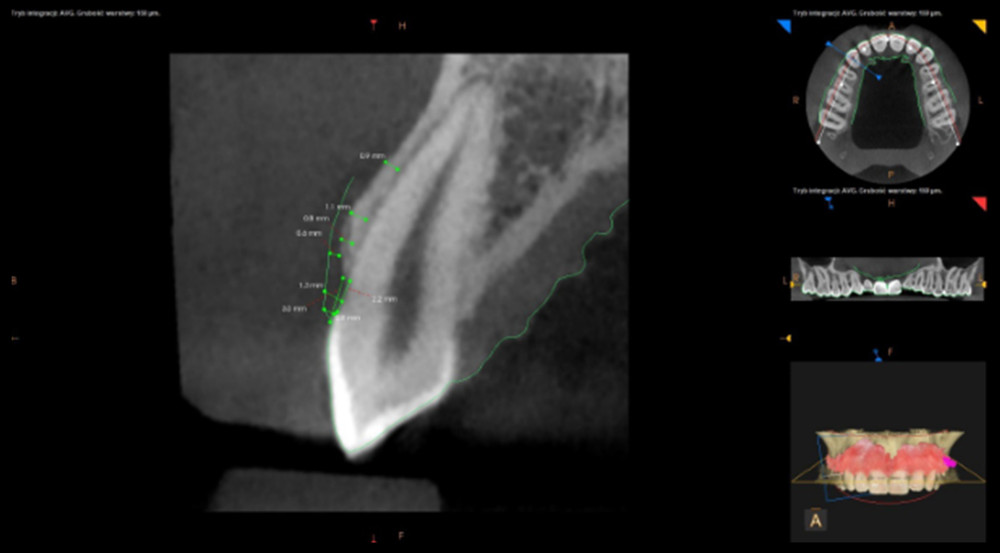 Figure 7. The final visualization of the radiological measurement of evaluated parameters at dentogingival unit 13 without auxiliary sections.
 Tables
Table 1. Average values of the clinical parameters and CAD/CBCT visualization.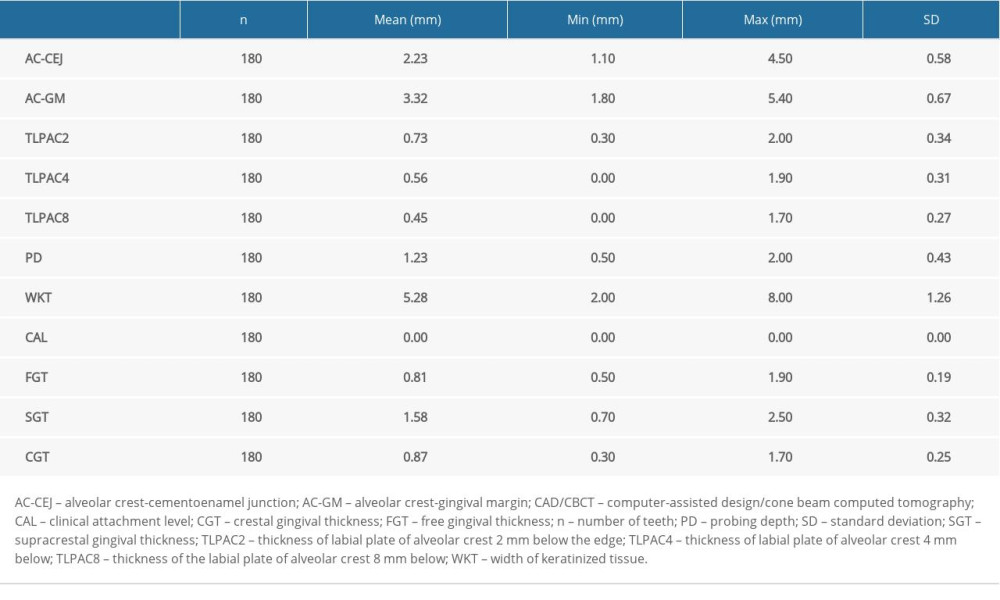 Table 2. Average values of gingival thickness at 3 measurement points within the area of teeth 13–23 using CAD/CBCT.
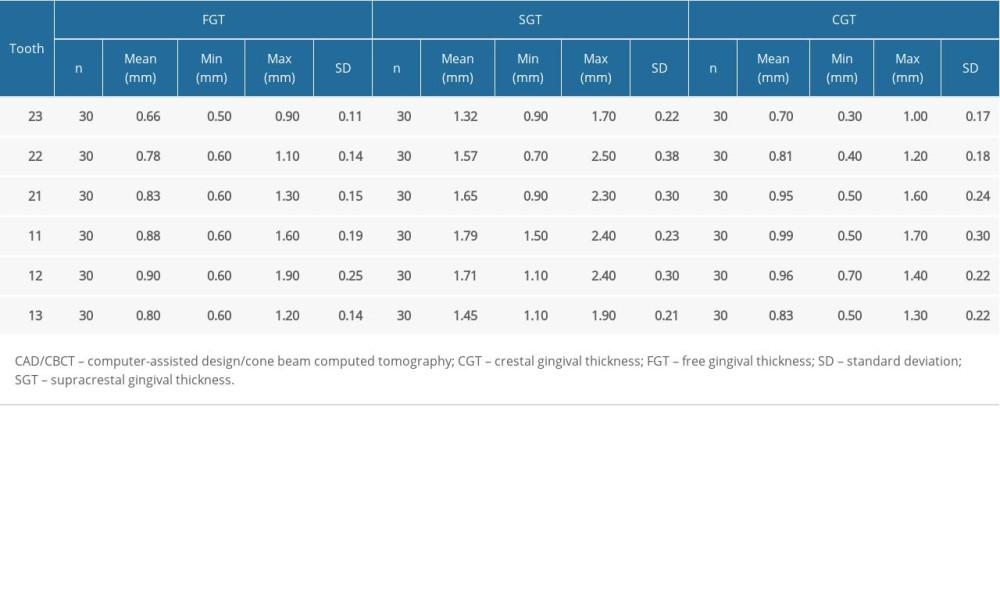 Table 3. Average values of gingival thickness at 3 measurement points within the teeth 13–23 using CAD/CBCT including division into two phenotype groups.
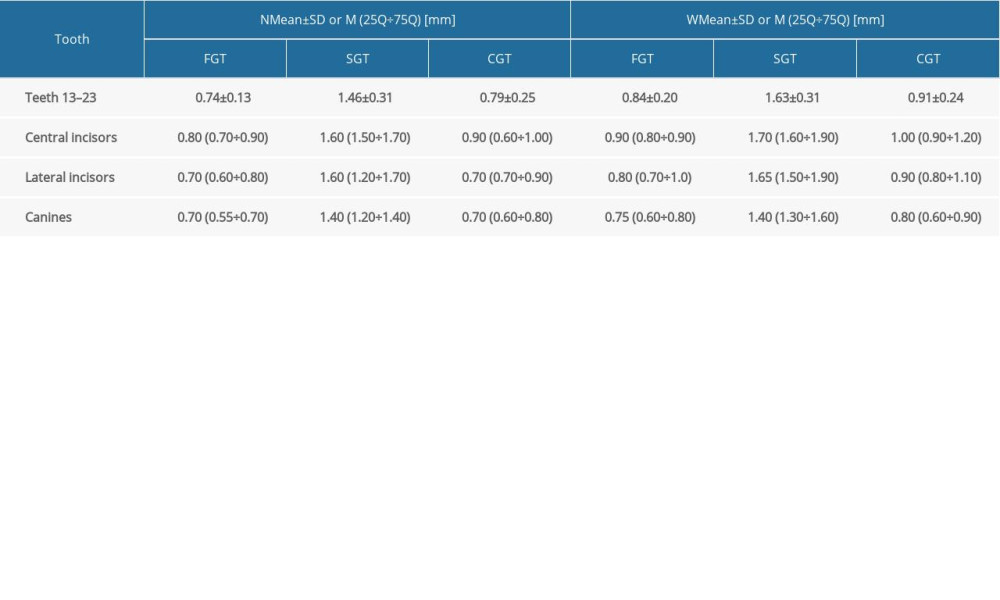 Table 4. Frequency and distribution of dento-gingival units in groups N and W depending on the free gingival thickness values (Chi-square test).
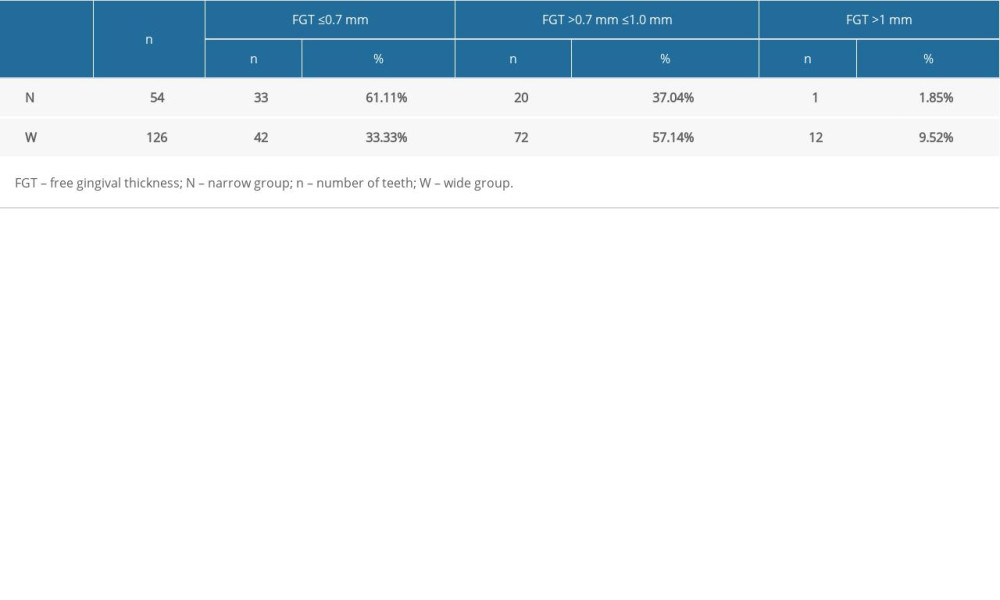 Table 5. Spearman’s correlation for gingival thickness with reference to selected clinical and radiological parameters.
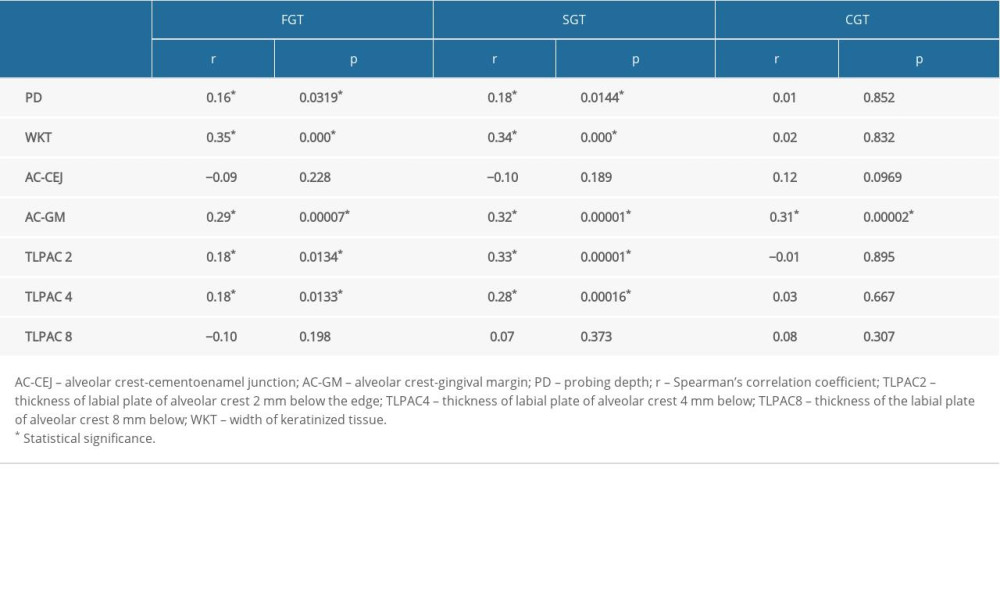 Table 6. Correlation analysis between clinical and radiological parameters in three periodontal phenotypes determined by free gingival thickness measurements using CAD/CBCT.
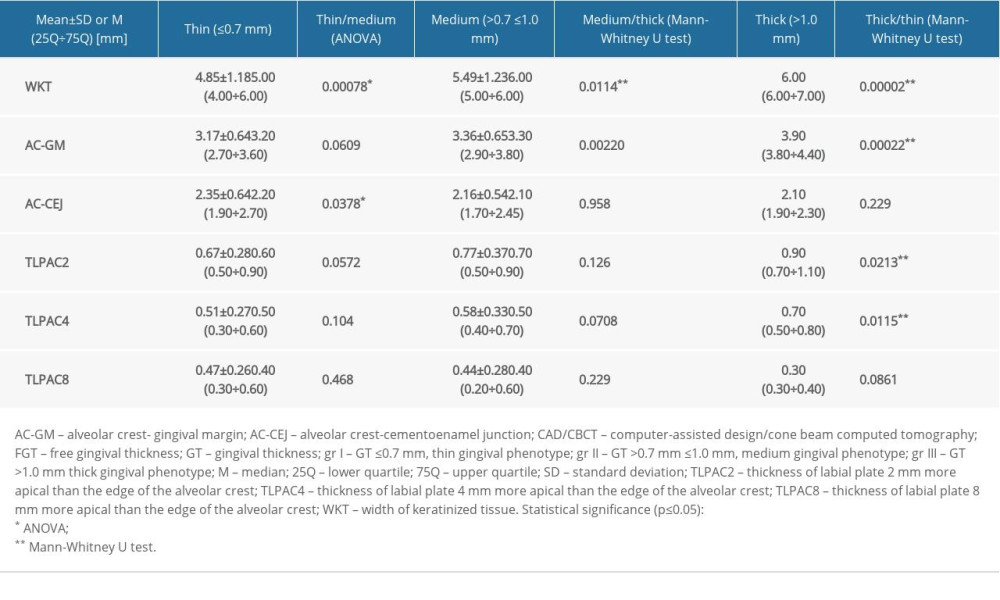
References
1. Ercoli C, Caton JG, Dental prostheses and tooth-related factors: J Clin Periodontol, 2018; 45; 207-28
2. Jepsen S, Caton JG, Albandar JM, Periodontal manifestations of systemic diseases and developmental and acquired conditions: Consensus report of workgroup 3 of the 2017 World Workshop on the Classification of Periodontal and Peri Implant Diseases and Conditions: J Clin Periodontol, 2018; 45; S219-29
3. Olsson M, Lindhe J, Periodontal characteristics in individuals with varying form of the upper central incisors: J Clin Periodontol, 1991; 18; 78-82
4. Kan JY, Rungcharassaeng K, Umezu K, Kois JC, Dimensions of peri-implant mucosa: An evaluation of maxillary anterior single implants in humans: J Periodontol, 2003; 74; 557-62
5. Kloukos D, Koukos G, Doulis I, Gingival thickness assessment at the mandibular incisors with four methods: A cross-sectional study: J Periodontol, 2018; 89; 1300-9
6. Kan J, Morimoto T, Rungcharassaeng K, Gingival biotype assessment in the esthetic zone: Visual versus direct measurement: Int J Periodontics Restorative Dent, 2010; 30; 237-43
7. Alqerban A, Jacobs R, Fieuws S, Willems G, Comparison of two cone beam computed tomographic systems versus panoramic imaging for localization of impacted maxillary canines and detection of root resorption: Eur J Orthod, 2011; 33; 93-102
8. Dominiak M, Gedrange T, New perspectives in the diagnostic of gingival recession: Adv Clin Exp Med, 2014; 23; 857-63
9. Fischer KR, Grill E, Jockel-Schneider Y, On the relationship between gingival biotypes and supracrestal gingival height, crown form and papilla height: Clin Oral Implants Res, 2014; 25; 894-98
10. De Rouck T, Eghbali R, Collys K, The gingival biotype revisited: Transparency of the periodontal probe through the gingival margin as a method to discriminate thin from thick gingiva: J Clin Periodontol, 2009; 36; 428-33
11. Rasperini G, Acunzo R, Cannalire P, Farronato K, Influence of periodontal biotype on root surface exposure during orthodontic treatment: A preliminary study: Int J Periodontics Restorative Dent, 2015; 35; 664-75
12. Alpiste-Illueca F, Dimensions of the dentogingival unit in maxillary anterior teeth: A new exploration technique (parallel profile radiograph): Int J Periodontics Restorative Dent, 2004; 24; 386-96
13. Bednarz W, Zielińska A, Ultrasonic biometer and its usage in an assessment of periodontal soft tissue thickness and comparison of its measurement accuracy with a bone sounding method: Dent Med Probl, 2011; 48; 481-89
14. Stein J, Lintel-Höping N, Hammächer C, The gingival biotype: measurement of soft and hard tissue dimensions – a radiographic morphometric study: J Clin Periodontol, 2013; 40; 1132-39
15. Yilmaz HG, Boke F, Ayali A, Cone-beam computed tomography evaluation of the soft tissue thickness and greater palatine foramen location in the palate: J Clin Periodontol, 2015; 42; 458-61
16. Gürlek Ö, Sönmez Ş, Güneri P, Nizam N, A novel soft tissue thickness measuring method using cone beam computed tomography: J Esthet Restor Dent, 2018; 30; 516-22
17. Kakizaki S, Aoki A, Tsubokawa M, Observation and determination of periodontal tissue profile using optical coherence tomography: J Periodont Res, 2017; 53; 188-99
18. Gánti B, Bednarz W, Kőműves K, Vág J, Reproducibility of the PIROP ultrasonic biometer for gingival thickness measurements: J Esthet Restor Dent, 2019; 31; 263-67
19. Younes F, Eghbali A, Raes M, Relationship between buccal bone and gingival thickness revisited using non-invasive registration methods: Clin Oral Implants Res, 2016; 27; 523-28
20. Shah R, Sowmya NK, Mehta DS, Prevalence of gingival biotype and its relationship to clinical parameters: Contemp Clin Dent, 2015; 6; 167-71
21. El Nahass H, Naiem SN, Analysis of the dimensions of the labial bone wall in the anterior maxilla: A cone-beam computed tomography study: Clin Oral Impl Res, 2015; 26; e57-61
22. Ganji K, Alswilem R, Abouonq A, Noninvasive evaluation of the correlation between thickness of the buccal bone and attached gingiva of maxillary premolars: J Esthet Restor Dent, 2019; 31; 240-45
23. Matys J, Świder K, Flieger R, Dominiak M: Adv Clin Exp Med, 2017; 26; 803-9
24. Nowzari H, Molayem S, Chiu CH, Rich SK, Cone beam computed tomographic measurement of maxillary central incisors to determine prevalence of facial alveolar bone width ≥2 mm: Clin Implant Dent Relat Res, 2012; 14; 595-602
25. Temple KE, Schoolfield J, Noujeim ME, A cone beam computed tomography (CBCT) study of buccal plate thickness of the maxillary and mandibular posterior dentition: Clin Oral Impl Res, 2016; 27; 1072-78
26. Misch KA, Yi ES, Sarment DP, Accuracy of cone beam computed tomography for periodontal defect measurements: J Periodontol, 2006; 77; 1261-66
27. Januario AL, Barriviera M, Duarte WR, Soft tissue cone-beam computed tomography: A novel method for the measurement of gingival tissue and the dimensions of the dentogingival unit: J Esthet Restor Dent, 2008; 20; 366-74
28. Kobayashi K, Shimoda S, Nakagawa Y, Yamamoto A, Accuracy in measurement of distance using limited cone-beam computerized tomography: Int J Oral Maxillofac Implants, 2004; 19; 228-31
29. Greenberg AM, Advanced dental implant placement techniques: J Istanb Univ Fac Dent, 2017; 51; S76-89
30. Huber S, Zeltner M, Hämmerle CHF, Non-interventional 1-year follow-up study of peri-implant soft tissues following previous soft tissue augmentation and crown insertion in single-tooth gaps: J Clin Periodontol, 2018; 45; 504-12
31. Rojo E, Stroppa G, Sanz-Martin I, Soft tissue volume gain around dental implants using autogenous subepithelial connective tissue grafts harvested from the lateral palate or tuberosity area. A randomized controlled clinical study: J Clin Periodontol, 2018; 45; 495-503
32. Sharma MS, Pandey V, Vartak V, Bondekar V, Prosthetic driven implantology a review: Int J Res Health Allied Sci, 2016; 2; 21-25
33. Kim DM, Bassir SH, When is cone-beam computed tomography imaging appropriate for diagnostic inquiry in the management of inflammatory periodontitis? An American Academy of Periodontology best evidence review: J Periodontol, 2017; 88; 978-98
34. Claffey N, Shanley D, Relationship of gingival thickness and bleeding to loss of probing attachment in shallow sites following nonsurgical periodontal therapy: J Clin Periodontol, 1986; 13; 654-57
35. La Rocca A, Alemany A, Levi P, Anterior maxillary and mandibular biotype: Relationship between gingival thickness and width with respect to underlying bone thickness: Implant Dent, 2012; 21; 507-15
36. Zucchelli G, Mele M, Stefanini M, Patient morbidity and root coverage outcome after subepithelial connective tissue and de-epithelialized grafts: A comparative randomized-controlled clinical trial: J Clin Periodontol, 2010; 37; 728-38
37. Da Silva SC, Joly JC, de Lima AFM, Tatakis DN, Root coverage using the coronally positioned flap with or without a subepithelial connective tissue graft: J Periodontol, 2004; 75; 413-19
38. Furtak A, Leszczyńska E, Sender-Janeczek A, Bednarz W, The repeatability and reproducibility of gingival thickness measurement with an ultrasonic device: Dent Med Probl, 2018; 55; 281-88
39. Müller HP, Schaller N, Eger T, Heinecke A, Thickness of masticatory mucosa: J Clin Periodontol, 2000; 27; 431-36
40. Icen M, Orhan K, Şeker C: Dentomaxillofac Radiol, 2020; 49; 20190197
41. Tolentino Ed, Yamashita FC, de Albuquerque S, Reliability and accuracy of linear measurements in cone-beam computed tomography using different software programs and voxel sizes: J Conserv Dent, 2018; 21; 607-12
42. Lim S-W, Hwang H-S, Cho I-S, Registration accuracy between intraoral-scanned and cone-beam computed tomography-scanned crowns in various registration methods: Am J Orthod Dentofacial Orthop, 2020; 157; 348-56
43. Erozan Ç, Ozan O, Evaluation of the precision of different intraoral scanner-Computer Aided Design (CAD) software combinations in digital dentistry: Med Sci Monit, 2020; 26; e918529
44. Egreja AMC, Kahn S, Barceleiro M, Bittencourt S, Relationship between the width of the zone of keratinized tissue and thickness of gingival tissue in the anterior maxilla: Int J Periodontics Restorative Dent, 2012; 32; 573-79
45. Cook DR, Mealey BL, Verrett RG: Int J Periodontics Restorative Dent, 2011; 31; 345-54
46. Braut V, Bornstein MM, Belser U, Buser D, Thickness of the anterior maxillary facial bone wall: A retrospective radiographic study using cone beam tomography: Int J Periodontics Restorative Dent, 2011; 31; 125-31
47. Frost NA, Mealey BL, Jones AA, Huynh-Ba , Periodontal biotype: Gingival thickness as it relates to probe visibility and buccal plate thickness: J Periodontol, 2015; 86; 1141-49
48. Fuentes R, Flores T, Navarro P, Assessment of buccal bone thickness of aesthetic maxillary region: A cone-beam computed tomography study: J Periodontal Implant Sci, 2015; 45; 162-68
49. Ghassemian M, Nowzari H, Lajolo C, The thickness of facial alveolar bone overlying healthy maxillary anterior teeth: J Periodontol, 2012; 83; 187-97
50. Fu J, Yeh C, Chan H, Tissue biotype and its relation to the underlying bone morphology: J Periodontol, 2010; 81; 569-74
Figures
Figure 1. 3D visualization after superimposing the standard tessellation language files generated by intraoral scanning and Digital Imaging and Communications in Medicine files generated by cone-beam computerized tomography imaging using PDIP® software (Prosthetic-driven Implant Planning, Carestream Health, France).Figure 2. Measurements of the free gingival thickness, marginal gingiva, supracrestal, and crestal gingival thickness of dentogingival unit 13.Figure 3. Measurement of the thickness of the labial plate of the alveolar crest at 8 mm of dentogingival unit 13.Figure 4. Measurement of the thickness of the labial plate of the alveolar crest at 4 mm of dentogingival unit 13.Figure 5. Measurement of the thickness of the labial plate of the alveolar crest at 2 mm of dentogingival unit 13.Figure 6. Measurement of the alveolar crest-gingival margin and alveolar crest-cementoenamel junction distance of dentogingival unit 13.Figure 7. The final visualization of the radiological measurement of evaluated parameters at dentogingival unit 13 without auxiliary sections. Tables
Table 1. Average values of the clinical parameters and CAD/CBCT visualization.Table 2. Average values of gingival thickness at 3 measurement points within the area of teeth 13–23 using CAD/CBCT.Table 3. Average values of gingival thickness at 3 measurement points within the teeth 13–23 using CAD/CBCT including division into two phenotype groups.Table 4. Frequency and distribution of dento-gingival units in groups N and W depending on the free gingival thickness values (Chi-square test).Table 5. Spearman’s correlation for gingival thickness with reference to selected clinical and radiological parameters.Table 6. Correlation analysis between clinical and radiological parameters in three periodontal phenotypes determined by free gingival thickness measurements using CAD/CBCT.Table 1. Average values of the clinical parameters and CAD/CBCT visualization.Table 2. Average values of gingival thickness at 3 measurement points within the area of teeth 13–23 using CAD/CBCT.Table 3. Average values of gingival thickness at 3 measurement points within the teeth 13–23 using CAD/CBCT including division into two phenotype groups.Table 4. Frequency and distribution of dento-gingival units in groups N and W depending on the free gingival thickness values (Chi-square test).Table 5. Spearman’s correlation for gingival thickness with reference to selected clinical and radiological parameters.Table 6. Correlation analysis between clinical and radiological parameters in three periodontal phenotypes determined by free gingival thickness measurements using CAD/CBCT. In Press
Clinical Research
Effects of Single-Bout Endurance Exercise Intensity on Peripheral Neurotrophic Factors in Patients With Isc...Med Sci Monit In Press; DOI: 10.12659/MSM.952089
Review article
Anisodus tanguticus in Cancer Research: A Review of Traditional Use, Phytochemistry, Extraction Methods, an...Med Sci Monit In Press; DOI: 10.12659/MSM.952999
Clinical Research
Nasal Mucociliary Clearance and Its Relationship With Disease Severity in Patients With Multiple SclerosisMed Sci Monit In Press; DOI: 10.12659/MSM.952850
Clinical Research
Modified Thoracoabdominal Nerves Block Through the Perichondrial Approach vs Subcostal Transversus Abdomini...Med Sci Monit In Press; DOI: 10.12659/MSM.953976
Most Viewed Current Articles
17 Jan 2024 : Review article 14,176,570
Vaccination Guidelines for Pregnant Women: Addressing COVID-19 and the Omicron VariantDOI :10.12659/MSM.942799
Med Sci Monit 2024; 30:e942799
13 Nov 2021 : Clinical Research 3,762,188
Acceptance of COVID-19 Vaccination and Its Associated Factors Among Cancer Patients Attending the Oncology ...DOI :10.12659/MSM.932788
Med Sci Monit 2021; 27:e932788
14 Dec 2022 : Clinical Research 2,466,310
Prevalence and Variability of Allergen-Specific Immunoglobulin E in Patients with Elevated Tryptase LevelsDOI :10.12659/MSM.937990
Med Sci Monit 2022; 28:e937990
16 May 2023 : Clinical Research 708,927
Electrophysiological Testing for an Auditory Processing Disorder and Reading Performance in 54 School Stude...DOI :10.12659/MSM.940387
Med Sci Monit 2023; 29:e940387