15 May 2021: Database Analysis
H Long Terminal Repeat-Associating 2 (HHLA2) is a Biomarker of Advanced Stage Hepatocellular Carcinoma and Promotes Tumor Cell Development In Vitro
Min Luo1ABCE, Yao Xiong2BCE, Yan Lin1CD, Rong Liang1CD, Yongqiang Li1D, Lianying Ge3ADE*DOI: 10.12659/MSM.930215
Med Sci Monit 2021; 27:e930215


Abstract
BACKGROUND: Several risk factors contribute to the inflammation promoting hepatocellular carcinoma (HCC) development, but the underlying mechanisms are unknown. Human endogenous retrovirus H long terminal repeat-associating 2 (HHLA2), a B7 family member, is highly expressed in various malignant tumor tissues and is related to tumor progression and metastasis.
MATERIAL AND METHODS: Bioinformatics analysis was used to analyze the gene expression chip GSE33006 of HCC tissue in the GEO database, draw a heat map of differentially expressed genes, and analyze the GO pathway of gene function annotation. Then, we compared HCC tissues with para-carcinoma liver tissues from 55 patients for expression patterns and associations with HHLA2. Effects of HHLA2 knockdown were examined in the human HCC cell line HepG2 to explore effects of HHLA2 on HepG2 cells.
RESULTS: A significantly higher expression of HHLA2 at the mRNA and protein levels was detected in HCC tissues than in para-carcinoma liver tissues, which was similar to HHLA2 expression in the GSE33006 data. A higher expression of HHLA2 protein was associated with advanced cancer stage, tumor differentiation, and invasion of adjacent structures. In vitro knockdown of HHLA2 expression significantly increased HepG2 cell adhesion, promoted cell apoptosis, induced cell cycle arrest in the G1/S phase, and inhibited cell proliferation, migration, and invasion.
CONCLUSIONS: Our data indicated there was a higher expression of HHLA2 in HCC tissues than in para-carcinoma liver tissues, and HHLA2 plays a major role in the development and progression of HCC. Owing to its higher expression, HHLA2 is a potential prognostic biomarker for HCC.
Keywords: Biological Markers, Carcinoma, Hepatocellular, Hep G2 Cells, Biomarkers, Tumor, Cell Adhesion, Cell Cycle Checkpoints, Computational Biology, G1 Phase, Immunoglobulins, Liver Neoplasms, RNA, Messenger, S Phase
Background
Hepatocellular carcinoma (HCC) accounts for 85% to 90% of primary liver cancer cases. Globally, there are 841 080 new cases annually, and the incidence of HCC continues to increase [1,2]. The major pathogenic factors for HCC include hepatitis B or hepatitis C virus infection, intake of aflatoxin, alcohol abuse, non-alcoholic fatty liver disease, obesity, and type II diabetes. Most of these conditions are known to cause chronic inflammation in the liver, which contributes to the development of more than 90% of HCC cases [3]. Understanding the mechanism of inflammation-induced HCC is necessary for its treatment and prevention.
The human endogenous retrovirus H long terminal repeat-associating 2 (HHLA2) protein is a member of the B7 family that regulates T cell proliferation and cytokine production [4,5]. HHLA2 is widely expressed in breast, lung, bone, and bladder cancers as well as in other tumor tissues, and its expression level is closely related to patient survival and prognosis [6–9]. This suggests that HHLA2 may be involved in the occurrence and development of tumors.
In the present study, we examined whether HHLA2 expression correlates with HCC pathology and progression. We conducted in vitro experiments to determine the impact of HHLA2 on tumor cell development.
Material and Methods
DATA SOURCE:
Data on 3 HCC samples and 3 para-carcinoma samples were retrieved from the human HCC transcriptional chip GSE33006 in the Gene Expression Omnibus (GEO) database (https://www.ncbi.nlm.nih.gov/geo) [10]. All differential gene expression analyses were performed using R software. The gene ontology database (http://geneontology.org/) was used to analyze functional enrichment in all differentially expressed genes.
PATIENTS AND SAMPLES:
A total of 55 patients with HCC who were admitted to the Guangxi Medical University Cancer Hospital from January 2016 to June 2018 were included in this study. All patients underwent surgical resection and were diagnosed with HCC by pathology testing. None of the patients received chemotherapy or bio-immunotherapy, and none had autoimmune diseases or other organ tumors. All HCC tissues were taken from the primary tumor, while avoiding areas of necrosis and inflammation, and para-carcinoma tissues were taken 3 cm to 5 cm away from the primary tumor. In addition, liver tissues adjacent to the hepatic hemangioma were surgically collected as normal liver tissues from 11 patients (3 men), aged 30 to 51 years. Detailed clinicopathological characteristics of the patients with HCC are listed in Table 1. All surgical specimens were immediately snap-frozen in liquid nitrogen and stored at −80°C until protein or RNA extraction. The present study was approved by the Ethics Committee of the Guangxi Medical University Cancer Hospital, according to the guidelines of the 1975 Declaration of Helsinki.
HCC CELL LINES:
Three HCC cell lines (HepG2, SmMC-7721, Huh-7) and the normal liver cell line HL-7702 (Shanghai Cell Bank, Chinese Academy of Sciences) were used in this study. The cells were cultured in Dulbecco’s modified Eagle’s medium (Gibco Life Technologies, USA), containing 10% fetal bovine serum (FBS), 10 000 U/mL penicillin, and 10 000 U/L streptomycin at 37°C and 5% CO2.
QUANTITATIVE REVERSE TRANSCRIPTION-POLYMERASE CHAIN REACTION:
Total RNA was isolated from snap-frozen tissues and HCC cells using Trizol (Life Technologies, UK), and cDNA was produced using a reverse transcription-polymerase chain reaction (RT-PCR) kit (TaKaRa, Japan), according to the manufacturers’ instructions. Fluorescence quantitative (q)RT-PCR was performed with TaKaRa TB Green™ Premix Ex Taq™ II (Tli RNaseH Plus, TaKaRa, Japan) on a LightCycler (Roche Diagnostics, USA). The following primers were used for PCR:
GAPDH was used as the endogenous reference. The 2−ΔΔCT method was applied to calculate levels of HHLA2 mRNA relative to those of GAPDH mRNA.
WESTERN BLOT ANALYSIS:
Protein was extracted from tissue and cell lysates using ice-cold protein lysis buffer, and protein concentration was estimated using a bicinchoninic acid protein assay kit (Beyotime Biotechnology, China) according to the manufacturer’s protocol. After adding sample buffer, proteins were denatured in a boiling water bath, centrifuged, separated by SDS-PAGE (10% acrylamide/bisacrylamide solution; Solarbio, USA), and transferred onto polyvinylidene fluoride transfer membranes (Millipore, Billerica, MA, USA). The membranes were blocked in 5% dried skimmed milk powder overnight and incubated for 2 h at room temperature with a primary antibody against HHLA2 (dilution 1: 500; #AB10711, Abcam, UK). The membranes were washed and incubated at room temperature for 1 h with goat anti-rabbit IgG (H+L) secondary antibody (dilution 1: 10 000; Abcam). Membranes were washed again, and bands were visualized using the ECL western blotting detection system (Thermo Fisher Scientific, USA). Band densities were normalized to those of β-tubulin (dilution 1: 500; #AB6046, Abcam) or β-actin (dilution 1: 5000, #AB2001, Abways) as loading control. Images were collected using a gel imaging analysis system (Bio-Rad, USA).
LENTIVIRAL INFECTION:
Lentivirus-mediated RNAi technology was used to silence the HHLA2 gene in HepG2 cells. The packaging of the plasmid and lentivirus was completed by Shanghai Hanyin Biotechnology Co., Ltd. (Shanghai, China). HHLA2 was targeted using the following short hairpin RNA (shRNA) sequences:
HepG2 cells were transfected with plasmids expressing one of the HHLA2-targeted shRNAs or a non-targeting control plasmid (defined as HepG2-NC). Fluorescence was detected 48 h after transfection, and then the cells were collected and evaluated for HHLA2 expression using qRT-PCR and western blotting for screening the best silencing efficiency targeted shRNA.
PROLIFERATION AND ADHESION ASSAY:
The proliferation and adhesion ability of the HepG2 cells after HHLA2 knockdown were assessed using the cell counting kit-8 (CCK-8; Dojindo Laboratories, Kyushu, Japan), according to the manufacturer’s instructions. Briefly, cells of each group were plated at 2000 cells/well into a 96-well plate, and 5000 cells/well into a 96-well plate, pre-covered with human fibronectin (Yeasen, China), were subsequently incubated at 37°C and 5% CO2. At each time point, 10 μL CCK-8 was added into the corresponding well and incubated at 37°C for 2 h. The optical density values were measured using a ELX808 microplate reader (BioTek, CA, USA) at a wavelength of 450 nm.
CELL APOPTOSIS AND CYCLE DISTRIBUTION:
Flow cytometry was used to analyze the HepG2 cell cycle and cell apoptosis. Cells were treated with trypsin (Gibco Life Technologies, USA), plated at 1×10⁴ cells/mL into a 6-well plate and incubated at 37°C and 5% CO2, centrifuged at 1000×g for 5 min, washed with 500 μL binding buffer or with phosphate-buffered saline (PBS) once, fixed in ice-cold absolute ethanol, and stored at 4°C. The pellets were subsequently collected, washed twice with PBS and with propidium iodide (BD Biosciences, NJ, USA) in the presence of 5 μL Annexin V (BD Biosciences, NJ, USA) for 15 min in the dark, or stained RNaseA (Sigma-Aldrich, USA) for 30 min in the dark. Cell apoptosis and cycle distribution were analyzed by Beckman Gallios flow cytometry (Gallios, USA).
CELL MIGRATION AND MATRIGEL INVASION ASSAYS:
For the wound scrape assay, cells of each group were incubated in 6-well plates and small straight-line wounds were made in confluent monolayers using a 200-μL pipette tip. Cells were washed twice with sterile PBS and incubated at 37°C and 5% CO2 for 48 h. Wound images were captured at 0 and 48 h at 100× magnification using an Olympus inverted microscope (Olympus, Tokyo, Japan). For the Matrigel-transwell migration assay, 1×10⁴/100 μL cells were resuspended in serum-free medium and placed on the membrane of chambers (Corning, NY, USA), which was covered with Matrigel (1: 8 dilution; BD Biosciences, NJ, USA). The lower chambers contained medium with 10% FBS. Following 24 h of incubation, the migrating cells in the lower chamber or the invading cells on the bottom of each well were stained with 1% crystal violet (Solarbio, China), followed by fixation in 4% paraformaldehyde for 15 min. Next, the number of cells in 3 randomly selected microscopic fields at 200× magnification was counted with the Olympus inverted microscope.
STATISTICAL ANALYSIS:
Statistical analysis was performed using SPSS version 25.0 (IBM, Armonk, NY, USA). Data were presented as mean±standard deviation. Differences between groups were assessed using the
Results
HHLA2 UPREGULATION IN HCC TISSUE BASED ON DATABASE ANALYSIS:
To determine in silico whether HHLA2 may be overexpressed in HCC tissue, the GSE33006 data set was screened for differentially expressed genes. We found that HHLA2 expression was significantly higher in HCC tissues than in para-carcinoma tissues (Figure 1A). Gene ontology analysis suggested that these differentially expressed genes, including HHLA2, are involved in immune responses, chemokine-mediated signaling, and extracellular matrix structure (Figure 1B).
HHLA2 UPREGULATION IN HCC TISSUE BASED ON ANALYSIS OF PATIENTS AT OUR MEDICAL CENTER:
Since HHLA2 protein was overexpressed in HCC samples from the data set, we wanted to check its expression in our cohort of patients. We retrospectively analyzed HHLA2 expression at the mRNA and protein level in 55 human HCC tissues and para-carcinoma tissues by qRT-PCR and western blot analysis. Eleven normal liver tissues were used as controls. As shown in Figure 2A, HHLA2 mRNA expression was significantly higher in the HCC tissues (1.628±0.413) than in the para-carcinoma tissues (1.080±0.323) and normal liver tissues (1.038±0.286) (both P<0.001); there was no significant difference between the para-carcinoma tissues and the normal liver tissues (P=0.666).
Similarly, HHLA2 protein levels were significantly higher in HCC tissues (0.877±0.271) than in para-carcinoma tissues (0.580±0.383) and normal liver tissues (0.375±0.319) (both P<0.001) (Figure 2B). No significant difference, however, was detected between para-carcinoma tissues and normal liver tissues (P=0.054).
ASSOCIATION OF HHLA2 PROTEIN LEVELS IN HCC TISSUES WITH CLINICOPATHOLOGY:
After verifying the overexpression of the HHLA2 protein in our cohort of patients, we further identified relationships between HHLA2 expression in HCC tissue and clinicopathological factors (Table 1). We found that HHLA2 expression was significantly associated with Barcelona Clinic Liver Cancer (BCLC) classification stage (P<0.001), tumor differentiation (P=0.008), and tumor invasion of adjacent structures (P=0.007). Moreover, higher expression of HHLA2 was positively and significantly associated with advanced BCLC-C stage and poorly differentiated HCC. No significant associations were found with sex, age, smoking, drinking, serum alpha-fetoprotein level, tumor capsule, tumor size, hepatitis B virus infection, liver cirrhosis, portal vein tumor thrombus, and lymph node metastasis.
IN VITRO KNOCKDOWN OF HHLA2 IN THE HCC CELL LINE HEPG2:
Data from patients and the GSE33006 data set suggested that HHLA2 is important for HCC development and progression. After screening multiple HCC cell lines, we found that HepG2 cells expressed higher levels of HHLA2 mRNA and protein than did other cell lines, so we selected HepG2 for subsequent in vitro experiments (Figure 3A, 3B). We stably knocked down HHLA2 in these cells using lentivirus expressing shRNA, leading to cells that will be referred to from here on as “HepG2-KD” cells (Table 2, Figure 3C). Of the 3 anti-HHLA2 shRNAs that we tested, we found shRNA 1 to cause the strongest knockdown (P<0.001), so we used that shRNA in subsequent experiments.
There were no significant differences in proliferation between HepG2-KD cells and HepG2-NC cells on day 1 or 2 after transfection with the lentivirus (Figure 4A). By day 3, HepG2-KD cells showed significantly lower proliferation (P=0.018). Knockdown of HHLA2 also significantly increased cell adhesion (P=0.0017) and apoptosis (P<0.001) (Figure 4B–4D). HepG2-KD cells were effectively stalled in phases G0/G1 (P<0.01) and S (P<0.05) of the cell cycle, resulting in significantly fewer cells that progressed to phase G2/M (P<0.01) (Figure 4E, 4F). Those cells also showed significantly less migration (P<0.05) and invasion (P<0.01) in wound healing (Figure 5A, 5B) and transwell migration assays (Figure 5C, 5D).
Discussion
HHLA2 is a co-stimulatory molecule that plays an important role in tumor immune escape [11]. It binds to T cell-related receptors to inhibit the proliferation of CD4+ and CD8+ T cells, as well as the production of cytokines, thereby inhibiting immune surveillance. Inhibiting B7 proteins that act as immune checkpoints, principally CTLA-4 and PD-1/PD-L1, may be effective against liver cancer [12–14]. Therefore, we considered whether the B7 protein HHLA2 might be a biomarker and therapeutic target for HCC. Analysis of the GSE33006 data set and our own patient cohort revealed HHLA2 upregulation in HCC tissues, which was associated with advanced disease. HHLA2 knockdown in an HCC cell line decreased proliferation and migration, arrested cells in the G1/S phase, and increased apoptosis. These results suggest that HHLA2 promotes HCC progression and therefore may be a useful immunotherapy target against the disease.
Gene ontology analysis implicated HHLA2 in immune responses, chemokine signaling, and extracellular matrix composition. Various immune cells, inflammatory factors, and components of the extracellular matrix are important parts of the HCC tumor microenvironment, which regulates the activity of T cells and induces immune escape [15]. Our data indicated that HHLA2 overexpression contributes to the tumor microenvironment of HCC by promoting metastasis, which negatively affects prognosis.
Our results suggest that HHLA2 contributes to the malignancy and progression of HCC. Higher HHLA2 protein levels in our retrospective cohort were associated with advanced BCLC stage, poor tumor differentiation, and tumor invasion of neighboring structures. Consistent with our results in HCC, HHLA2 overexpression in colon cancer is positively correlated with the depth of tumor invasion [16], and in tumor size, stage, grade, and lymph node metastasis in bladder cancer [9]. Increased expression of HHLA2 in cholangiocarcinoma is associated with lymph node metastasis and advanced cancer stage [17]. These findings suggest that HHLA2 overexpression occurs in tumor tissues with advanced stage, and therefore it could be effective to use biotherapy to target HHLA2 in patients in advanced stages of HCC.
Tumor invasion and metastasis are multistep processes involving numerous factors, and these processes are the main cause for poor prognosis and mortality in patients with HCC [18]. In our experiments, HHLA2 knockdown enhanced the adhesion between HepG2 cells and the extracellular matrix in vitro. Our results are consistent with a transcriptome study [19], indicating that HHLA2 is involved in regulating intercellular adhesion between primary human T cells and the extracellular matrix. In fact, the less adhesive the tumor, the more effectively it evades immune killing, which is proposed by the “tumor growth-cell immune feedback” model. Zan et al found that higher adhesion between tumor cells inhibited the escape of tumor cells from the immune system, while lower adhesion between tumor cells could effectively help the tumor escape killing from the immune system to metastasize [20]. Consistent with this model, HHLA2 protein levels in patients with metastatic osteosarcoma were higher in primary and metastatic tumors than in primary tumors of patients without metastasis [8]. Results of previous work and the present study strongly imply that HHLA2 helps HCC tumors escape the immune system by effecting intercellular adhesion of tumor cells.
Thus, when we knocked down HHLA2, the ability of HepG2 cells to migrate and invade decreased significantly. Similarly, HHLA2 silencing significantly reduced the viability, migration, and invasion ability of clear cell renal cell carcinoma cells in vitro [21]. As in the previous study, we found that the knockdown of HHLA2 blocked cell cycle progression. These data imply that HHLA2 regulates tumor cell propagation, so targeting it with therapeutics may inhibit cancer progression.
Conclusions
In conclusion, HHLA2 had higher expression in HCC tissues than in para-carcinoma liver tissues and was associated with advanced HCC stage. HHLA2 is advantageous to the cell survival and growth of the HCC cell line HepG2, and these pro-tumor effects can be inhibited effectively in vitro by knocking down the protein. These findings indicated that HHLA2 is a potential prognostic biomarker of HCC and may provide a turning point in the understanding of the functions of HHLA2 related to HCC. Therefore, further study into the evidence of HHLA2’s contributions to the development and progression of HCC would be valuable.
Figures
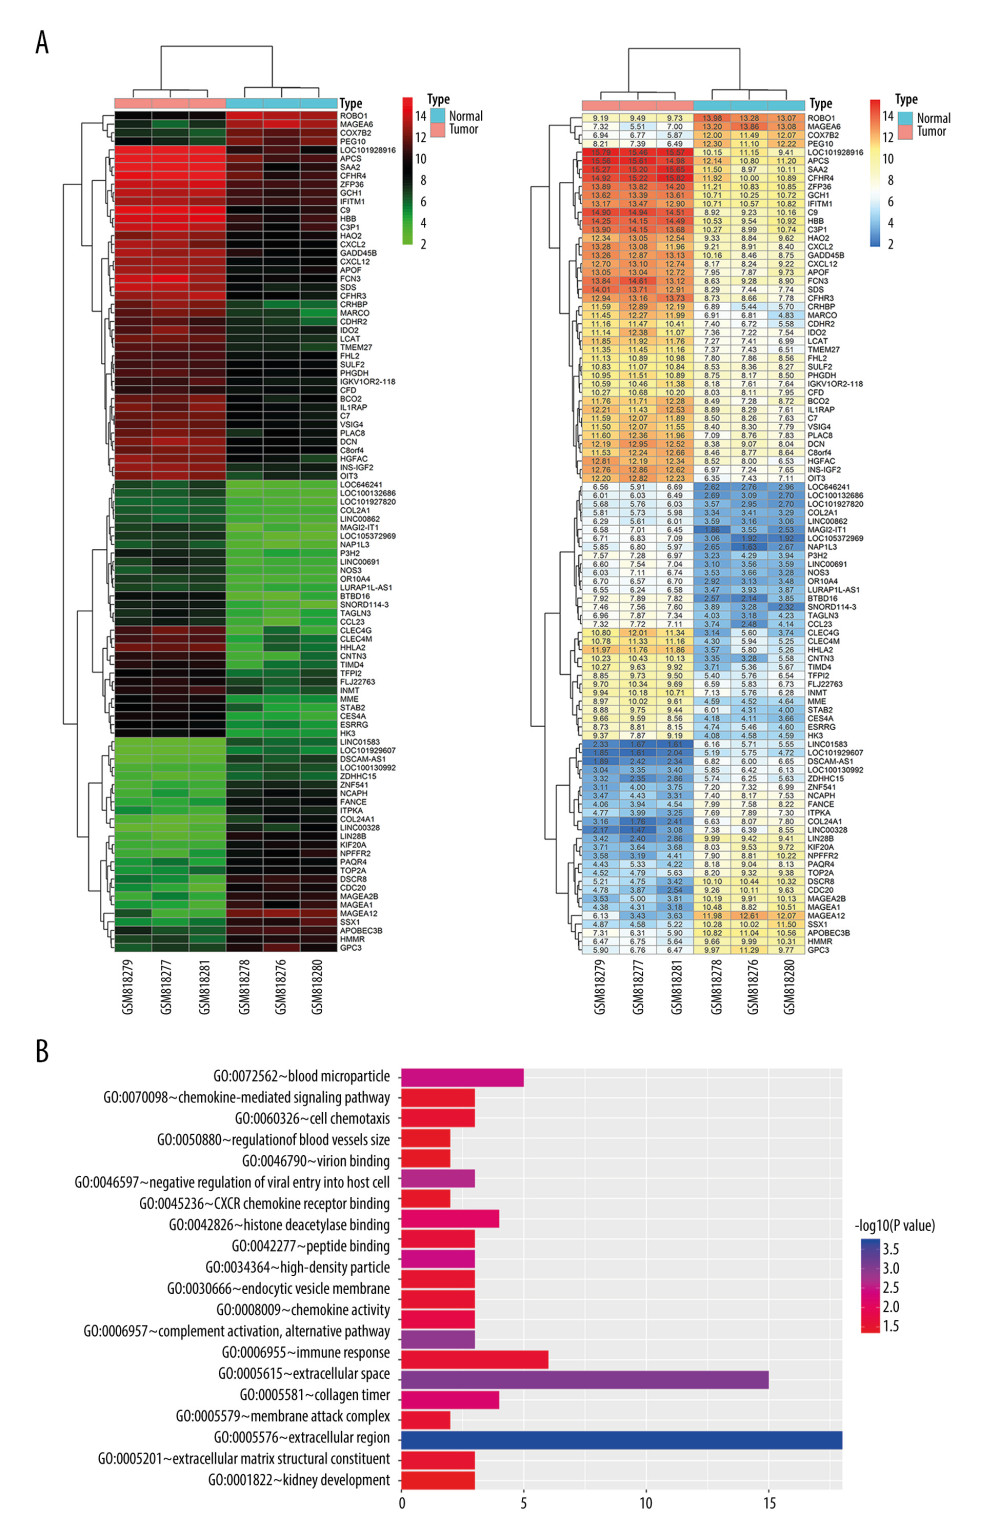 Figure 1. Bioinformatic analysis of HHLA2 expression in hepatocellular carcinoma. (A) Heat map of genes differentially expressed between cancer and normal tissue from the data set GSE33006. (B) Gene ontology analysis of genes from panel A.
 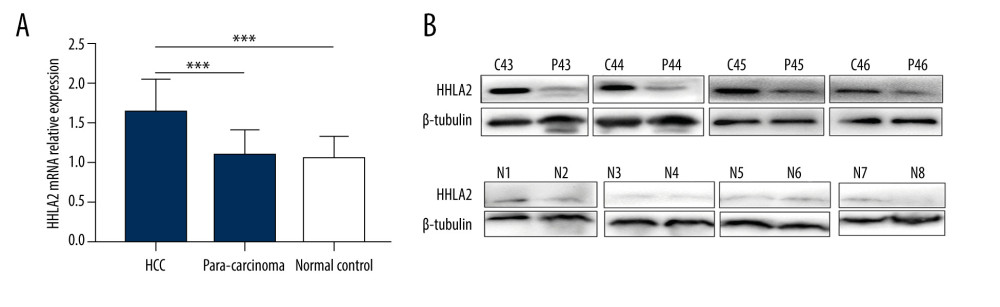 Figure 2. HHLA2 mRNA and protein are significantly upregulated in hepatocellular carcinoma tissues. Hepatocellular carcinoma (HCC) tissue, para-carcinoma tissue, and normal liver tissue were analyzed from patients in our retrospective cohort. (A) HHLA2 mRNA expression was significantly higher in the HCC tissues than in the para-carcinoma tissues and normal liver tissues (both *** P<0.001). (B) Respective cases by western blot showing HHLA2 protein levels in paired samples of HCC tissues (C43–C46), para-carcinoma tissues (P43–P46), and normal liver tissues (N1–N8).
 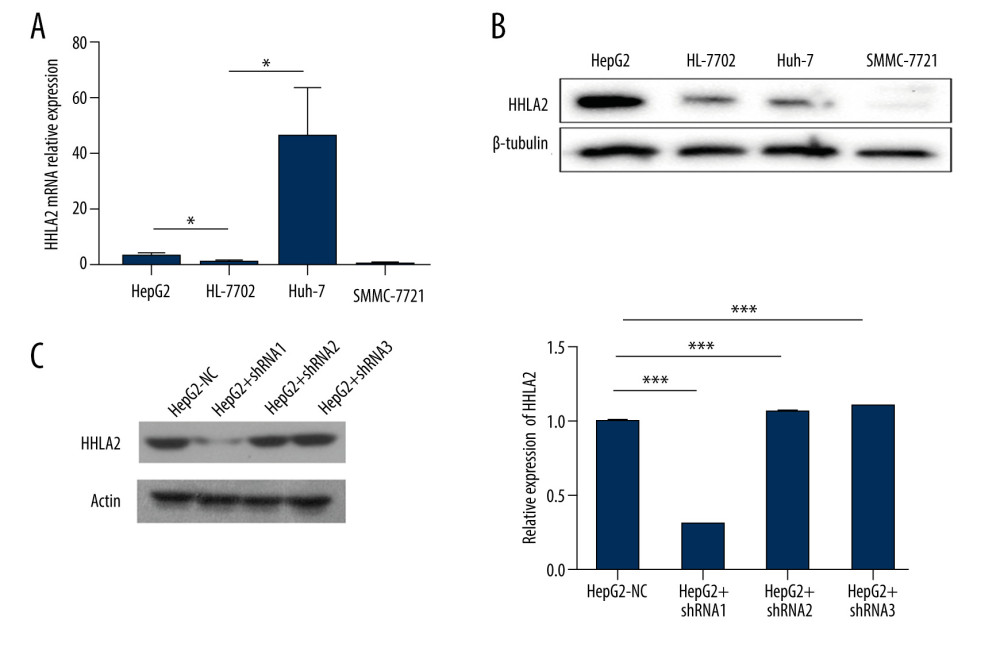 Figure 3. Hepatocellular carcinoma cell line screening. Hepatocellular carcinoma cell lines HepG2, SMMC-7721, and Huh-7 were screened for HHLA2 expression. HL-7702 cells were used as normal liver cells. (A) Relative HHLA2 mRNA levels based on qRT-PCR assay. * P<0.05. (B) Western blot analysis of HHLA2 protein. β-tubulin was used as an endogenous control. (C) HepG2 cells were transfected with lentivirus expressing 1 of 3 shRNAs targeting HHLA2 or a control shRNA, and HLLA2 knockdown efficiency was measured after 48 h by western blotting. HepG2+shRNA 1 caused the strongest knockdown (*** P<0.001). Actin was used as an endogenous control.
 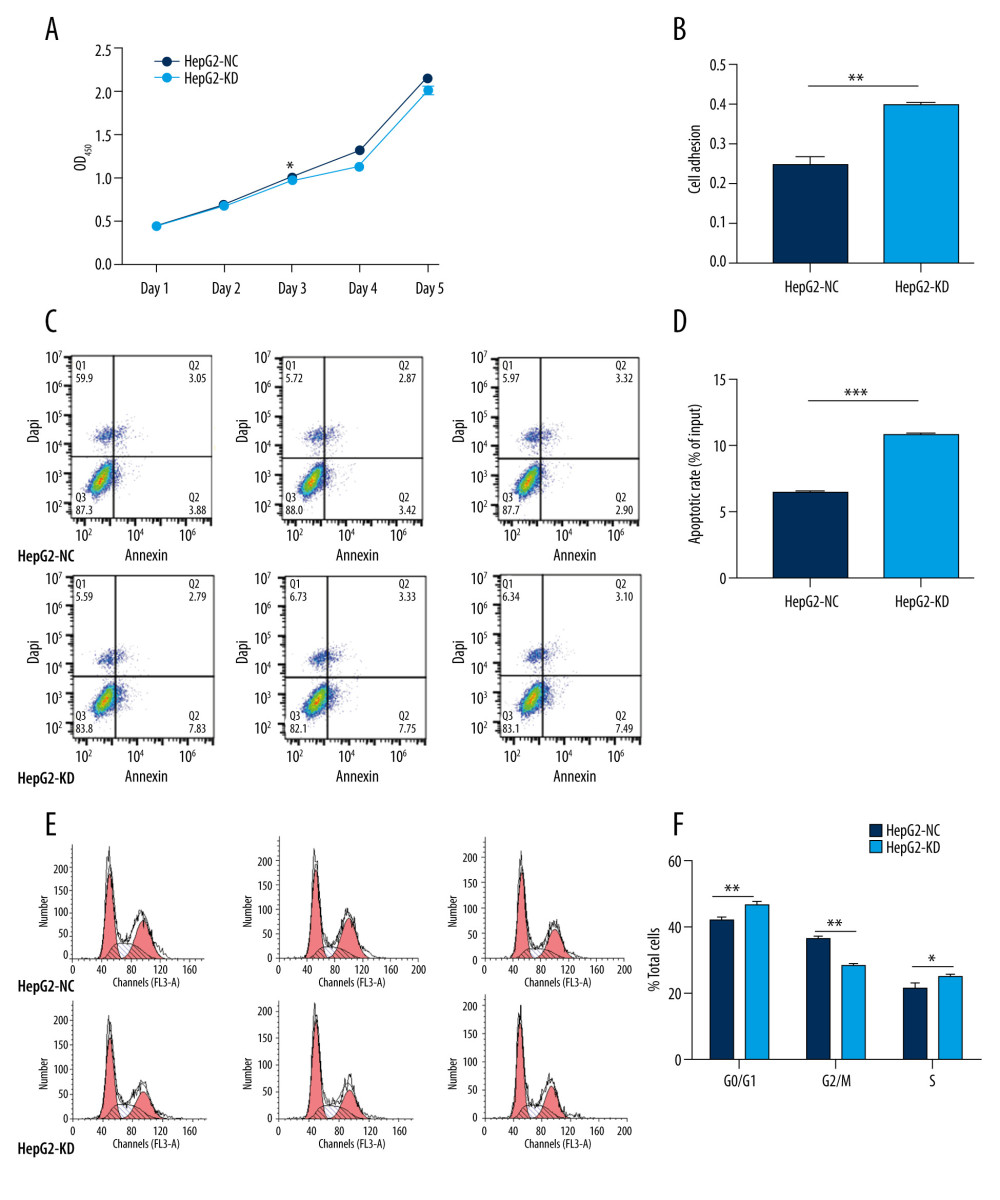 Figure 4. In vitro knockdown of HHLA2 in HepG2 cells. HepG2 cells were transfected with lentivirus expressing HHLA2-targeting shRNA 1 (HepG2-KD) or control shRNA (HepG2-NC). (A) Cell proliferation was measured over time using the CCK-8 assay. * P<0.05. (B) Cell adhesion was measured as HepG2-KD group (0.400±0.009) compared with HepG2-NC group (0.247±0.034). ** P<0.01. (C) Flow cytometry dot plots showing apoptosis rates. (D) Quantification of apoptosis rates of HepG2-KD group (10.777±0.306) compared with HepG2-NC group (6.437±0.237). *** P<0.001. (E) Histograms showing numbers of cells in different stages of the cell cycle. (F) Quantification of percent of total cells in each stage of the cell cycle. * P<0.05, ** P<0.01.
 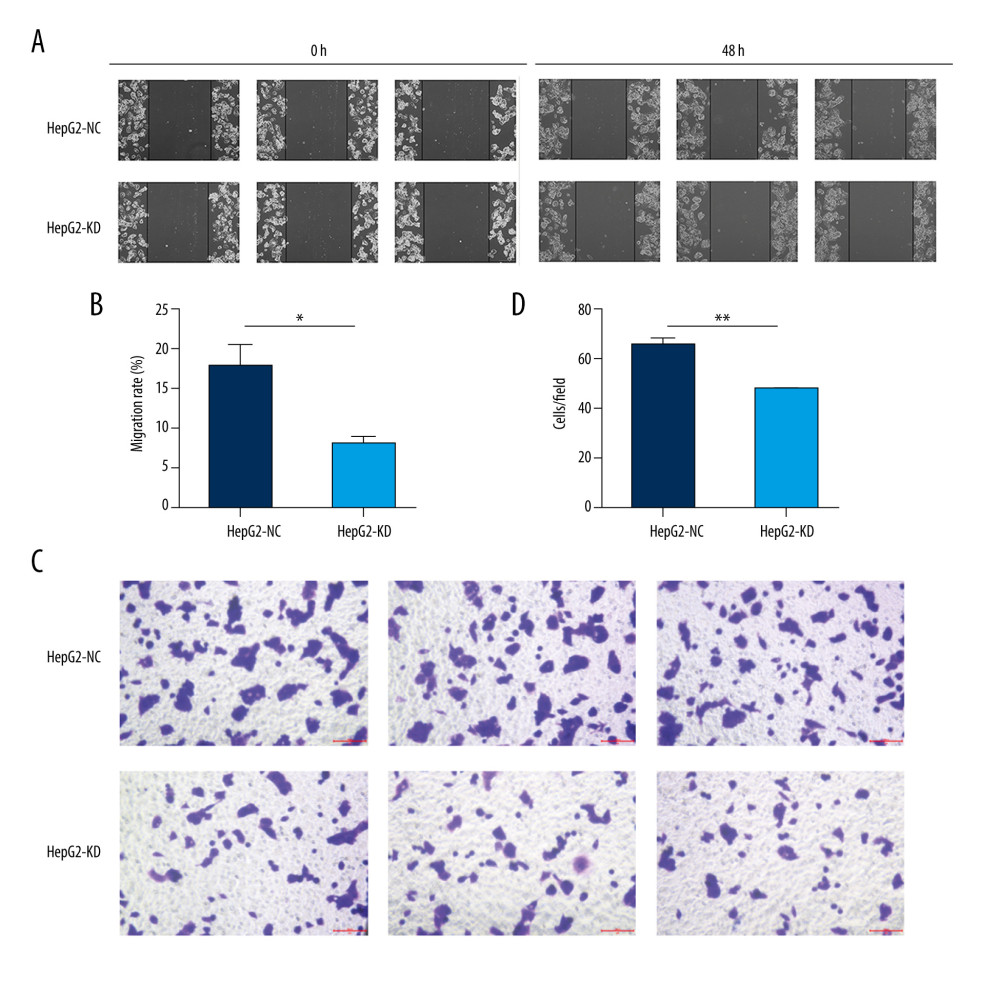 Figure 5. Migration and invasion in HepG2 cells after knockdown of HHLA2. (A, B) Light micrographs images from the wound healing assay at 0 and 48 h and quantification of percent migration at 48 h. * P<0.05. (C, D) A transwell migration assay was performed, and cells in the lower chamber were stained with 1% crystal violet and quantified. Three fields were counted per well. ** P<0.01.
 References
1. Rawla P, Sunkara T, Muralidharan P, Raj JP, Update in global trends and aetiology of hepatocellular carcinoma: Contemp Oncol (Pozn), 2018; 22; 141-50
2. Bray F, Ferlay J, Soerjomataram I, Global cancer statistics 2018: GLOBOCAN estimates of incidence and mortality worldwide for 36 cancers in 185 countries: Cancer J Clin, 2018; 68; 394-424
3. Hato T, Goyal L, Greten TF, Immune checkpoint blockade in hepatocellular carcinoma: Current progress and future directions: Hepatology, 2014; 60; 1776-82
4. Zhao R, Chinai JM, Buhl S, HHLA2 is a member of the B7 family and inhibits human CD4 and CD8 T-cell function: Proc Natl Acad Sci USA, 2013; 110; 9879-84
5. Zhu Y, Yao S, Iliopoulou BP, B7–H5 costimulates human T cells via CD28H: Nat Commun, 2013; 4; 2043
6. Janakiram M, Chinai JM, Fineberg S, Expression, clinical significance, and receptor identification of the newest B7 family member HHLA2 protein: Clin Canc Res, 2015; 21; 2359-66
7. Cheng H, Janakiram M, Borczuk A, HHLA2, a new immune checkpoint member of the B7 family, is widely expressed in human lung cancer and associated with egfr mutational status: Clin Canc Res, 2017; 23; 825-32
8. Koirala P, Roth ME, Gill J, HHLA2, a member of the B7 family, is expressed in human osteosarcoma and is associated with metastases and worse survival: Sci Rep, 2016; 6; 31154
9. Lin G, Ye H, Wang J, Chen S, Immune checkpoint human endogenous retrovirus-H long terminal repeat-associating protein 2 is upregulated and independently predicts unfavorable prognosis in bladder urothelial carcinoma: Nephron, 2019; 141; 256-64
10. Huang Y, Chen HC, Chiang CW, Identification of a two-layer regulatory network of proliferation-related microRNAs in hepatoma cells: Nucleic Acids Res, 2012; 40; 10478-93
11. Janakiram M, Chinai JM, Zhao A, HHLA2 and TMIGD2: New immunotherapeutic targets of the B7 and CD28 families: Oncoimmunology, 2015; 4; e1026534
12. Yau T, Kang YK, Kim TY, Nivolumab (NIVO)+ipilimumab (IPI) combination therapy in patients (pts) with advanced hepatocellular carcinoma (aHCC): Results from CheckMate 040: J Clin Oncol, 2019; 37; 4012
13. Chen Z, Shen S, Peng B, Tao J, Intratumoral GM-CSF microspheres and CTLA-4 blockade enhance the antitumor immunity induced by thermal ablation in a subcutaneous murine hepatoma model: Int J Hyperthermia, 2009; 25; 374-82
14. Roth GS, Decaens T, Liver immunotolerance and hepatocellular carcinoma: Patho-physiological mechanisms and therapeutic perspectives: Eur J Cancer, 2017; 87; 101-12
15. Palucka AK, Coussens LM, The basis of oncoimmunology: Cell, 2016; 164; 1233-47
16. Zhu Z, Dong W, Overexpression of HHLA2, a member of the B7 family, is associated with worse survival in human colorectal carcinoma: Onco Targets Ther, 2018; 11; 1563-70
17. Jing CY, Fu YP, Yi Y, HHLA2 in intrahepatic cholangiocarcinoma: An immune checkpoint with prognostic significance and wider expression compared with PD-L1: J Immunother Canc, 2019; 7; 77
18. Singh AK, Kumar R, Pandey AK, Hepatocellular carcinoma: Causes, mechanism of progression and biomarkers: Curr Chem Genom Transl, 2018; 12; 9-26
19. Rieder SA, Wang J, White N, B7-H7 (HHLA2) inhibits T-cell activation and proliferation in the presence of TCR and CD28 signaling: Cell Mol Immunol, 2020 [Online ahead of print]
20. Zan D, Du X, Wang K, Effects of intercellular adhesion of tumor on immune escape: J Med Biomech, 2019; 34; 145-52
21. Chen L, Zhu D, Feng J, Overexpression of HHLA2 in human clear cell renal cell carcinoma is significantly associated with poor survival of the patients: Cancer Cell Int, 2019; 19; 101
Figures
Figure 1. Bioinformatic analysis of HHLA2 expression in hepatocellular carcinoma. (A) Heat map of genes differentially expressed between cancer and normal tissue from the data set GSE33006. (B) Gene ontology analysis of genes from panel A.Figure 2. HHLA2 mRNA and protein are significantly upregulated in hepatocellular carcinoma tissues. Hepatocellular carcinoma (HCC) tissue, para-carcinoma tissue, and normal liver tissue were analyzed from patients in our retrospective cohort. (A) HHLA2 mRNA expression was significantly higher in the HCC tissues than in the para-carcinoma tissues and normal liver tissues (both *** P<0.001). (B) Respective cases by western blot showing HHLA2 protein levels in paired samples of HCC tissues (C43–C46), para-carcinoma tissues (P43–P46), and normal liver tissues (N1–N8).Figure 3. Hepatocellular carcinoma cell line screening. Hepatocellular carcinoma cell lines HepG2, SMMC-7721, and Huh-7 were screened for HHLA2 expression. HL-7702 cells were used as normal liver cells. (A) Relative HHLA2 mRNA levels based on qRT-PCR assay. * P<0.05. (B) Western blot analysis of HHLA2 protein. β-tubulin was used as an endogenous control. (C) HepG2 cells were transfected with lentivirus expressing 1 of 3 shRNAs targeting HHLA2 or a control shRNA, and HLLA2 knockdown efficiency was measured after 48 h by western blotting. HepG2+shRNA 1 caused the strongest knockdown (*** P<0.001). Actin was used as an endogenous control.Figure 4. In vitro knockdown of HHLA2 in HepG2 cells. HepG2 cells were transfected with lentivirus expressing HHLA2-targeting shRNA 1 (HepG2-KD) or control shRNA (HepG2-NC). (A) Cell proliferation was measured over time using the CCK-8 assay. * P<0.05. (B) Cell adhesion was measured as HepG2-KD group (0.400±0.009) compared with HepG2-NC group (0.247±0.034). ** P<0.01. (C) Flow cytometry dot plots showing apoptosis rates. (D) Quantification of apoptosis rates of HepG2-KD group (10.777±0.306) compared with HepG2-NC group (6.437±0.237). *** P<0.001. (E) Histograms showing numbers of cells in different stages of the cell cycle. (F) Quantification of percent of total cells in each stage of the cell cycle. * P<0.05, ** P<0.01.Figure 5. Migration and invasion in HepG2 cells after knockdown of HHLA2. (A, B) Light micrographs images from the wound healing assay at 0 and 48 h and quantification of percent migration at 48 h. * P<0.05. (C, D) A transwell migration assay was performed, and cells in the lower chamber were stained with 1% crystal violet and quantified. Three fields were counted per well. ** P<0.01. Tables
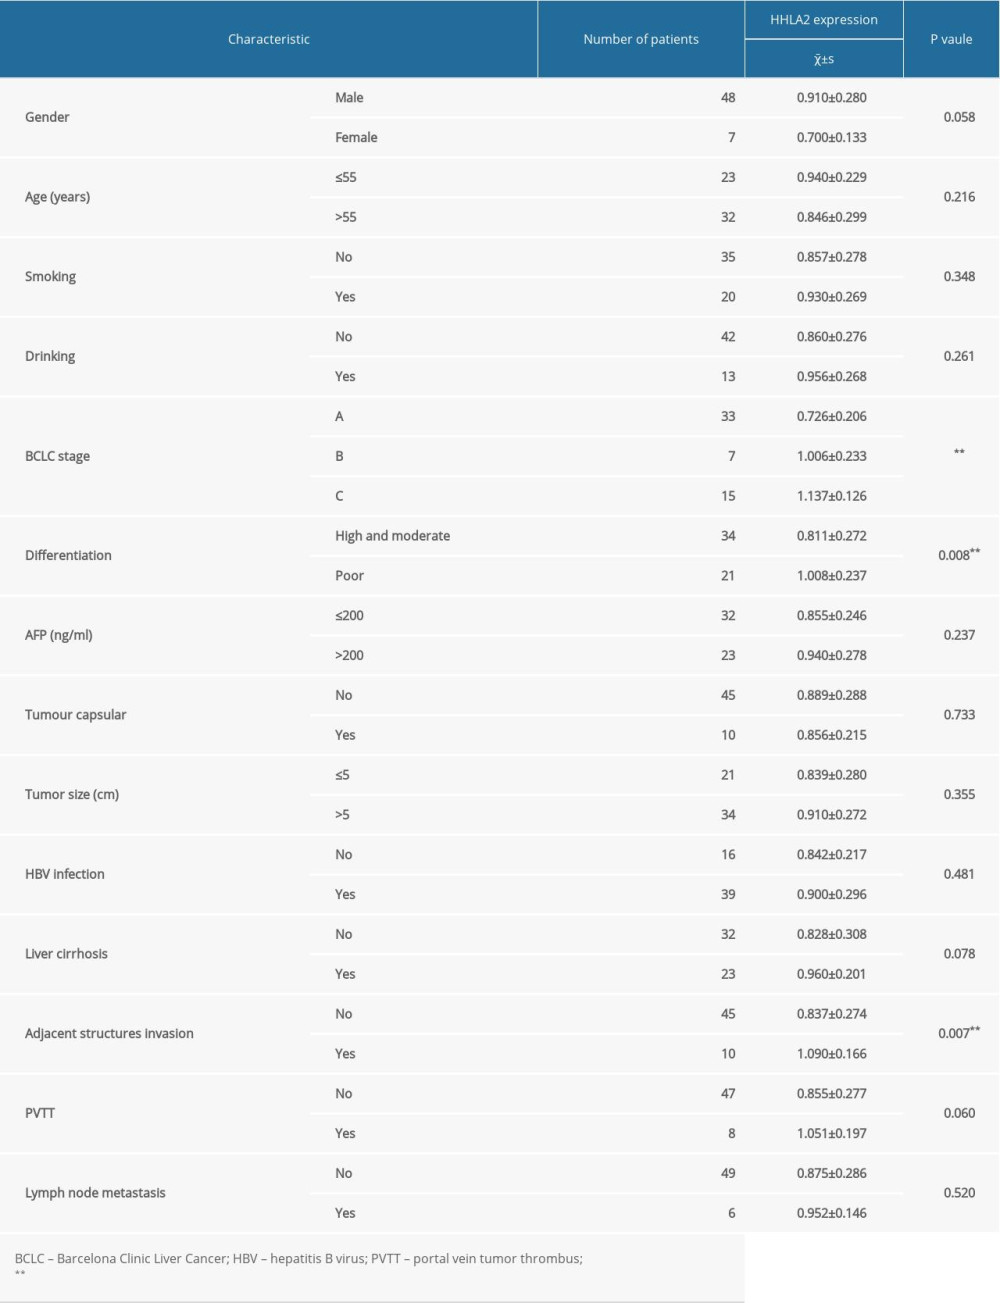 Table 1. Summary of the clinicopathological characteristics of patients with hepatocellular carcinoma and HHLA2 protein expression.
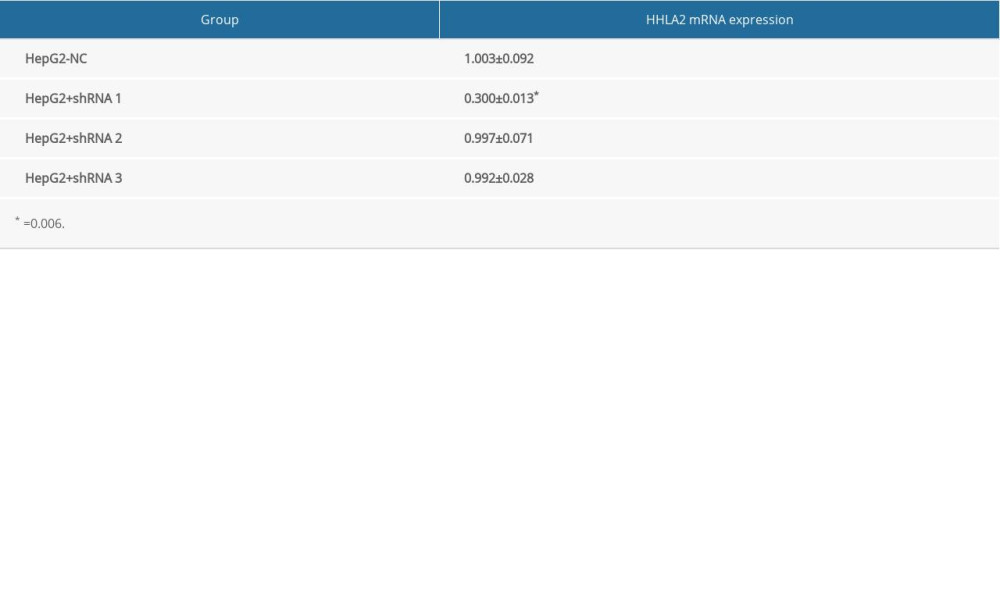 Table 2. The expression level of HHLA2 mRNA in HepG2 cells.Table 1. Summary of the clinicopathological characteristics of patients with hepatocellular carcinoma and HHLA2 protein expression.Table 2. The expression level of HHLA2 mRNA in HepG2 cells.
 In Press
Clinical Research
Comparative Effectiveness of a Nurse-Led Care Model vs Usual Care in Rheumatoid Arthritis: A Longitudinal C...Med Sci Monit In Press; DOI: 10.12659/MSM.953211
Clinical Research
Impact of Treatment Modality on Pain, Sexual Function, and Psychological Well-Being in Patients With Bartho...Med Sci Monit In Press; DOI: 10.12659/MSM.952422
Clinical Research
Association Between Radiographic Knee Osteoarthritis, Pre-Fracture Mobility, and Hip Fracture Patterns in O...Med Sci Monit In Press; DOI: 10.12659/MSM.952678
Clinical Research
Association Between Total Cholesterol–to–High-Density Lipoprotein Ratio and Gestational Hypertension: A Cas...Med Sci Monit In Press; DOI: 10.12659/MSM.952395
Most Viewed Current Articles
17 Jan 2024 : Review article 14,176,084
Vaccination Guidelines for Pregnant Women: Addressing COVID-19 and the Omicron VariantDOI :10.12659/MSM.942799
Med Sci Monit 2024; 30:e942799
13 Nov 2021 : Clinical Research 3,757,530
Acceptance of COVID-19 Vaccination and Its Associated Factors Among Cancer Patients Attending the Oncology ...DOI :10.12659/MSM.932788
Med Sci Monit 2021; 27:e932788
14 Dec 2022 : Clinical Research 2,466,116
Prevalence and Variability of Allergen-Specific Immunoglobulin E in Patients with Elevated Tryptase LevelsDOI :10.12659/MSM.937990
Med Sci Monit 2022; 28:e937990
16 May 2023 : Clinical Research 708,768
Electrophysiological Testing for an Auditory Processing Disorder and Reading Performance in 54 School Stude...DOI :10.12659/MSM.940387
Med Sci Monit 2023; 29:e940387