08 September 2021: Animal Study
Pseudolaric Acid B Attenuates High Salt Intake-Induced Hypertensive Left Ventricular Remodeling by Modulating Monocyte/Macrophage Phenotypes
Fang-Fang Yu1BE, Guo-Hong Yang1AG*, Shao-Bo Chen1FG, Xiu-Long Niu1F, Wei Cai1CF, Yan-Yan Tao1C, Xiu-Juan Wang1BC, Ming Li1BF, Yu-Ming Li2DG, Ji-Hong Zhao3ADDOI: 10.12659/MSM.932404
Med Sci Monit 2021; 27:e932404
Abstract
BACKGROUND: Studies in ApoE knockout mice have shown that pseudolaric acid B (PB) can act as an immunomodulatory drug and attenuate atherosclerosis progression by modulating monocyte/macrophage phenotypes. Our previous study demonstrated that high salt intake could shift the phenotype of monocytes/macrophages to an inflammatory phenotype, and that this shift was related to hypertension and hypertensive left ventricular (LV) remodeling. However, no comprehensive assessment of the effects of PB on hypertensive LV remodeling has been conducted.
MATERIAL AND METHODS: In this study, RAW264.7 macrophages cultured with different concentrations of NaCl were used to investigate the modulating effects of PB on macrophage phenotype. Furthermore, N-nitro-L-arginine methyl ester hypertensive mice were used to investigate the modulating effects of PB on monocyte phenotype. LV remodeling was investigated by echocardiography. LV morphologic staining (for cardiomyocyte hypertrophy and collagen deposition) was performed at the time of sacrifice.
RESULTS: The results showed that PB significantly improved the viability of RAW264.7 cells, suppressed their phagocytic and migration abilities, and inhibited their phenotypic shift to M1 macrophages. In addition, the blood pressure of PB-treated mice was significantly decreased relative to that of control mice. Furthermore, after PB treatment, the percentage of Ly6Chi monocytes was significantly decreased while that of Ly6Clo monocytes was apparently increased. Moreover, PB preserved LV function and alleviated myocardial fibrosis and cardiomyocyte hypertrophy as measured at the end of the experimental period. The transfer of monocytes from PB-treated mice to hypertensive mice achieved the same effects.
CONCLUSIONS: Together, these findings indicate that PB exerts its protective effects on hypertensive LV remodeling by modulating monocyte/macrophage phenotypes and warrants further investigation.
Keywords: Hypertension, Macrophages, Monocytes, Ventricular Remodeling, Animals, Diterpenes, Drugs, Chinese Herbal, Echocardiography, Heart Ventricles, Mice, Phagocytosis, Phenotype, RAW 264.7 Cells, Sodium Chloride
Background
Ample evidence has shown that long-term high salt (HS) intake is an important environmental factor involved in the aggravation of hypertension and related cardiovascular diseases [1–3]. Recent studies have demonstrated that high salt (HS) loading can not only induce hypertension but detrimentally influence target organs independent of its effects on blood pressure (BP) [4–6]. As an important part of the body’s innate immune system, monocytes/macrophages play important roles in anti-inflammation, tumor inhibition, and immune regulation. Macrophage infiltration in hypertensive target organs has been reported in animal model studies [7–9]. In addition, in hypertension, the degree of macrophage infiltration is positively correlated with the degree of target organ damage. However, the detailed mechanism remains unclear.
In mice, circulating monocytes are divided into 2 subsets: Ly6Chi (Ly6C+, equivalent to the CD43+ monocytes of rats and the CD14++CD16− monocytes of humans) and Ly6Clo (Ly6C−, equivalent to the CD43++ monocytes of rats and the CD14++CD16++ monocytes of humans). Ly6Chi monocytes, which can differentiate into M1 macrophages under conditions of inflammation and infection, play important roles in inflammation, phagocytosis, and bacterial clearance. Ly6Clo monocytes, which can differentiate into M2 macrophages, play important roles in injury repair, tissue remodeling, and immune regulation [10–13]. A previous study demonstrated that HS can shift the phenotypes of monocytes/macrophages to an inflammatory phenotype. This change was found to be associated with hypertensive left ventricular (LV) remodeling, suggesting that it may play an important role in the progression of hypertension and related target organ damage [14,15].
Pseudolaric acid B (PB) is a diterpene acid extracted from the root bark of
Material and Methods
CELL CULTURE:
RAW264.7 macrophages (a murine macrophage cell line) were obtained from the American Type Culture Collection (ATCC, TIB-71) and cultured in high-glucose Dulbecco’s modified Eagle’s medium containing 120 mL/L fetal bovine serum and 4 mmol/L l-glutamine and placed in a 37°C, 50 mL/L CO2 incubator. After 24 h of incubation, the cells were divided into a control group, an LS (20 mmol/L NaCl) treatment group, an HS (HS, 40 mmol/L NaCl) treatment group, and an HS+PB (50 nmol/L) treatment group. Cells were collected for subsequent experiments after 24 and 48 h of intervention.
CELL VIABILITY MEASUREMENT:
Cells in the logarithmic growth phase were seeded at a density of 1×10³ cells/well in 96-well plates, with 5 replicate wells per group for 24 and 48 h. After the addition of Cell Counting Kit-8 (CCK-8) and incubation for 2 h in an incubator, a plate reader was used to measure the optical density (OD) at 450 nm. Cell viability was calculated as: cell viability (%)=(intervention cell OD–blank OD)/(control cell OD–blank OD).
CELL PHAGOCYTOSIS ASSAY:
The EZCell™ Phagocytosis Assay Kit (Biovision, California, USA) was used for cell phagocytosis determination. Briefly, logarithmic growth phase cells were incubated for 24 and 48 h, digested, and centrifuged, and the supernatant was discarded. After the addition of 200 μL of medium and 5 μL of Green Zymosan to each well, the cells were resuspended and incubated for 2 h. The cells were then centrifuged and resuspended again, and 300 μL of phagocytosis buffer was added to each well. Then, the cells were washed 3 times, and resuspended in 1 mL of phagocytosis buffer for flow cytometry determination. The experiment was repeated 3 times.
CELL MIGRATION ASSAY:
An 8-μm transwell chamber (Costar, Texas, USA) was used for cell migration determination. First, 600 μL of complete medium containing 10% fetal bovine serum was added to the lower chamber, and 200 μL (1×10⁵) of serum-free resuspended cells was added to the upper chamber. The cells were then cultured in a 37°C, 5% CO2 incubator for 24 and 48 h. Next, the chamber was removed from the incubator, and the cells on the upper surface of the chamber were removed with a wet cotton swab and fixed in absolute ethanol for 10 min. Subsequently, the cells were stained with 1 g/L of crystal violet for 30 min and then washed with phosphate-buffered saline. The cells on the lower surface of the polycarbonate membrane were then counted under a microscope (TE2000, Nikon, Tokyo, Japan). Ten fields of view were randomly selected and the average cell number was calculated for analysis.
ANIMALS:
Six-week-old C57BL/6 mice were purchased from Aochen Laboratory Animal Sales Co., Ltd. (Tianjin, China). Mice were maintained on a dark/light cycle (12/12 h) in air-conditioned rooms (23±1°C, 55±5% humidity) and were acclimatized to the local conditions for 1 week before the study. All of the procedures were performed in agreement with national and international laws and policies and were approved by the Institutional Animal Care and Ethics Committee of Characteristic Medical Center of the Chinese People’s Armed Police Forces.
After the 1-week adaptation period, the mice were divided into 4 groups: an LS diet group (1.0% NaCl, n=10), an HS diet group (8.0% NaCl, n=10), an HS+N-nitro-l-arginine methyl ester group (HS+L-NAME, n=20), and an HS+L-NAME+PB group (n=30). According to treatment, the mice were given a 1.0% (LS) or 8.0% (HS) NaCl diet for the ensuing 12 weeks. L-NAME, which can increase the hypertensive effect of HS, was prepared with saline at a concentration of 10 mg/mL and administered to mice by intraperitoneal injection at a dosage of 50 mg/kg/d. PB was dissolved in saline at a concentration of 1 mg/mL and administered to mice by gavage at a dosage of 5 mg/kg/d. All mice were permitted free access to chow and tap water. BP was dynamically measured in conscious mice using the tail-cuff method as previous described [19].
FLOW CYTOMETRY ANALYSIS OF THE PHENOTYPE OF CIRCULATING MONOCYTES:
To observe the effects of PB on the phenotype of circulating monocytes, flow cytometry analysis was performed as previously reported [20,21]. Subsets of circulating monocytes were assessed using blood anti-coagulated with ethylenediaminetetraacetic acid immediately after collection and maintained at room temperature for the entire staining procedure. Whole blood cell suspensions were stained with anti-mouse Ly6G-PerCP/Cy5.5 (clone 1A8), anti-mouse CD11b-PE (clone M1/70), and anti-mouse Ly6C-FITC (clone HK1.4) and their isotypes IgG2a-PerCP/Cy5.5, IgG2b-PE, and IgG2c-FITC, followed by an incubation period of 30 min at room temperature in the dark. After red blood cell lysis, the samples were subjected to flow cytometry with a Cytomics FC500 instrument (Beckman Coulter, Miami, FL, USA) and analyzed with FlowJo software (TreeStar, Ashland, OR, USA).
ADOPTIVE TRANSFER EXPERIMENTS WITH MONOCYTES:
From the ninth week after HS loading, peripheral blood monocytes (PBMs) from mice of the HS+L-NAME+PB group were sorted and transferred to mice of the HS+L-NAME group (HS+L-NAME+PBM, n=10) for the remaining 4 weeks of the 12-week dietary intervention. The PBMs were sorted using Ly6G-PerCP/Cy5.5 (clone 1A8) and anti-mouse CD11b-PE (clone M1/70) on a BD FACS Aria Flow Cytometry Sorting System (BD Biosciences, San Jose, CA, USA). They were then incubated in a 37°C, 5% CO2 incubator for 4 h and then prepared into a monocyte suspension. The mice of the HS+L-NAME+PBM group were administered 0.2 mL of monocyte suspension via tail vein, which was injected at 1-week intervals 4 times in total.
QUANTITATIVE REAL-TIME POLYMERASE CHAIN REACTION:
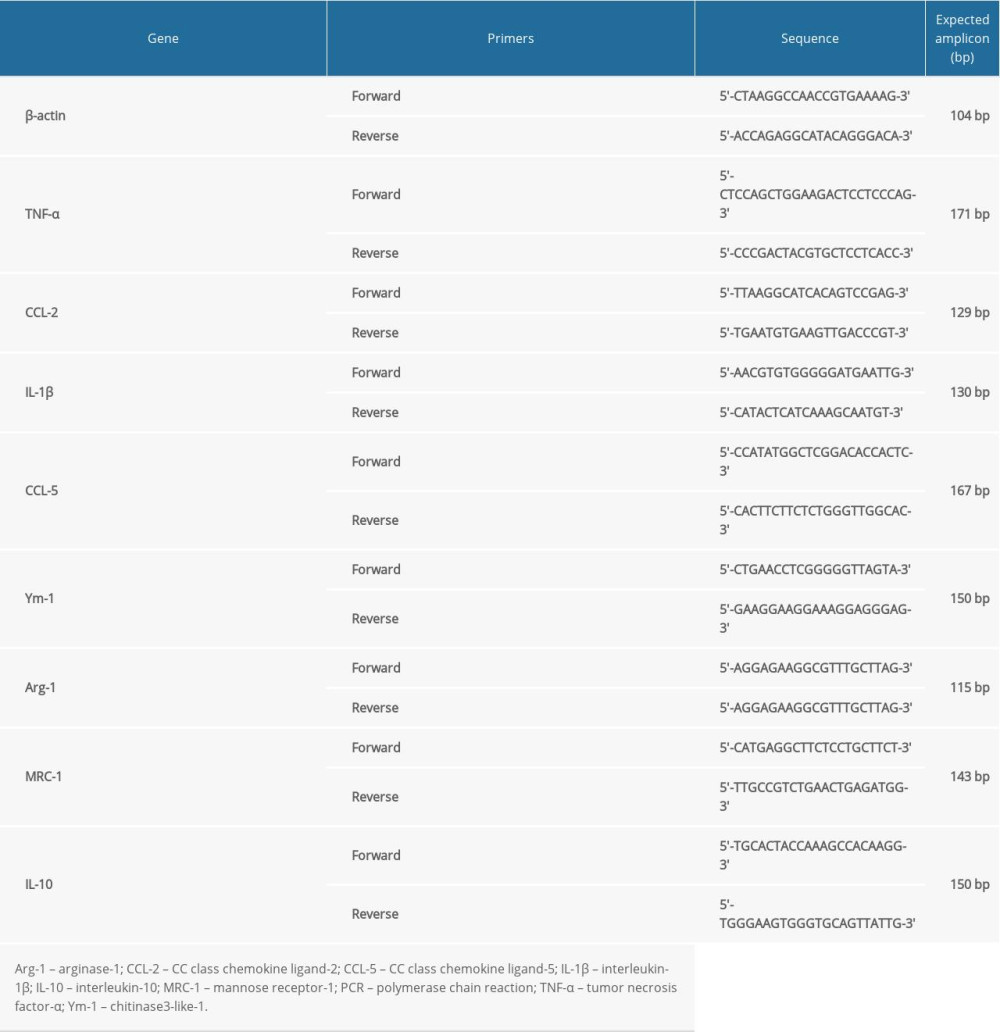
Total RNA from RAW264.7 macrophages and heart tissue was isolated using TRIzol reagent (Takara Bio. Inc., Kyoto, Japan) according to the manufacturer’s recommendations. RNA purity was assessed by the 260/280 nm ratio, and total RNA (2 μg) was reverse-transcribed into cDNA using a reverse transcription assay (Promega, Madison, WI, USA) in 25-μL reaction volumes according to the manufacturer’s instructions. Real-time polymerase chain reaction (PCR) was performed with a QuantiFast SYBR® Green PCR Kit (Roche Diagnostics, Indianapolis, IN, USA) on an ABI Prism 7300 sequence detection system (Applied Biosystems, Foster City, CA, USA). The primer sequences used for real-time PCR are shown in Table 1. The conditions for amplification were as follows: 95°C for 10 min, followed by 40 cycles at 95°C for 15 s and 60°C for 60 s. Relative expression of real-time PCR products was normalized to the expression of β-actin and expressed as the transcript fold change relative to that of the control group using the 2−ΔΔCt method [22].
ECHOCARDIOGRAPHY:
At the end of the experimental period, all animals were anesthetized (with isoflurane, 2% induction and 1.5% maintenance) and examined noninvasively using an echocardiographic system equipped with a MS-550D transducer (Visual Sonics Vevo 2100 ultrasound system, Toronto, Canada). Two-dimensional guided M-mode echocardiography was performed to evaluate the LV end-diastolic diameter (LVEDD), the LV end-systolic diameter (LVESD), the LV posterior wall diastolic thickness (LVPWD), the LV end-diastolic volume (LVEDV), and the LV end-systolic volume (LVESV). The LV fractional shortening (LVFS) and LV ejection fraction (LVEF) were calculated as: LVFS (%)=[(LVEDD–LVESD)/LVEDD]×100 and LVEF (%)=[(LVEDV–LVESV)/LVEDV]×100, as previously described [23]. All the data were averaged from 3 consecutive cycles. An experienced sonographer, blind to the study, collected the data.
HISTOLOGICAL ANALYSIS:
All heart tissues were incubated in 4% formalin, embedded in paraffin, and sectioned into 5-μm slices for histological analysis. Masson staining was performed to observe LV collagen deposition as previously described [24]. The sections were visualized and imaged on a microscope (E600POL, Nikon, Tokyo, Japan), and the average collagen volume fraction (CVF) was calculated for further analysis. The cardiomyocyte cross-sectional area of the left ventricle was stained with tetramethylrhodamine isothiocyanate-labeled wheat germ agglutinin (Invitrogen, Grand Island, NY, USA). The nuclei were counterstained with 4,6-diamidino-2-phenylindole (Vector Laboratories, Burlingame, CA, USA). The sections were visualized on a fluorescence microscope (80i, Nikon, Tokyo, Japan) and imaged for further analysis as previously described [9].
STATISTICAL ANALYSIS:
Data are presented as the mean±SD. The normal distribution of the data was estimated using the Kolmogorov-Smirnov test. Data were compared among groups using 1-way ANOVA followed by post hoc analysis with the Bonferroni test. A 2-tailed
Results
PB REDUCES THE EFFECTS OF HS ON MACROPHAGE VIABILITY:
As shown in Figure 1, after 24 and 48 h of HS stimulation, macrophage viability was significantly decreased compared with that in the corresponding control groups (all P<0.05). PB markedly mitigated the effects after HS on macrophage viability of 24 h of stimulation (Figure 1A, P<0.05). However, the macrophage viability in the PB treatment group did not significantly differ from that in the HS group, although a trend of higher viability in the PB group was observed (P>0.05, Figure 1B).
PB INHIBITS HS-INDUCED ENHANCEMENTS OF MACROPHAGE PHAGOCYTOSIS:
As shown in Figure 2, HS stimulation significantly increased the phagocytosis ability of macrophages at both 24 and 48 h compared with the level in the corresponding control groups (Figure 2C–2E, all P<0.05). However, in the PB-treated group, macrophage phagocytosis ability was apparently decreased at both 24 h and 48 h compared with the level in the HS groups (Figure 2C–2E, all P<0.05).
PB INHIBITS HS-INDUCED INCREASES IN MACROPHAGE MIGRATION ABILITY:
As shown in Figure 3, the migration ability of macrophages after HS stimulation was both markedly increased at both 24 and 48 h compared with the corresponding level in the control group (Figure 3A–3C, all P<0.05). However, PB significantly inhibited this effect at 24 and 48 h, as evidenced by comparison of migration ability in the HS group (Figure 3A–3C, all P<0.05).
EFFECTS OF PB ON HS-INDUCED MACROPHAGE DIFFERENTIATION INTO THE M1 PHENOTYPE:
The real-time reverse-transcription (RT)-PCR analysis showed that after 24 h of HS stimulation, the mRNA expression levels of M1 macrophage markers such as tumor necrosis factor-α (TNF-α), CC class chemokine ligand (CCL)-2, interleukin (IL)-1β, and CCL-5 were all significantly increased compared with the levels in the control group (all P<0.05, Figure 4A-4D), whereas those of the M2 macrophage markers chitinase3-like1 (Ym-1), arginase-1 (Arg-1), mannose receptor 1 (MRC-1), and IL-10 were all significantly decreased (all P<0.05, Figure 4E–4H). Compared with HS treatment alone, PB markedly decreased the mRNA expression levels of the M1 macrophage markers of TNF-α, CCL-2, IL-1β, and CCL-5 and increased those of M2 macrophage markers Ym-1, Arg-1, MRC-1, and IL-10 (all P<0.05, Figure 4A–4H).
CHANGES OF SYSTOLIC BP IN DIFFERENT GROUPS:
As demonstrated in Figure 5, the systolic BP levels of the HS diet groups gradually increased over time and were significantly higher than those of the LS group at both 8- and 12-week time points (all P<0.05). At end of 12 weeks, the systolic BP levels of the HS+L-NAME+PB and HS+L-NAME+PBM groups were both markedly decreased compared with those of the HS+L-NAME group (both P<0.05).
CHANGES IN THE PHENOTYPE OF PBMS AT DIFFERENT TIME POINTS:
As shown in Figure 6, the percentages of circulating Ly6Chi monocytes in the HS groups began to strongly and continuously increase after day 1 until peaking between day 3 and day 5; they then decreased, gradually plateauing after day 7 (Figure 6C, 6D). In addition, PB treatment significantly inhibited the increase in the percentage of Ly6Chi monocytes by day 3, as evidenced by comparison with the HS+L-NAME group (P<0.05, Figure 6C, 6D). In contrast, the percentages of Ly6Clo monocytes in the HS and HS+L-NAME groups initially decreased over time, reaching the lowest levels, and then gradually plateaued after day 7 (Figure 6C, 6F). In the PB-treated group, the percentages of Ly6Clo monocytes strongly and continuously increased up to day 5, being significantly higher than that in the HS and HS+L-NAME groups (all P<0.05), and then decreased until plateauing after day 7 (Figure 6C, 6F). No significant differences of the percentages of Ly6Cint monocytes were found in different groups at different time points (Figure 6C, 6E).
THE MRNA EXPRESSION LEVELS OF PHENOTYPIC MARKERS OF MACROPHAGES IN HEART TISSUE OF DIFFERENT GROUPS:
The real-time RT-PCR analysis demonstrated that the mRNA expression levels of the M1 macrophage markers TNF-α, CCL-2, IL-1β, and CCL-5 and the M2 macrophage markers Ym-1, Arg-1, and IL-10 were all significantly increased in the HS+L-NAME group compared with the LS group (all P<0.05, Figure7A–7H). However, in the PB-treated group, the mRNA expression levels of M1 macrophage markers of TNF-α, CCL-2, CCL-5, and IL-1β were all apparently decreased while the mRNA expression levels of M2 macrophage markers of Ym-1, Arg-1, MRC-1 and IL-10 were all markedly increased compared with HS+L-NAME group. Meanwhile, the HS+L-NAME+PBM group showed the same trend as PB-treated group (all P<0.05, Figure 7A–7H).
ECHOCARDIOGRAPHIC PARAMETERS OF DIFFERENT GROUPS:
As shown in Figure 8, the LV enlargement was more severe in the HS and HS+L-NAME groups than in the LS group as demonstrated by LVEDD; however, PB and PBM treatment significantly reduced this enlargement, as evidenced by comparison with the HS+L-NAME group (all P<0.05, Figure 8A). In addition, the LV systolic function of the HS+L-NAME group was markedly compromised compared with that of the LS group as shown by LVFS and LVEF; however, PB and PBM treatment obviously improved LV systolic function compared with that in the HS+L-NAME group (all P<0.05, Figure 8B, 8C). No significant differences in LVPWT at the end of the experimental period were observed, although trends for lower levels were observed in the PB- and PBM-treated group (P>0.05, Figure 8D).
PATHOLOGICAL STAINING FINDINGS:
Masson staining was performed to observe LV fibrosis. The HS+L-NAME group had greater collagen deposition than the LS and HS groups; however, PB and PBM treatment significantly improved LV fibrosis compared with that observed in the HS+L-NAME group (all P<0.05, Figure 9A, 9C). Wheat germ agglutinin staining showed that the cross-sectional area of the HS+L-NAME group was markedly increased compared with the values in the LS and HS groups; however, PB and PBM treatment alleviated cardiomyocyte hypertrophy compared with that observed in the HS+L-NAME group (all P<0.05, Figure 9B, 9D).
Discussion
In the present study, we used RAW264.7 macrophages stimulated with different concentrations of NaCl and HS-induced L-NAME hypertensive mice to investigate the effects of PB on hypertensive LV remodeling. We found that (1) under HS stimulating conditions, PB could inhibit the differentiation of macrophages into an M1 phenotype, maintaining them as M2 macrophages; (2) PB increased the percentage of Ly6Clo monocytes and decreased the percentage of Ly6Chi monocytes in HS-induced L-NAME hypertensive mice; and (3) PB decreased BP and improved hypertensive LV remodeling in HS-induced L-NAME hypertensive mice.
The L-NAME-induced hypertensive rat model is a commonly used model in animal hypertension studies [25-27]. We revised the protocol and created L-NAME-induced hypertensive mice by administration of L-NAME at 50 mg/kg/d and an 8% NaCl diet. This hypertensive mouse model can not only rapidly develop hypertension, but also exhibits accelerated LV remodeling and early heart failure. In the present study, the systolic BP of the HS+L-NAME group was increased relative to that of the LS group by 22 mm Hg in 8 weeks and by 35.8 mm Hg at 12 weeks and accompanied by significant LV remodeling and compromised cardiac systolic function.
PB is a drug that can modulate the activities of immune cells. A previous study showed that PB can inhibit the inflammatory response and macrophage differentiation into the M1 phenotype in RAW264.7 macrophages induced by lipopolysaccharide via the NF-κB/PPARγ signaling pathway [18]. In the present study, we used different concentrations of NaCl to stimulate RAW264.7 macrophages and found that PB could significantly improve the viability of RAW264.7 macrophages, suppress their phagocytic and migration abilities, and inhibit their differentiation into M1 phenotypes. These results indicated that PB can inhibit the macrophage inflammatory phenotype, which might be beneficial for the treatment of HS intake-related cardiovascular diseases.
Monocyte and macrophage populations are heterogeneous in phenotype and function [12,28,29]. Binger et al [30] found that HS could inhibit the activation of bone marrow-derived mouse M2 macrophages and promote the proinflammatory M1 phenotype. In our previous study, we found that short-term increased dietary salt intake could induce the expansion of CD14++CD16+ monocytes, revealing the cellular basis of target organ inflammation caused by HS intake [31]. PB has been proved to be an immunomodulatory drug. By activating PPARγ, it not only increases the proportion of regulatory T cells and reduces the proportion of Th17 cells, and thereby inhibits inflammation, but it also inhibits the percentage of Ly6Chi monocytes and significantly decreases the volume of atherosclerotic plaque and lipid deposition in atherosclerotic vessels of ApoE−/− mice [18,32]. In the present study, we found that PB decreased the percentage of Ly6Chi monocytes and increased the percentage of Ly6Clo monocytes. Furthermore, we found that PB decreased the mRNA expression levels of M1 macrophage markers and increased those of M2 macrophage markers. Moreover, BP was markedly decreased in the PB-treated group, and LV remodeling and systolic function were significantly improved in the PB-treated group compared with the HS+L-NAME group, indicating that monocyte/macrophage phenotypic modulation not only inhibits the inflammatory response but also decreases BP and improves HS-induced hypertensive LV remodeling.
The present study has several limitations. First, the tail-cuff method for BP measurement is not well-suited for measuring diastolic pressure, and BP may be influenced by environmental factors such as temperature and noise. Second, although the present study investigated the effects of PB on HS-induced hypertensive LV remodeling, the mechanism remains unclear and needs further study. Third, in addition to regulating the phenotypes of monocytes/macrophages, PB has a variety of other biological effects, such as modulating the function of T lymphocytes [33]. The effects of PB on hypertensive LV remodeling observed in this study may be a combined effect of multiple factors. Thus, the influences of other PB-associated factors on hypertensive LV remodeling need study.
Conclusions
In conclusion, the present study demonstrated that PB could decrease BP and improve HS-induced hypertensive LV remodeling through modulating monocyte/macrophage phenotypes, which warrants for further investigation.
Figures
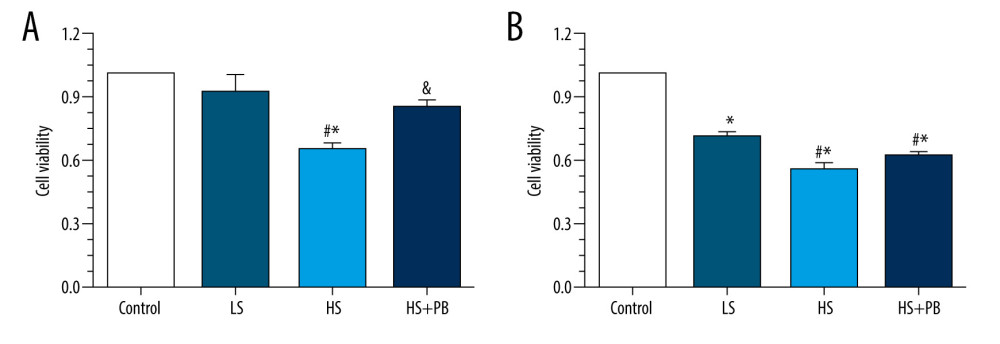 Figure 1. The viability analysis of different groups. (A) The viability results of different groups after the 24-h intervention. (B) The viability results of different groups after the 48-h intervention. Values displayed are mean±SD. (n=3 per group). * P<0.05 vs control group, # P<0.05 vs LS group, & P<0.05 vs HS group. LS – low salt; HS – high salt.
 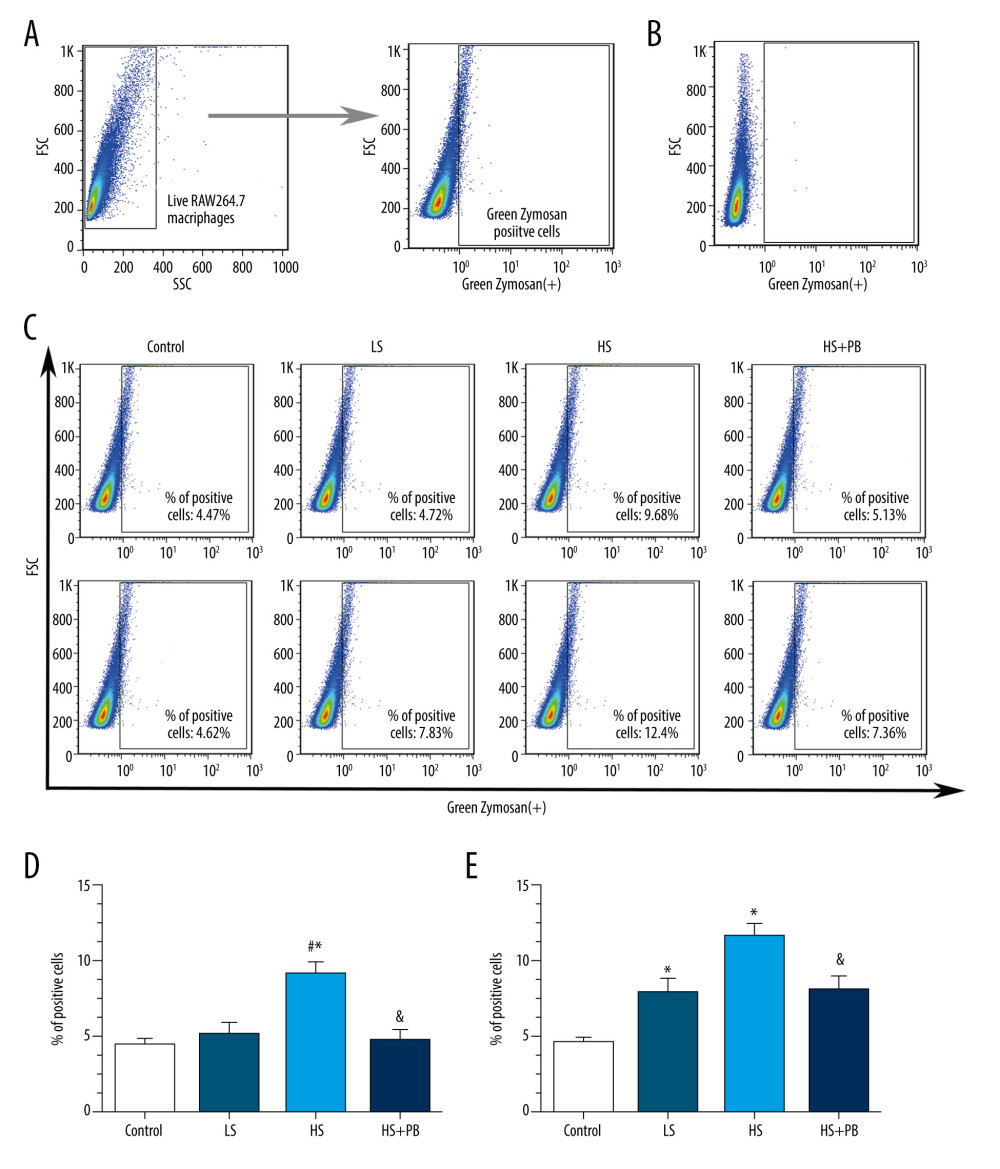 Figure 2. Flow cytometry analysis of macrophage phagocytosis in different groups. (A)The gating strategy used for analysis of Green Zymosan-positive macrophages. (B) The negative control results. (C) The representative temporal profiles of flow cytometry analysis (pseudocolor plots) in different groups. (D) The phagocytosis results in different groups after the 24-h intervention. (E) The phagocytosis results in different groups after the 48-h intervention. Data are reported as mean±SD (n=3 per group). * P<0.05 vs control group, # P<0.05 vs LS group, & P<0.05 vs HS group. FSC – forward-scattered light; HS – high salt; LS – low salt; MFI – mean fluorescence intensity; SSC – side-scattered light.
 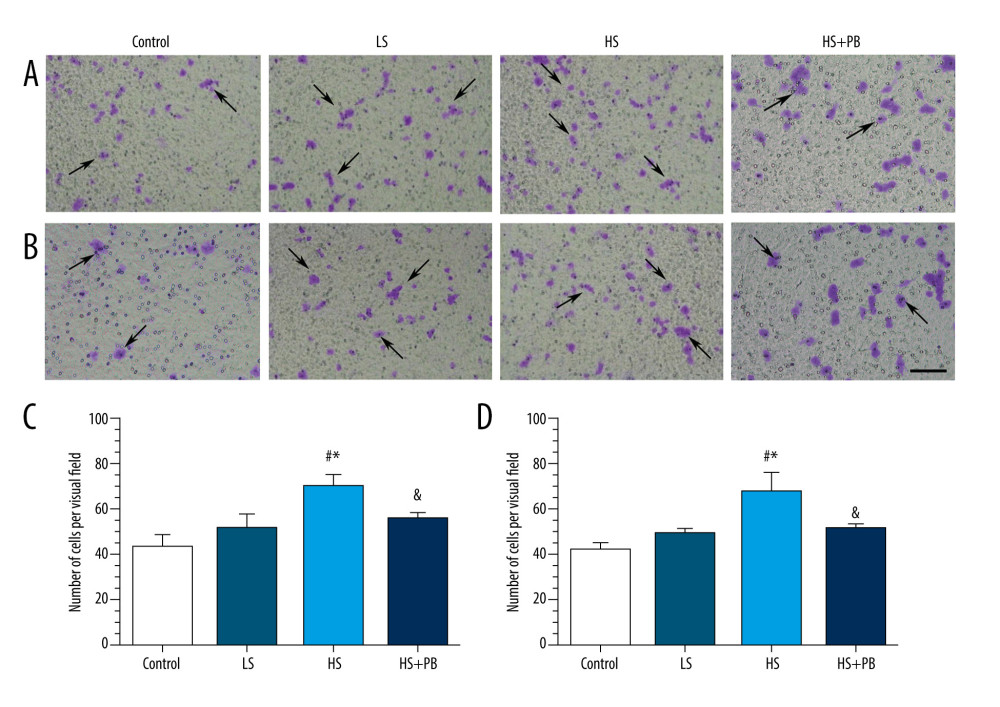 Figure 3. The results of macrophage migration ability of different groups. (A, C) Representative images and statistical results of migration ability in different groups after the 24-h intervention. (B, D) Representative images and statistical results of migration ability in different groups after the 48-h intervention. Values displayed are mean±SD (n=3 per group). Scale bar indicates 100 μm. * P<0.05 vs control group, # P<0.05 vs LS group, & P<0.05 vs HS group. HS – high salt; LS – low salt.
 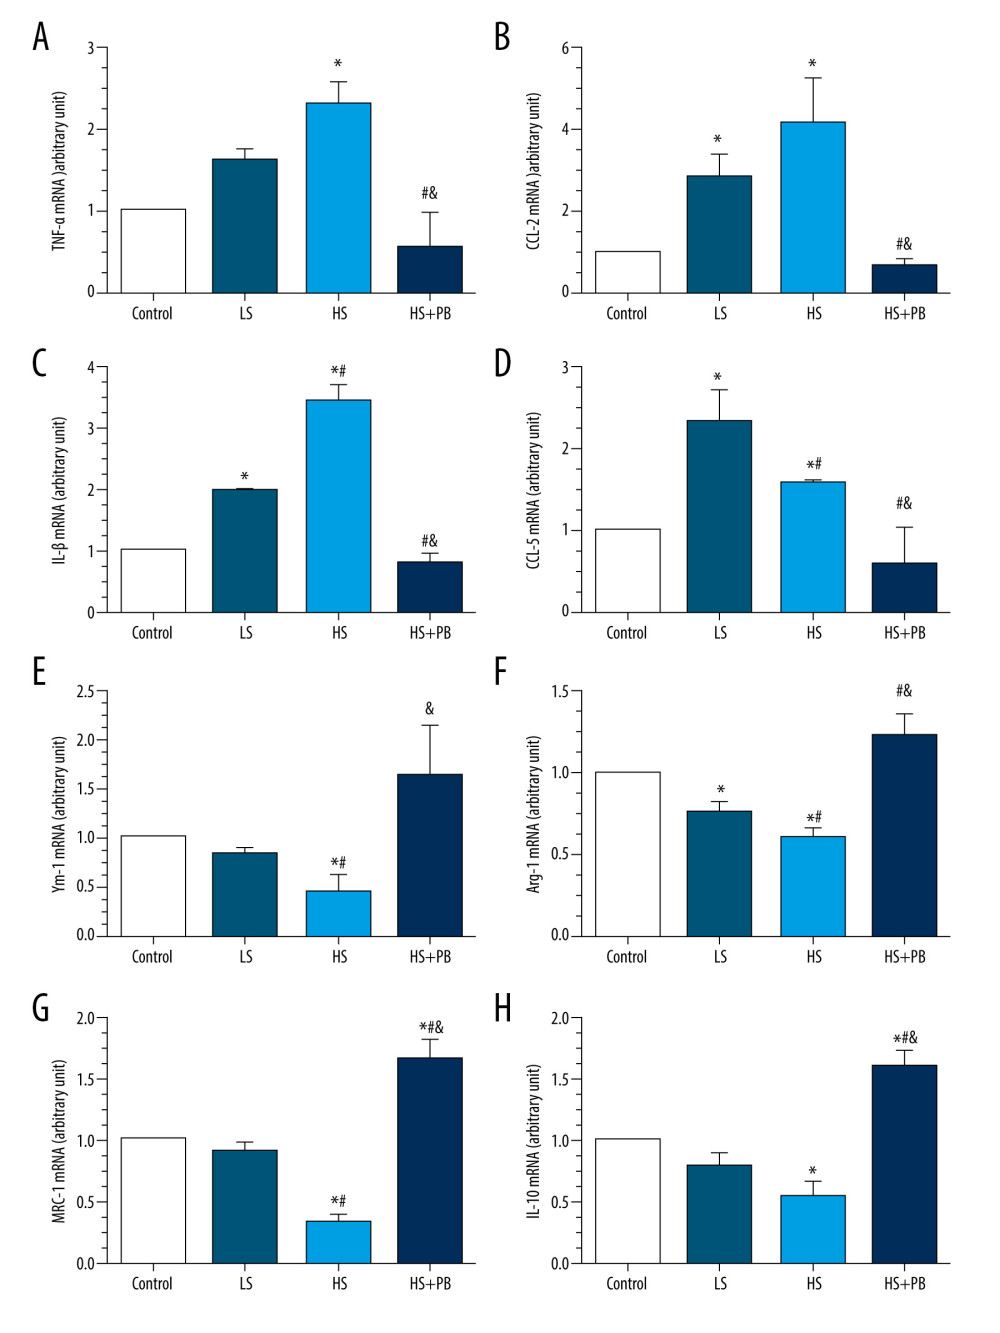 Figure 4. (A–H) The mRNA expression levels of macrophage phenotype-related inflammatory factors in different groups. Values displayed are mean±SD (n=3 per group). * P<0.05 vs control group, # P<0.05 vs LS group, & P<0.05 vs HS group. HS – high salt; LS – low salt
 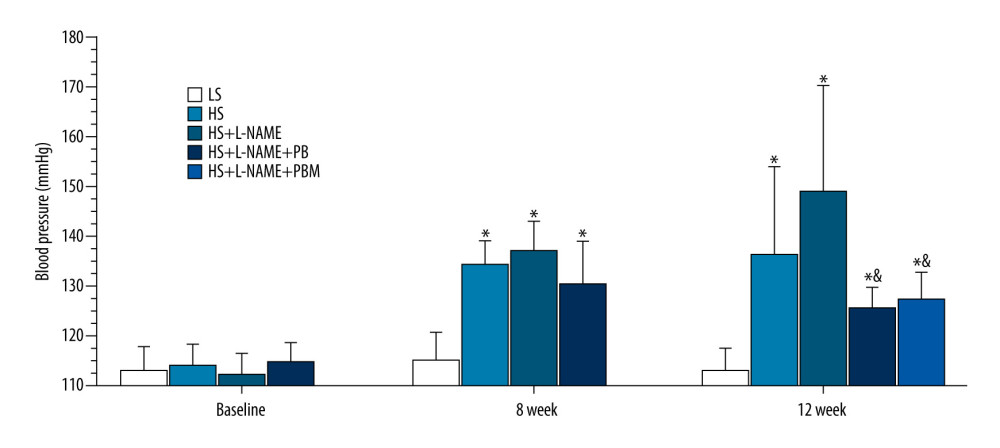 Figure 5. The changes of blood pressure in different groups. Values displayed are mean±SD (n=10 per group). * P<0.05 vs LS group, # P<0.05 vs HS group, & P<0.05 vs HS+L-NAME group. HS – high salt; L-NAME – N-nitro-l-arginine methyl ester; LS – low salt.
 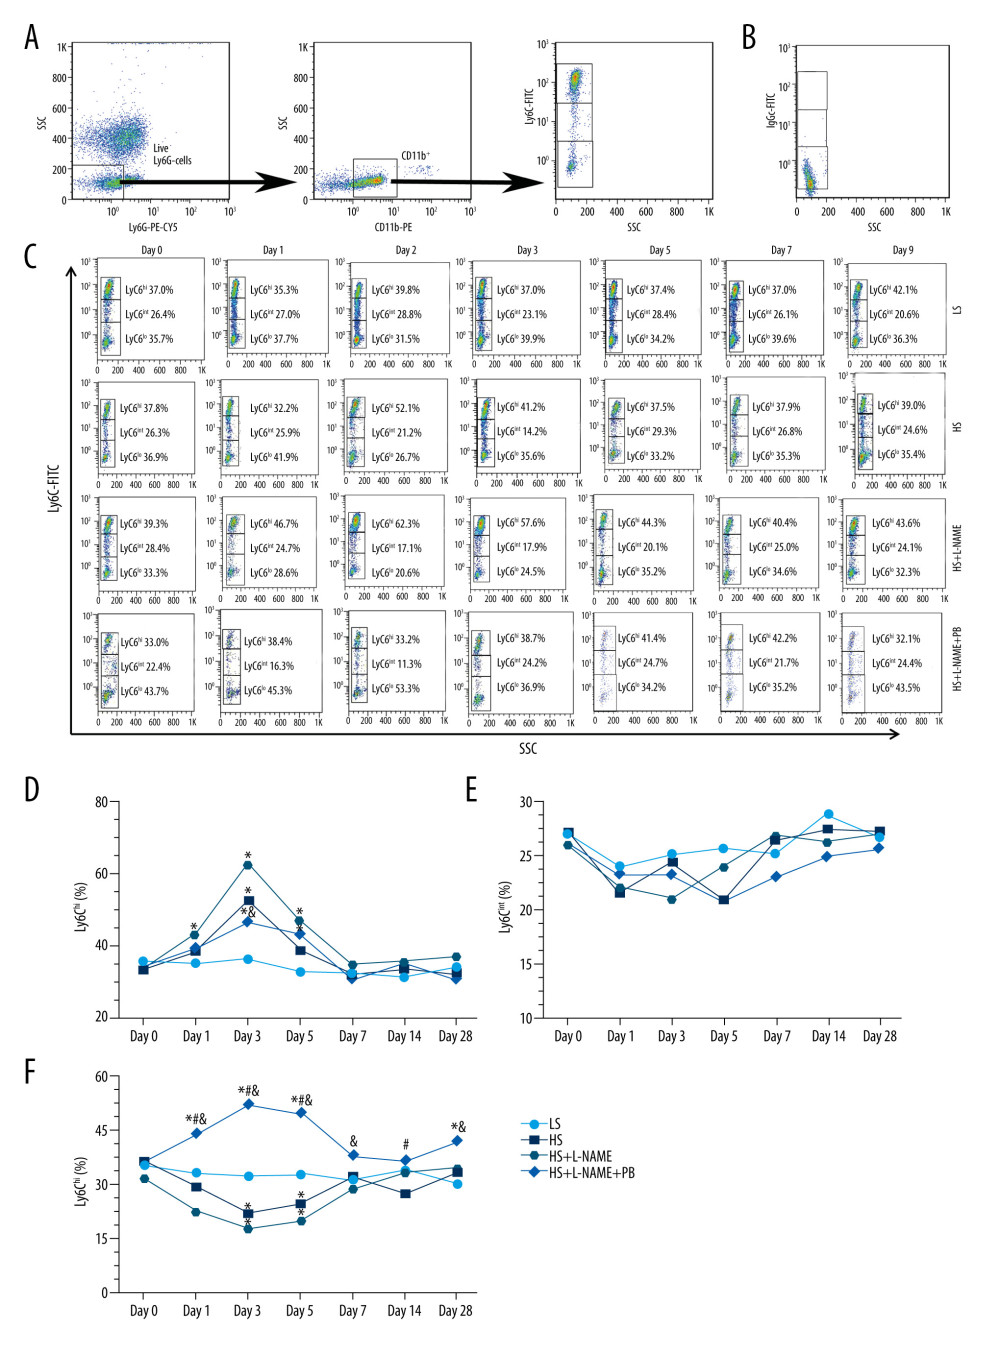 Figure 6. Flow cytometry analysis of mouse circulating monocyte subsets in different groups. (A) The gating strategy used for analysis of mouse circulating monocyte subsets. (B) The isotype control results of Ly6C-FiTC staining. (C) Representative temporal profiles of flow cytometry analysis (pseudocolor plots) in different groups. B shows the changes of Ly6Chi monocytes in different groups; D shows the changes of Ly6Chi monocytes in different groups; E shows the changes of Ly6Cint monocytes in different groups; and F shows the changes of Ly6Clo monocytes in different groups. Data are reported as mean±SD (n=10 per group). * P<0.05 vs LS group, # P<0.05 vs HS group, & P<0.05 vs HS+L-NAME group. HS – high salt; L-NAME – N-nitro-l-arginine methyl ester; LS – low salt; SSC – side-scattered light.
 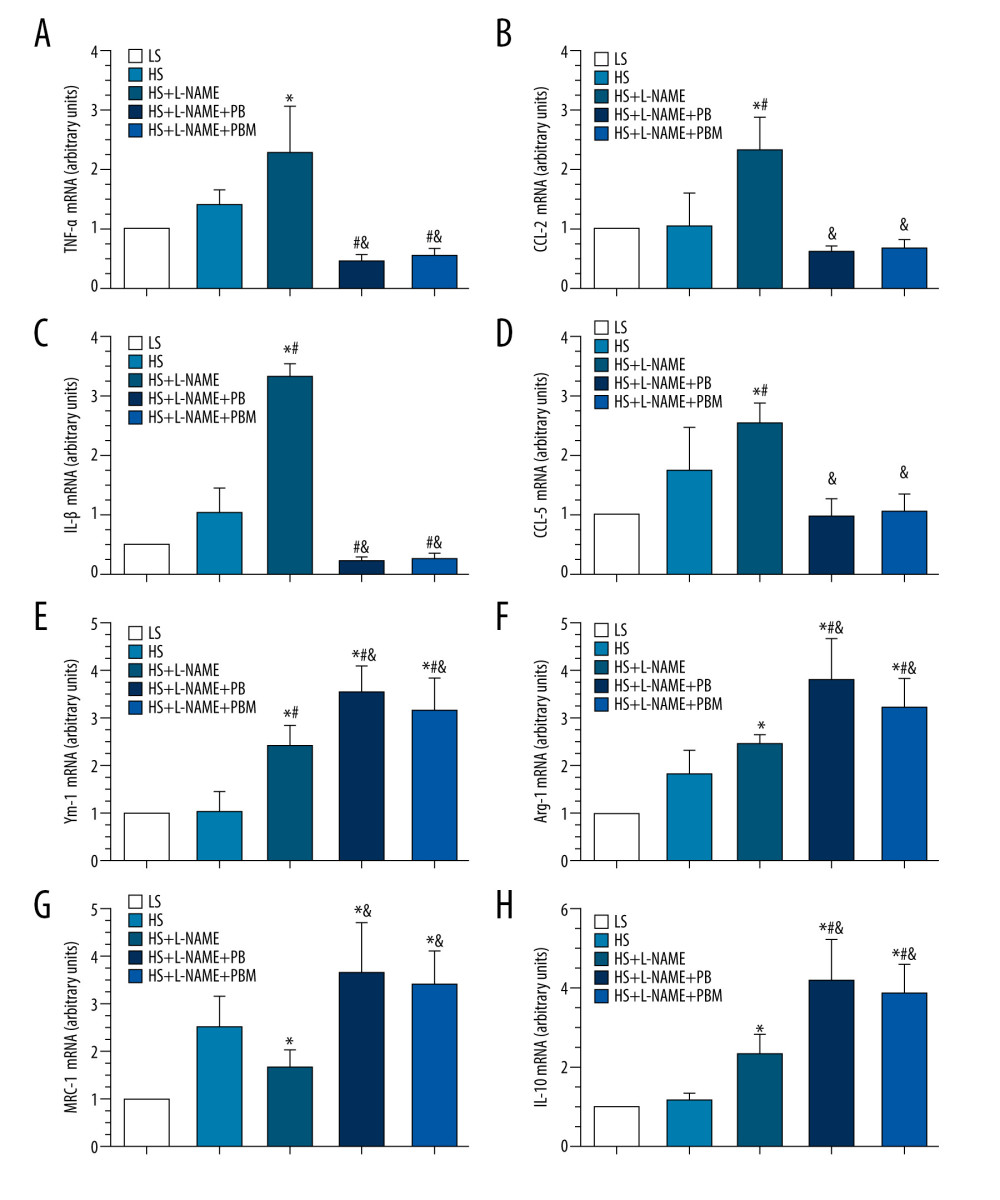 Figure 7. (A–H) The mRNA expression levels of macrophage phenotype-related inflammatory factors in heart tissue of different groups. Values displayed are mean±SD (n=5 per group). * P<0.05 vs LS group, # P<0.05 vs HS group, & P<0.05 vs HS+L-NAME group. HS – high salt; L-NAME – N-nitro-l-arginine methyl ester; LS, low salt.
 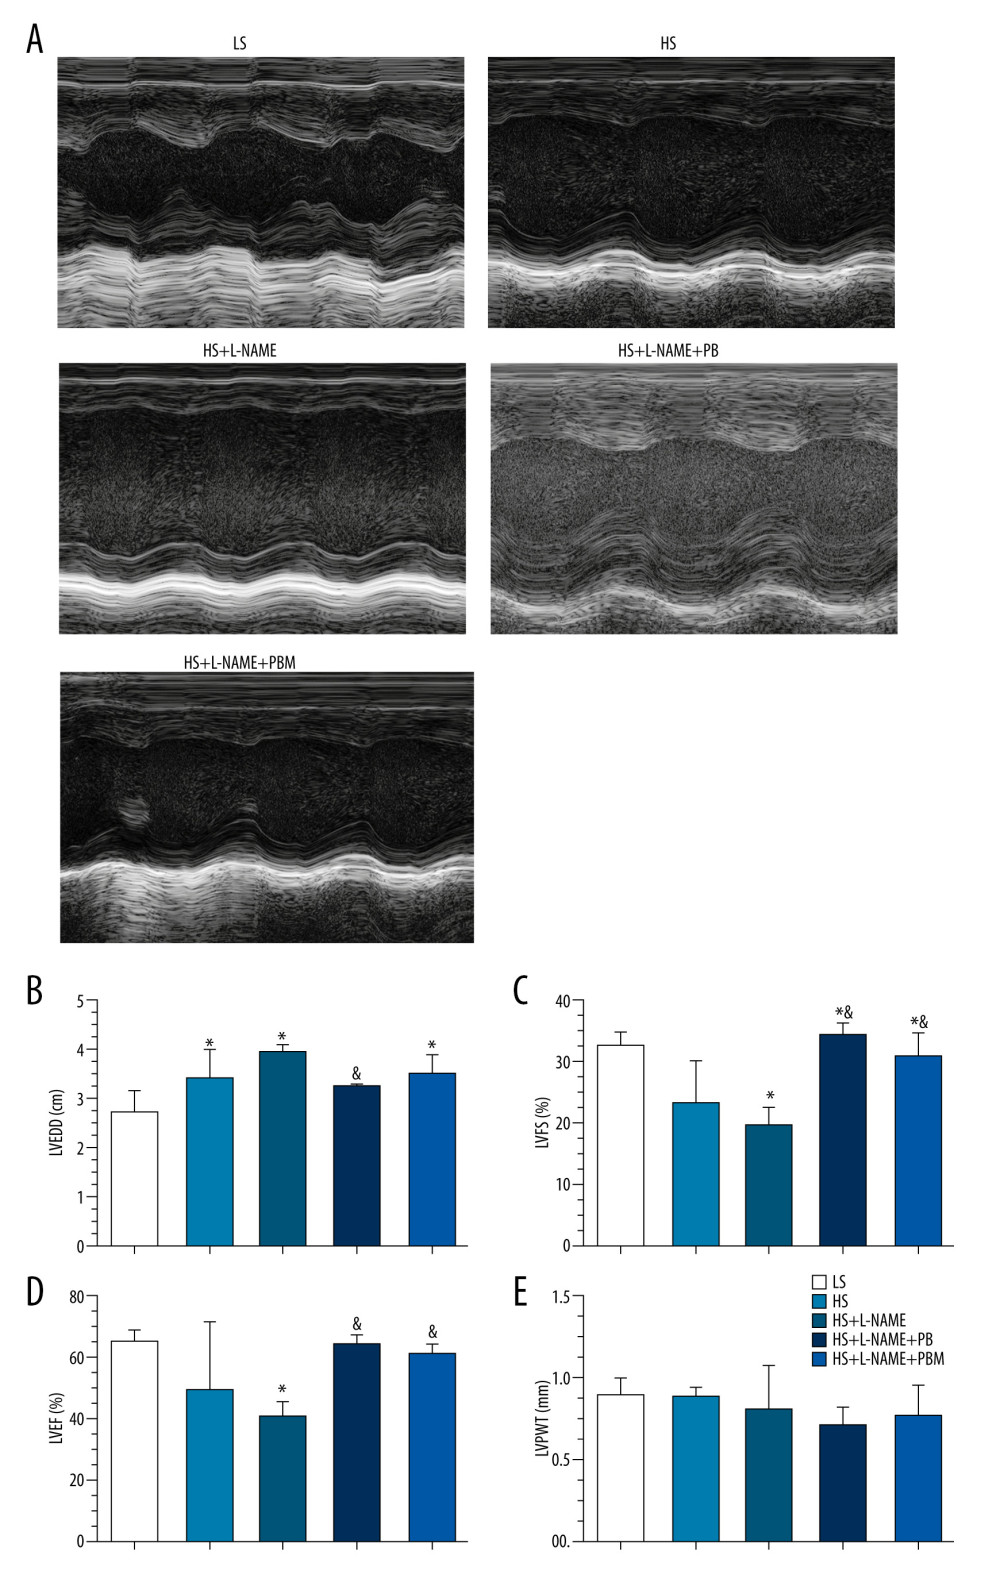 Figure 8. (A–E) Transthoracic 2-dimensional echocardiography analysis of different groups. Data are reported as mean±SD (n=5 per group). * P<0.05 vs LS group, # P<0.05 vs HS group, & P<0.05 vs HS+L-NAME group. HS – high salt; L-NAME – N-nitro-l-arginine methyl ester; LS – low salt; LVEDD – left ventricular end-diastolic diameter; LVEF – left ventricular ejection fraction; LVFS – left ventricular fractional shortening; LVPWT – left ventricular posterior wall diastolic thickness.
 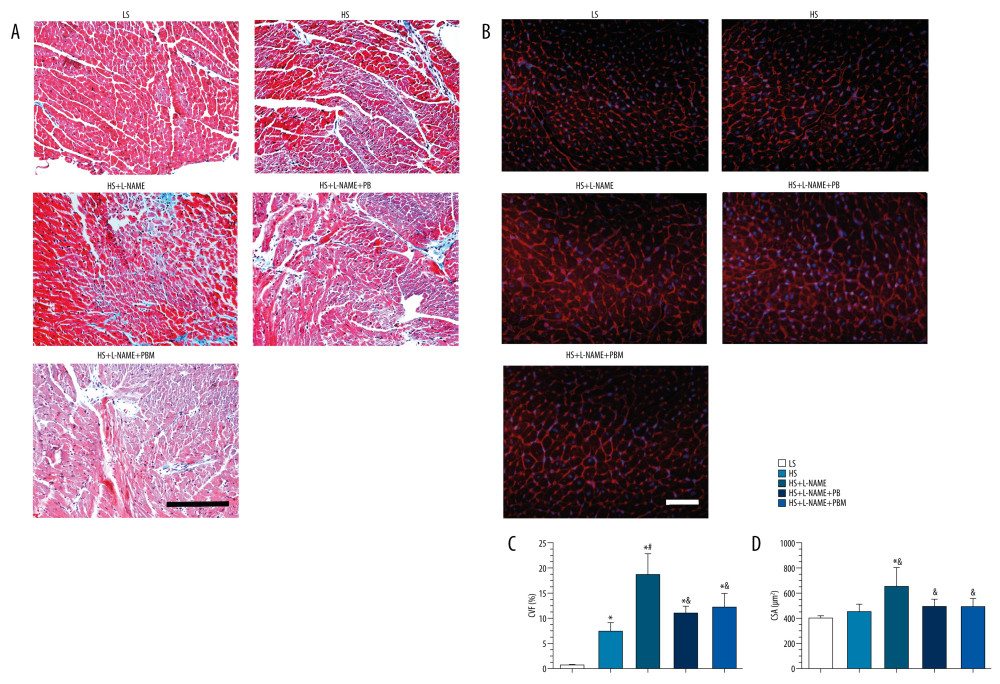 Figure 9. Collagen deposition and cardiomyocyte hypertrophy in different groups. (A) Representative Masson-stained heart tissue images for collagen deposition. (B) Representative wheat germ agglutinin-stained heart section for cardiomyocyte hypertrophy. (C) Comparisons of collagen volume fraction. (D) Comparisons of cardiomyocyte cross-sectional area. Values displayed are mean±SD (n=5 per group). Scale bar indicates 100 μm. * P<0.05 vs LS group, # P<0.05 vs HS group, & P<0.05 vs HS+L-NAME group. CVF – collagen volume fraction; CSA – cross-sectional area; HS – high salt; L-NAME – N-nitro-l-arginine methyl ester; LS – low salt.
 References
1. Wang Z, Cheng C, Yang X, Zhang C, L-phenylalanine attenuates high salt-induced hypertension in Dahl SS rats through activation of GCH1-BH4: PLoS One, 2021; 16(4); e0250126
2. Yang P, Zhao X, Zhou L, Protective effect of oral histidine on hypertension in Dahl salt-sensitive rats induced by high-salt diet: Life Sci, 2021; 270; 119134
3. Zheng X, Zhao X, Jin Y, High salt diet contributes to hypertension by weakening the medullary tricarboxylic acid cycle and antioxidant system in Dahl salt-sensitive rats: Biochimie, 2021; 181; 154-61
4. Yamamoto M, Takahashi-Yanaga F, Arioka M, Cardiac and renal protective effects of 2,5-dimethylcelecoxib in angiotensin II and high-salt-induced hypertension model mice: J Hypertens, 2021; 39(5); 892-903
5. Cai W, Lang M, Jiang X, Correlation among high salt intake, blood pressure variability, and target organ damage in patients with essential hypertension: Study protocol clinical trial (SPIRIT compliant): Medicine, 2020; 99(14); e19548
6. Nakazawa Y, Inoue S, Nakamura Y, High-salt diet promotes crystal deposition through hypertension in Dahl salt-sensitive rat model: Int J Urol, 2019; 26(8); 839-46
7. Zhang D, Hu W, Tu H, Macrophage depletion in stellate ganglia alleviates cardiac sympathetic overactivation and ventricular arrhythmogenesis by attenuating neuroinflammation in heart failure: Basic Res Cardiol, 2021; 116(1); 28
8. Yang GH, Zhou X, Ji WJ, Overexpression of VEGF-C attenuates chronic high salt intake-induced left ventricular maladaptive remodeling in spontaneously hypertensive rats: Am J Physiol Heart Circ Physiol, 2014; 306(4); H598-609
9. Yang GH, Zhou X, Ji WJ, VEGF-C-mediated cardiac lymphangiogenesis in high salt intake accelerated progression of left ventricular remodeling in spontaneously hypertensive rats: Clin Exp Hypertens, 2017; 39(8); 740-47
10. Vishnyakova P, Poltavets A, Karpulevich E, The response of two polar monocyte subsets to inflammation: Biomed Pharmacother, 2021; 139; 111614
11. Yang P, Liu L, Sun L, Immunological feature and transcriptional signaling of Ly6C monocyte subsets from transcriptome analysis in control and hyperhomocysteinemic mice: Front Immunol, 2021; 12; 632333
12. Utomo L, Fahy N, Kops N, Macrophage phenotypes and monocyte subsets after destabilization of the medial meniscus in mice: J Orthop Res, 2020 [Online ahead of print]
13. Beliard S, Le Goff W, Saint-Charles F, Modulation of Gr1(low) monocyte subset impacts insulin sensitivity and weight gain upon high-fat diet in female mice: Int J Obes (Lond), 2017; 41(12); 1805-14
14. Oh ES, Na M, Rogers CJ, The association between monocyte subsets and cardiometabolic disorders/cardiovascular disease: A systematic review and meta-analysis: Front Cardiovasc Med, 2021; 8; 640124
15. Harwani SC, Macrophages under pressure: The role of macrophage polarization in hypertension: Transl Res, 2018; 191; 45-63
16. Yin Z, Cai H, Wang Z, Jiang Y, Pseudolaric acid B inhibits proliferation, invasion, and angiogenesis in esophageal squamous cell carcinoma through regulating CD147: Drug Des Devel Ther, 2020; 14; 4561-73
17. Liu ML, Sun D, Li T, Chen H, A systematic review of the immune-regulating and anticancer activities of pseudolaric acid B: Front Pharmacol, 2017; 8; 394
18. Li T, Wang W, Li YX, Pseudolaric acid B attenuates atherosclerosis progression and inflammation by suppressing PPARgamma-mediated NF-kappaB activation: Int Immunopharmacol, 2018; 59; 76-85
19. Zhao Y, Yang N, Li H: J Ultrasound Med, 2018; 37(3); 657-66
20. Das A, Wang X, Kang J, Monocyte subsets with high osteoclastogenic potential and their epigenetic regulation orchestrated by IRF8: J Bone Miner Res, 2021; 36(1); 199-214
21. Liu JX, Li X, Ji WJ, The dynamics of circulating monocyte subsets and intra-plaque proliferating macrophages during the development of atherosclerosis in ApoE(−/−) mice: Int Heart J, 2019; 60(3); 746-55
22. Livak KJ, Schmittgen TD, Analysis of relative gene expression data using real-time quantitative PCR and the 2(-delta delta C(T)) method: Methods, 2001; 25(4); 402-8
23. Sahn DJ, DeMaria A, Kisslo J, Weyman A, Recommendations regarding quantitation in M-mode echocardiography: Results of a survey of echocardiographic measurements: Circulation, 1978; 58(6); 1072-83
24. Zhang Y, Zhang L, Fan X, Captopril attenuates TAC-induced heart failure via inhibiting Wnt3a/beta-catenin and Jak2/Stat3 pathways: Biomed Pharmacother, 2019; 113; 108780
25. Garcia ML, Pontes RB, Nishi EE, The antioxidant effects of green tea reduces blood pressure and sympathoexcitation in an experimental model of hypertension: J Hypertens, 2017; 35(2); 348-54
26. Baka T, Simko F, Ivabradine reversed nondipping heart rate in rats with l-NAME-induced hypertension: Clin Exp Pharmacol Physiol, 2019; 46(6); 607-10
27. Yadav VR, Teng B, Mustafa SJ, Enhanced A1 adenosine receptor-induced vascular contractions in mesenteric artery and aorta of in L-NAME mouse model of hypertension: Eur J Pharmacol, 2019; 842; 111-17
28. Nahrendorf M, Swirski FK, Monocyte and macrophage heterogeneity in the heart: Circ Res, 2013; 112(12); 1624-33
29. Ravindran A, Goyal G, Go RS, Rech KL, Rosai-Dorfman disease displays a unique monocyte-macrophage phenotype characterized by expression of OCT2: Am J Surg Pathol, 2021; 45(1); 35-44
30. Binger KJ, Gebhardt M, Heinig M, High salt reduces the activation of IL-4- and IL-13-stimulated macrophages: J Clin Invest, 2015; 125(11); 4223-38
31. Zhou X, Zhang L, Ji WJ, Variation in dietary salt intake induces coordinated dynamics of monocyte subsets and monocyte-platelet aggregates in humans: Implications in end organ inflammation: PLoS One, 2013; 8(4); e60332
32. Zhang H, Li JC, Luo H, Pseudolaric acid B exhibits anti-cancer activity on human hepatocellular carcinoma through inhibition of multiple carcinogenic signaling pathways: Phytomedicine, 2019; 59; 152759
33. Li T, Wong VK, Yi XQ, Pseudolaric acid B suppresses T lymphocyte activation through inhibition of NF-kappaB signaling pathway and p38 phosphorylation: J Cell Biochem, 2009; 108(1); 87-95
Figures
 Figure 1. The viability analysis of different groups. (A) The viability results of different groups after the 24-h intervention. (B) The viability results of different groups after the 48-h intervention. Values displayed are mean±SD. (n=3 per group). * P<0.05 vs control group, # P<0.05 vs LS group, & P<0.05 vs HS group. LS – low salt; HS – high salt.
 Figure 2. Flow cytometry analysis of macrophage phagocytosis in different groups. (A)The gating strategy used for analysis of Green Zymosan-positive macrophages. (B) The negative control results. (C) The representative temporal profiles of flow cytometry analysis (pseudocolor plots) in different groups. (D) The phagocytosis results in different groups after the 24-h intervention. (E) The phagocytosis results in different groups after the 48-h intervention. Data are reported as mean±SD (n=3 per group). * P<0.05 vs control group, # P<0.05 vs LS group, & P<0.05 vs HS group. FSC – forward-scattered light; HS – high salt; LS – low salt; MFI – mean fluorescence intensity; SSC – side-scattered light.
 Figure 3. The results of macrophage migration ability of different groups. (A, C) Representative images and statistical results of migration ability in different groups after the 24-h intervention. (B, D) Representative images and statistical results of migration ability in different groups after the 48-h intervention. Values displayed are mean±SD (n=3 per group). Scale bar indicates 100 μm. * P<0.05 vs control group, # P<0.05 vs LS group, & P<0.05 vs HS group. HS – high salt; LS – low salt.
 Figure 4. (A–H) The mRNA expression levels of macrophage phenotype-related inflammatory factors in different groups. Values displayed are mean±SD (n=3 per group). * P<0.05 vs control group, # P<0.05 vs LS group, & P<0.05 vs HS group. HS – high salt; LS – low salt
 Figure 5. The changes of blood pressure in different groups. Values displayed are mean±SD (n=10 per group). * P<0.05 vs LS group, # P<0.05 vs HS group, & P<0.05 vs HS+L-NAME group. HS – high salt; L-NAME – N-nitro-l-arginine methyl ester; LS – low salt.
 Figure 6. Flow cytometry analysis of mouse circulating monocyte subsets in different groups. (A) The gating strategy used for analysis of mouse circulating monocyte subsets. (B) The isotype control results of Ly6C-FiTC staining. (C) Representative temporal profiles of flow cytometry analysis (pseudocolor plots) in different groups. B shows the changes of Ly6Chi monocytes in different groups; D shows the changes of Ly6Chi monocytes in different groups; E shows the changes of Ly6Cint monocytes in different groups; and F shows the changes of Ly6Clo monocytes in different groups. Data are reported as mean±SD (n=10 per group). * P<0.05 vs LS group, # P<0.05 vs HS group, & P<0.05 vs HS+L-NAME group. HS – high salt; L-NAME – N-nitro-l-arginine methyl ester; LS – low salt; SSC – side-scattered light.
 Figure 7. (A–H) The mRNA expression levels of macrophage phenotype-related inflammatory factors in heart tissue of different groups. Values displayed are mean±SD (n=5 per group). * P<0.05 vs LS group, # P<0.05 vs HS group, & P<0.05 vs HS+L-NAME group. HS – high salt; L-NAME – N-nitro-l-arginine methyl ester; LS, low salt.
 Figure 8. (A–E) Transthoracic 2-dimensional echocardiography analysis of different groups. Data are reported as mean±SD (n=5 per group). * P<0.05 vs LS group, # P<0.05 vs HS group, & P<0.05 vs HS+L-NAME group. HS – high salt; L-NAME – N-nitro-l-arginine methyl ester; LS – low salt; LVEDD – left ventricular end-diastolic diameter; LVEF – left ventricular ejection fraction; LVFS – left ventricular fractional shortening; LVPWT – left ventricular posterior wall diastolic thickness.
 Figure 9. Collagen deposition and cardiomyocyte hypertrophy in different groups. (A) Representative Masson-stained heart tissue images for collagen deposition. (B) Representative wheat germ agglutinin-stained heart section for cardiomyocyte hypertrophy. (C) Comparisons of collagen volume fraction. (D) Comparisons of cardiomyocyte cross-sectional area. Values displayed are mean±SD (n=5 per group). Scale bar indicates 100 μm. * P<0.05 vs LS group, # P<0.05 vs HS group, & P<0.05 vs HS+L-NAME group. CVF – collagen volume fraction; CSA – cross-sectional area; HS – high salt; L-NAME – N-nitro-l-arginine methyl ester; LS – low salt.
 In Press
21 Mar 2024 : Meta-Analysis
Economic Evaluation of COVID-19 Screening Tests and Surveillance Strategies in Low-Income, Middle-Income, a...Med Sci Monit In Press; DOI: 10.12659/MSM.943863
10 Apr 2024 : Clinical Research
Predicting Acute Cardiovascular Complications in COVID-19: Insights from a Specialized Cardiac Referral Dep...Med Sci Monit In Press; DOI: 10.12659/MSM.942612
06 Mar 2024 : Clinical Research
Enhanced Surgical Outcomes of Popliteal Cyst Excision: A Retrospective Study Comparing Arthroscopic Debride...Med Sci Monit In Press; DOI: 10.12659/MSM.941102
06 Mar 2024 : Clinical Research
Prevalence and Variation of Medical Comorbidities in Oral Surgery Patients: A Retrospective Study at Jazan ...Med Sci Monit In Press; DOI: 10.12659/MSM.943884
Most Viewed Current Articles
17 Jan 2024 : Review article
Vaccination Guidelines for Pregnant Women: Addressing COVID-19 and the Omicron VariantDOI :10.12659/MSM.942799
Med Sci Monit 2024; 30:e942799
14 Dec 2022 : Clinical Research
Prevalence and Variability of Allergen-Specific Immunoglobulin E in Patients with Elevated Tryptase LevelsDOI :10.12659/MSM.937990
Med Sci Monit 2022; 28:e937990
16 May 2023 : Clinical Research
Electrophysiological Testing for an Auditory Processing Disorder and Reading Performance in 54 School Stude...DOI :10.12659/MSM.940387
Med Sci Monit 2023; 29:e940387
01 Jan 2022 : Editorial
Editorial: Current Status of Oral Antiviral Drug Treatments for SARS-CoV-2 Infection in Non-Hospitalized Pa...DOI :10.12659/MSM.935952
Med Sci Monit 2022; 28:e935952


