02 February 2022: Clinical Research
Use of the Braden Scale to Predict Injury Severity in Mass Burn Casualties
Zhikang Zhu12ABCDEF, Bin Xu12ABD, Jiaming Shao12BCD, Shuangshuang Wang123BC, Ronghua Jin12CD, Tingting Weng12CD, Sizhan Xia12CD, Wei Zhang12CD, Min Yang12CD, Chunmao Han12ABDG, Xingang Wang12ABCDEF*DOI: 10.12659/MSM.934039
Med Sci Monit 2022; 28:e934039
Abstract
BACKGROUND: Mass burn casualties impose an enormous burden on triage systems. The triage capacity of the Braden Scale for detecting injury severity has not been evaluated in mass burn casualties.
MATERIAL AND METHODS: The New Injury Severity Score (NISS) was used to dichotomize the injury severity of patients. The Braden Scale and other potentially indicative measurement tools were evaluated using univariate analysis and multivariate logistic regression. The relationships between the Braden Scale and other continuous variables with injury severity were further explored by correlation analysis and fitted with regression models. Receiver operating characteristic (ROC) curve analysis was used to validate triage capacity and compare prognostic accuracy.
RESULTS: A total of 160 hospitalized patients were included in our study; 37 were severely injured, and 123 were not. Injury severity was independently associated with the Numerical Rating Scale (adjusted OR, 1.816; 95% CI, 1.035-3.187) and Braden Scale (adjusted OR, 0.693; 95% CI, 0.564-0.851). The ROC curve of the fitted quadratic model of the Braden Scale was 0.896 (0.840-0.953), and the cut-off value was 17. The sensitivity was 81.08% (64.29-91.44%) and the specificity was 82.93% (74.85-88.89%). Comparison of ROC curves demonstrated an infinitesimal difference between the Braden Scale and NISS for predicting 30-day hospital discharge (Z=0.291, P=0.771) and Intensive Care Unit admission (Z=2.016, P=0.044).
CONCLUSIONS: The Braden Scale is a suitable triage tool for predicting injury severity and forecasting disability-related outcomes in patients affected by mass burn casualty incidents.
Keywords: Abbreviated Injury Scale, Burns, Health Status Indicators, Regression Analysis, Adult, Aged, 80 and over, Female, Humans, Injury Severity Score, Male, mass casualty incidents, Reproducibility of Results, Sensitivity and Specificity, Triage, young adult
Background
Unpredictable burn-related accidents, such as the Tianjin explosion on December 8, 2015 [1], and Hangzhou bus arson incident [2], account for hundreds of thousands of deaths annually [3] and impose enormous economic and medical burdens on developing and developed countries [4,5]. A previous study reported that more than 700 tanker truck explosions occurred in China from 2004 to 2011, resulting in numerous burn-related casualties [5]. The accidental explosions that happen casually worldwide also cause a mass of burn-related injury and death [6,7].
The injured patients who flood into the Emergency Departments (EDs) and overwhelm the local hospital resources are urgent cases that need to be directed appropriately and treated immediately. Several triage systems have been developed in the past several decades, including the Australasian Triage Scale [8], Canadian Triage and Acuity Scale [9], Manchester Triage System [10], Emergency Severity Index [11], and Simple Triage and Rapid Treatment (START) system [12]. Severely injured patients requiring urgent treatment are initially evaluated by medical personnel according to one of these triage systems, although concerns about insufficient evaluations of injury severity during mass burn casualty incidents have been raised [13,14]. Moreover, the accurate assessment of injury severity relies on the New Injury Severity Score (NISS) [15], in which higher scores reflect more severe injury [16,17]. The NISS can be used to predict mortality, length of hospital stay, and likelihood of functional recovery [18]. Early application of the NISS in EDs seems impossible because complete and detailed diagnoses are unavailable in the EDs at the early stage of an emergency. Furthermore, the prognostic indicators to predict injury severity of mass burn casualties have not been sufficiently evaluated [19].
The Braden Scale, developed by Barbara Braden and Nancy Bergstrom to evaluate the risk of pressure sores and ulcers [20], includes 6 dimensions: sensory perception, moisture, activity, nutrition, mobility, and friction and shear. As a rapid evaluation tool, the predictive application of the Braden Scale has already been widely extended in previous studies. Eschbach et al [21] applied the Braden Scale to predict pneumonia after acute ischemic stroke with a cut-off threshold of 18 points. The Braden Scale can also help surgeons predict the demand for postoperative rehabilitation after pancreatectomy [22] and the adverse outcomes of geriatric surgical patients [23]. The Braden Scale is considered an essential tool in China for assessing hospitalized patients before admission, particularly in burn and trauma wards [24]. In this study, we aimed to evaluate the predictive capacity of the Braden Scale for injury severity in mass burn casualties, thereby improving triage efficiency when EDs are at capacity.
Material and Methods
DATA RESOURCE, PATIENTS MANAGEMENT, AND ETHICS:
At 4: 46 PM on June 13, 2020, a tanker truck exploded on an off-ramp of the Shenyang-Haikou Expressway near Liangshan Village in Wenling City (Taizhou, Zhejiang Province, China). The explosion destroyed a building on the opposite side of the road, and a second explosion led to hundreds of injuries. Medical personnel were mobilized to transfer and treat those who were injured. Then, we collected the data of inpatients injured in the accident from the electronic medical records system and paper-based medical records of the Wenling First People’s Hospital, Wenling Traditional Chinese Medicine Hospital, Taizhou Enze Hospital, Taizhou Integrated Medicine Hospital, Taizhou Orthopedics Hospital, and Wenling Oriental Hospital. Additional information was provided by 2 referral hospitals: the Second Affiliated Hospital of Zhejiang University and Zhejiang Children’s Hospital of Zhejiang University.
This retrospective study included all patients admitted to the hospitals within 24 h after the accident. Emergency triage was first conducted by emergency physicians with the help of experienced senior nurses. After the initial assessment of vital signs and injury condition, the wounded were simply graded as minor, severe, or critical types and then immediately transferred to the corresponding department for specialized treatments by the professional medical teams [25].
This study was approved by the Health Department of Zhejiang Province and the Institutional Ethics Committee of the Second Affiliated Hospital of Zhejiang University, School of Medicine. Owing to the retrospective nature of the study, the need for informed consent was waived by the Ethics Committee.
SAMPLE SIZE CALCULATION, AND INCLUSION AND EXCLUSION CRITERIA: In the exploratory stages of univariate analysis and logistic regression analysis, the sample size was not overly restricted. While in receiver operating characteristic (ROC) curve analysis, we estimated that a sample size of 105 patients (21 positive and 84 negative) would be needed to achieve an 80% power and an area under the curve (AUC) of 0.70 with a 2-sided Z-test at a significance level of 0.05, estimating the allocation ratios (20% Braden Scale score <16) and effect sizes from previously published studies [26,27].
We established and used the same checklist to collect the information from the medical records of different hospitals. The inclusion criteria were as follows: (1) age ≥18 years; (2) patients injured in the explosion; and (3) inpatients with a complete and detailed diagnosis. The exclusion criteria were as follows: (1) patients with incomplete records or who were treated as outpatients; (2) a history of serious cardiovascular, renal, pulmonary, or cerebral disease; (3) admission after 24 h [13]; and (4) death before admission or within 30 days thereafter.
DATA COLLECTION AND EVALUATION OF BRADEN SCALE AND OTHER SCALES: Two trained medical experts independently reviewed the medical records and collected data using a standardized reporting template with clear definitions and codes. The patients’ vital signs evaluated at the time of admission to the hospitals were extracted [19], including systolic blood pressure (SBP), heart rate (HR), respiratory rate (RR), and body temperature. The shock index was calculated as the HR divided by SBP [16], and a high risk of shock was defined as a shock index ≥1. Abnormal vital signs were recorded, including HR >140 or <50 beats/min, RR >30 or <10/min, SBP >220 or <90 mm Hg, body temperature >40°C or <32°C, and oxygen saturation <90% [28]. We also extracted data on general demographic characteristics (age, sex, and occupation) and injury type (burn or inhalation injury). Burn size was assessed using the rule of nines [29]. Cases where >10% of the total body surface area (TBST) was affected by second-degree burns, or worse, were of special interest [30]. Inhalation injury was verified by a bronchoscopic examination and treated correspondingly [31]. A history of chronic diseases, such as diabetes or hypertension, was considered as a confounding factor.
The Braden Scale was measured before admission to the wards by the certified nurses and consisted of 6 subscales: sensory perception, skin moisture, activity, mobility, nutrition, and friction and shear. The minimum score for each item is 1 (worst), and the maximum score is 4 (best), which ranges from 1 to 3 (except for friction and shear). The summed scores range from 6 to 23, with lower scores related to a higher risk [21]. Furthermore, other associated scales, including the Numerical Rating Scale (NRS) [32] and Glasgow Coma Scale (GCS) [28], were collected as well.
OUTCOME MEASURES: Diagnoses of all inpatients were based on the Abbreviated Injury Scale (AIS) 2005, version updated in 2008 [33]. The AIS divides the human body into 6 regions, and injury severity in each region is rated on a 6-point scale: 1 (minimum) to 6 (maximum, theoretically untreatable). The NISS was calculated as the sum of the squares of the 3 highest AIS scores [15]. All scoring was independently performed by 2 highly qualified physicians, and their scores were then checked by a third physician.
Injury severity, based on the NISS, was the main outcome measure of this study. Patients with an NISS ≥16 were classified as severely injured, and those with scores below 16 were not. ICU admission and 30-day hospital discharge (discharge in 30 days after admission) were the secondary outcome measures. The times to recovery and discharge were confirmed by an official medical team (including at least 1 chief physician) in different departments.
STATISTICAL ANALYSIS:
Categorical variables (presented as numbers and percentages) and continuous variables (presented as mean±SD) were compared between the severely and not severely injured. The Mann-Whitney U test or independent t test was used (depending on the homogeneity of variance) to test for differences in quantitative traits, and the chi-squared or Fisher exact test was used (depending on the theoretical frequency of each grid) to compare differences in categorical variables. We reported 2-tailed P values, and the variables with a P value <0.1 were entered into the multivariate logistic regression model. In multivariate analysis, the P value <0.05 was considered statistically significant. Next, to find an optimal quantitative predictor of injury severity, correlations between continuous variables and the NISS were further investigated using correlation analysis and linear and non-linear regression models. Prediction accuracy of severity and prognosis (ICU admission and 30-day hospital discharge) was compared with the NISS, based on ROC curve analysis and the DeLong test [34,35].
Sample size and power analysis was estimated with PASS software version 15.05 (NCSS, LLC, Kaysville, UT, USA). SPSS software version 20.0 (IBM Corp, Armonk, NY, USA) was used for univariate and multivariate logistic regression analyses. The correlation analysis and linear and non-linear regressions were performed using OriginPro 2019b (OriginLab Corp, Northampton, MA, USA). The ROC curve analysis was conducted with MedCalc software version 19.6.3 (MedCalc Software Ltd, Ostend, Belgium).
Results
PATIENTS CHARACTERISTICS:
Our study extracted the data of 176 injured patients admitted to the hospitals within 24 h after the explosion. Among inpatients with complete medical records, only 3 patients had abnormal vital signs: 2 had a body temperature >40°C or <32°C, and 1 had an RR <10/min. Therefore, we excluded these vital signs from the potential indicative markers and calculated the shock index as an alternative variable. Oxygen saturation data were missing for 63 patients. No patient had a history of serious disease. Thirteen patients <18 years and 3 patients who died within 30 days after admission were excluded.
Ultimately, 160 patients were included in the analysis, 37 of whom were severely injured (NISS ≥16) (Table 1). Of the severe patients, 13 (35.14%) were admitted to the ICU for special care, while the number of patients with a 30-day hospital discharge was 11 (29.73%) (Table 1). Patient age ranged from 19 to 90 years, and the severely injured patients were older than the not severely injured patients (54.03±16.11 and 47.47±17.47 years, respectively, P<0.001). About 66% of patients (106/160) were men, most of whom were farmers and workers.
EXPLORING CONFOUNDERS WITH UNIVARIATE ANALYSIS AND LOGISTIC REGRESSION ANALYSIS:
Univariate analysis revealed that the severely and non-severely injured groups differed significantly in terms of shock risk (P=0.001), second-degree burn covering >10% TBST (P<0.001), and inhalation injury (P<0.001) (Table 1). In addition, patients with severe injuries had worse NRS (3.73±2.51 vs 2.13±0.98, P=0.001), GCS (13.24±3.36 vs 14.99±0.09, P=0.003), and Braden Scale (14.43±3.88 vs 20.60±2.85, P<0.001) scores than did patients without severe injuries. All significant variables in the univariate analysis were entered into the multivariate logistic regression (Table 2). After adjusting for potential confounders, the NRS (adjusted odds ratio [OR], 1.816; 95% confidence interval [CI], 1.035–3.187), and Braden Scale (adjusted OR, 0.693; 95% CI, 0.564–0.851) scores were independently associated with injury severity.
APPLICATION OF THE BRADEN SCALE TO PREDICT INJURY SEVERITY:
According to the correlation analysis, the Braden Scale and NISS were most strongly negatively correlated (Pearson correlation coefficient=−0.727, Table 3). Therefore, we fitted the Braden Scale with the NISS using a series of linear and non-linear regression models (Table 4) and thereafter chose the optimal fitting model, relying on the maximal coefficient of determination (R squared), and excluded the overfitted models with unjustified parameters (P>0.05). Finally, a quadratic equation with statistical significance and maximum correlation was established as follows: Y=0.344X2–15.094X+169.978 (X=Braden Scale [range: 6–23]; R squared=0.632). As shown in Figure 1, most data points were around the 95% CI, showing a fitted prediction capacity of the Braden Scale to forecast injury severity.
ROC ANALYSIS OF BRADEN SCALE FOR PREDICTING INJURY SEVERITY AND OUTCOMES:
Figure 2 shows the results of the ROC curve analysis of the ability of the Braden Scale to predict injury severity. The AUC was 0.896 (range: 0.840–0.953), and the cut-off value for severe injury was 17 (sensitivity=81.08% [range: 64.29–91.44%], specificity=82.93% [range: 74.85–88.89%]), depending on the Youden index [34]. The accuracy of the Braden Scale-based injury scores for predicting ICU admission and 30-day discharge rates was compared with the NISS. No difference was found in predicting 30-day hospital discharge (Z=0.291, P=0.771) (Figure 3); however, the ICU admissions rate seemed to be better predicted by the Braden Scale (Z=2.016, P=0.044) (Figure 4).
Discussion
LIMITATIONS:
First, our data excluded the injured patients who were not admitted to the hospitals, which may have given rise to selection bias and reduced the effectiveness of prediction. However, the bias is comparatively low because most of the injured patients were admitted to the hospitals owing to the policy carried out by the local government. Second, the evaluation bias that differed between professionals and certified nurses might decrease the integrity of diverse scales and measurements, even though each one has anchoring statements for each of its aspects. Third, a larger sample is needed to validate the utility of the Braden Scale, NRS, and other measures for predicting the prognosis of mass burn casualties.
Conclusions
The Braden Scale is a suitable triage tool for predicting injury severity in mass burn casualties. The Braden Scale could also be used to predict disability-related outcomes (ICU admission and 30-day hospital discharge) for burn patients. Other potential prognostic markers, such as vital signs, GCS, and injury type (burn or inhalation injury), require further validation.
Figures
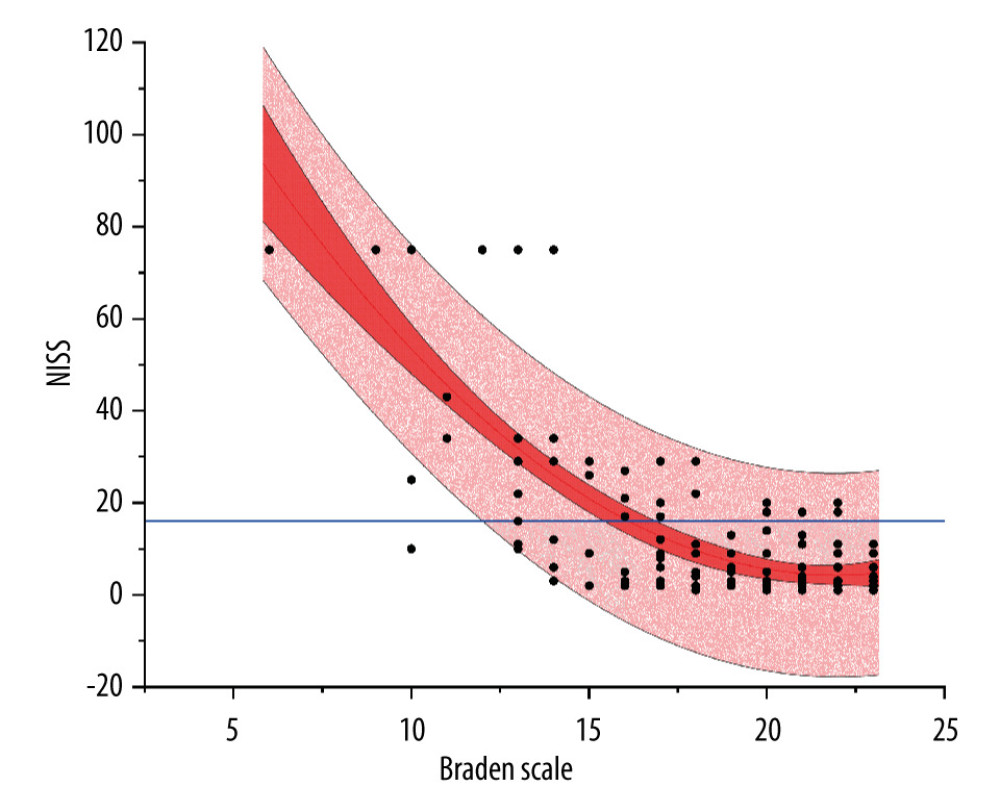 Figure 1. Quadratic fitting of the Braden Scale and New Injury Severity Score. NISS – New Injury Severity Score Black dots are individual patients, blue line is a reference line, red curve is the fitted quadratic curve, dark red area corresponds to the 95% confidence interval, and light red area corresponds to the 95% prediction interval. The figure was created with Origin Software (OriginPro 2019b, version 9.6.5.169, OriginLab Corp).
 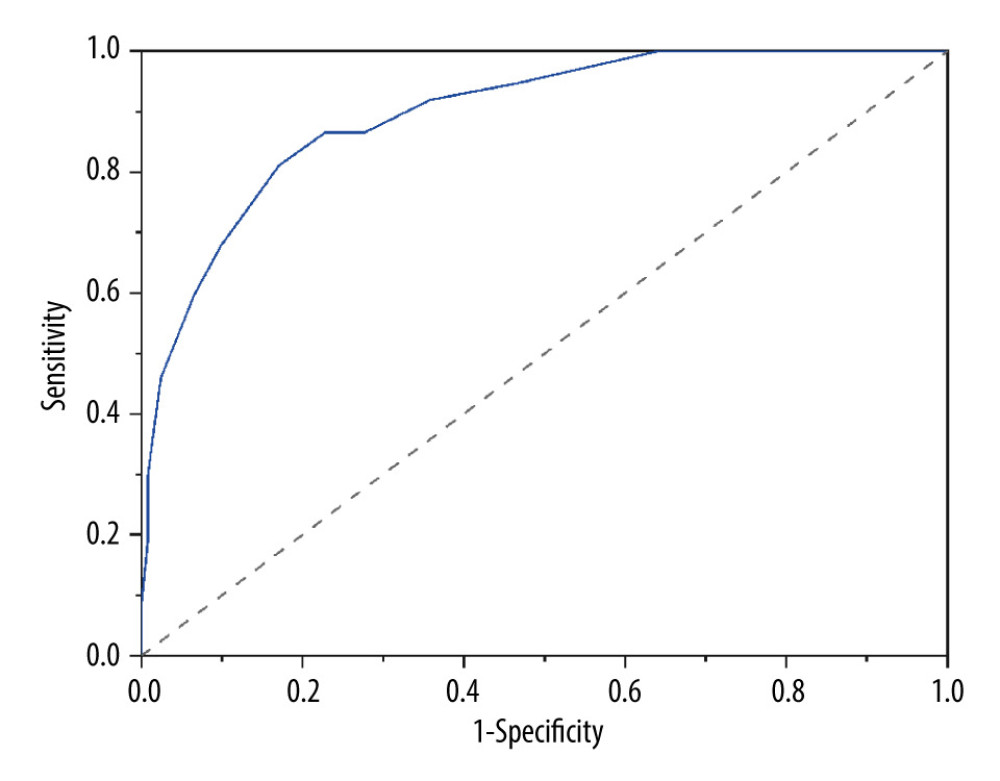 Figure 2. Receiver operating characteristic (ROC) curve analysis: Ability of the Braden Scale to predict injury severity. The area under the ROC curve (AUC) for predicting injury severity was 0.896 (0.840, 0.953). The cut-off value of the Braden Scale was 17 based on the Youden index, with a sensitivity of 81.08% (64.29%, 91.44%) and specificity of 82.93% (74.85%, 88.89%). The ROC curve analysis was conducted with MedCalc software (MedCalc, MedCalc Software Ltd).
 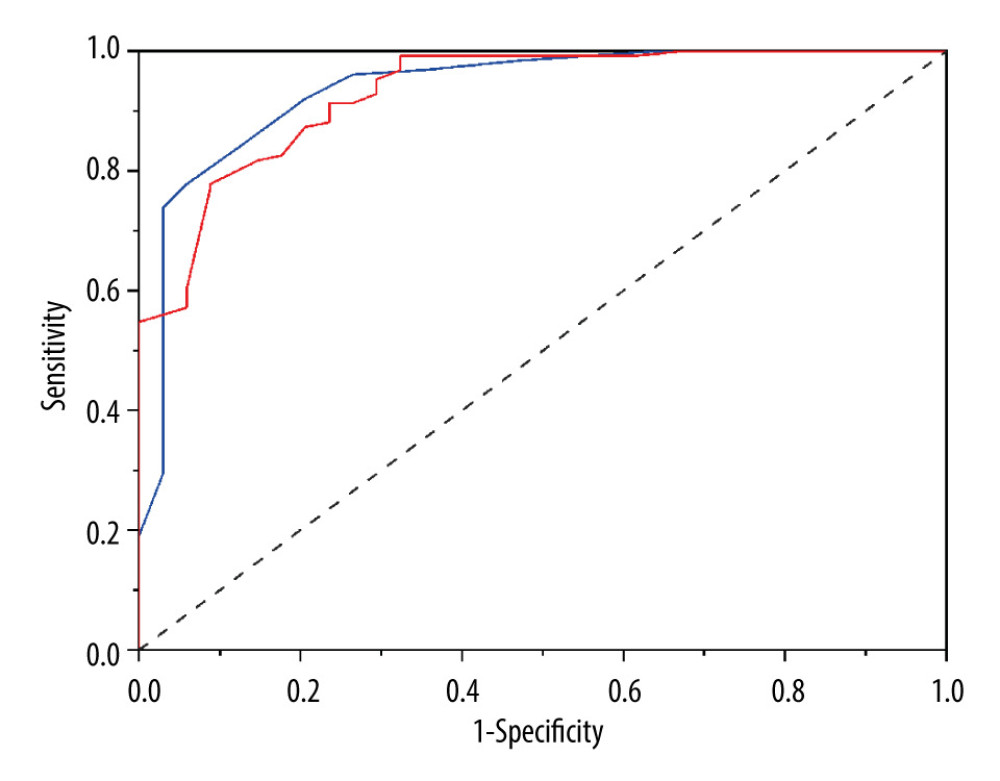 Figure 3. Comparison of Braden Scale-Based Injury Score and New Injury Severity Score for predicting 30-day hospital discharge. The area under the receiver operating characteristic (ROC) curve of 30-day hospital discharge was 0.931 (range: 0.880–0.965) for the New Injury Severity Score (red line) and 0.937 (0.888–0.970) for the Braden Scale-based injury score (blue line) (Z=0.291, P=0.771, Delong test). The ROC curve analysis was conducted with MedCalc software (MedCalc, MedCalc Software Ltd).
 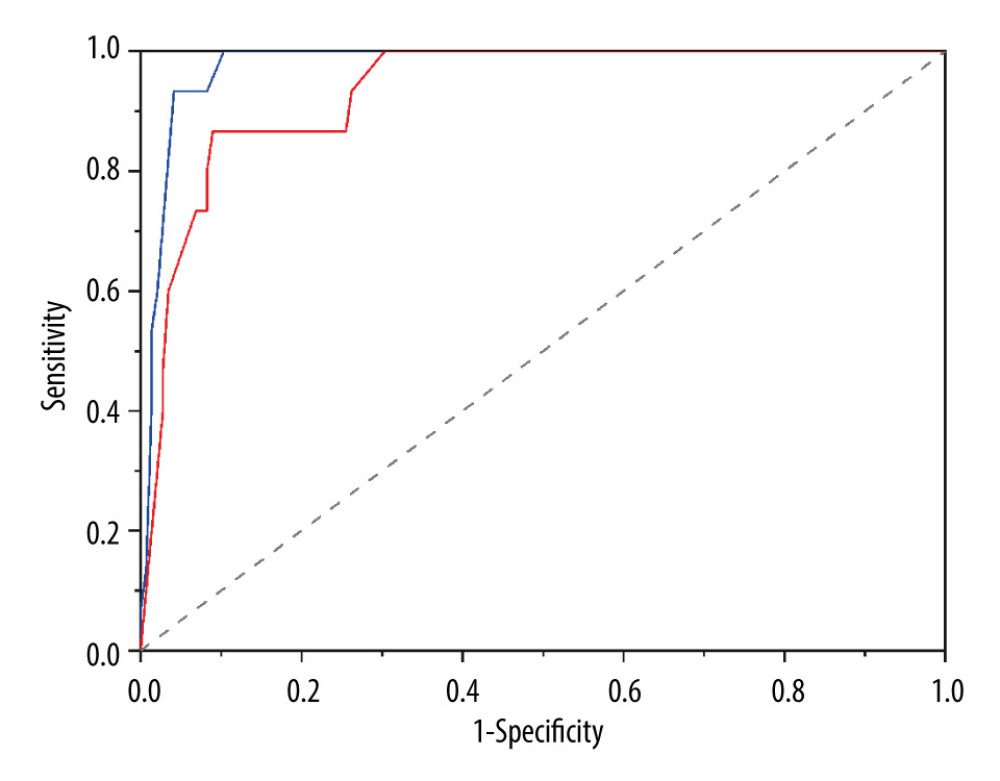 Figure 4. Comparison of Braden Scale-Based Injury Score and New Injury Severity Score for predicting and intensive care unit (ICU) admission rates. The area under the receiver operating characteristic (ROC) curve of the ICU admission was 0.977 (0.941–0.994) for the NISS (red line) and 0.977 (0.884–0.967) for the Braden Scale-based injury score (blue line) (Z=2.016, P=0.0438, Delong test). The ROC curve analysis was conducted with MedCalc software (MedCalc, MedCalc Software Ltd).
 Tables
Table 1. Patient characteristics and potential predictors of injury severity.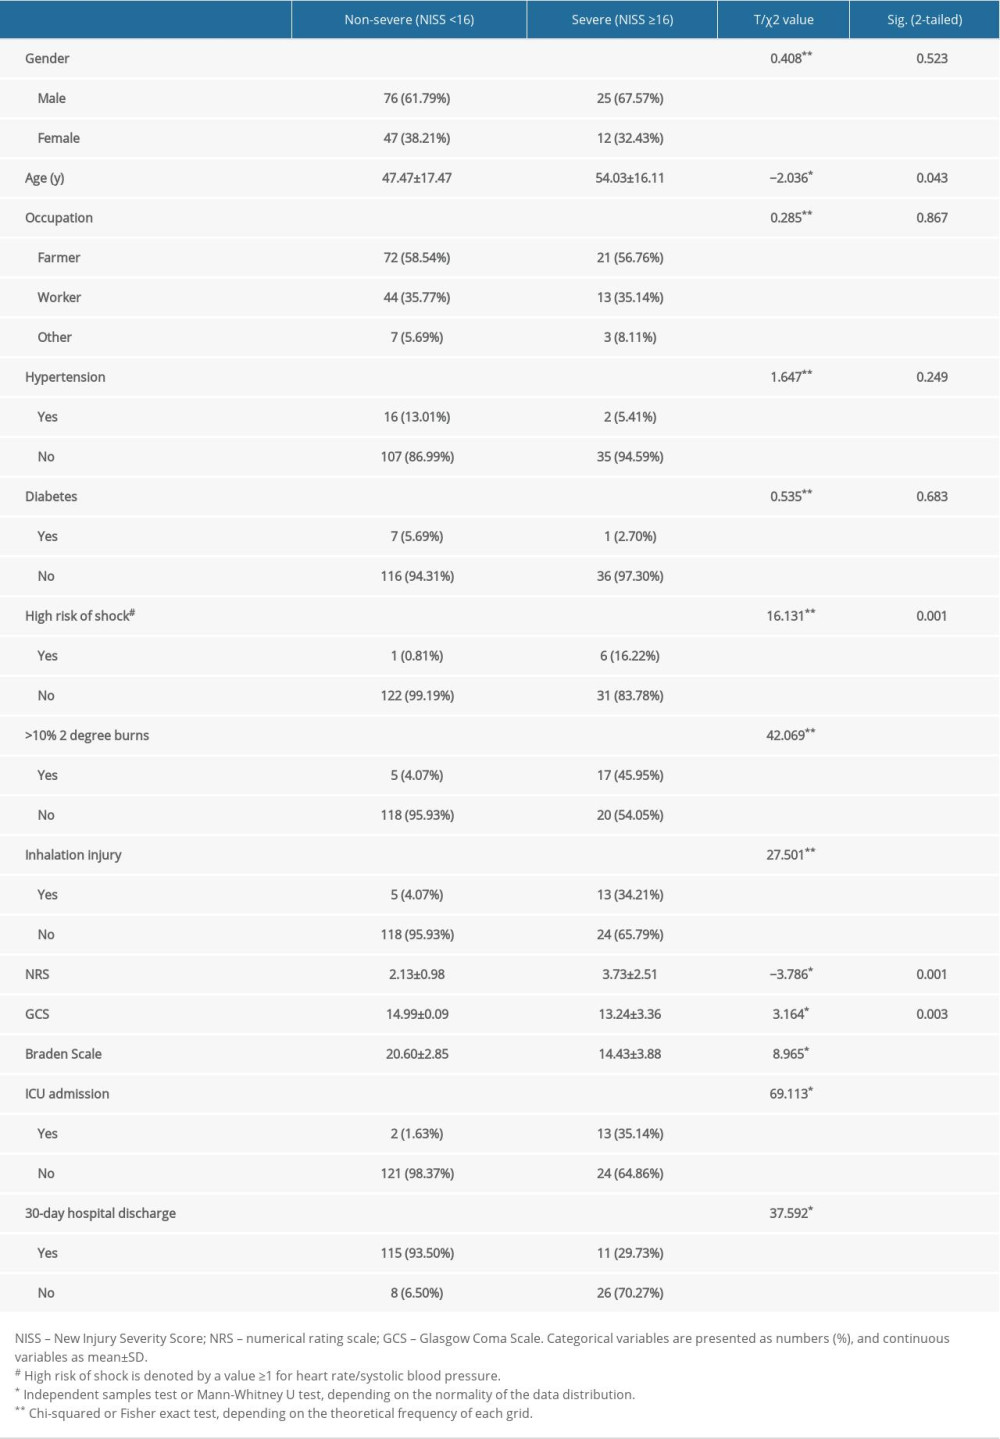 Table 2. The multivariate logistic regression between potential predictor markers and injury severity.
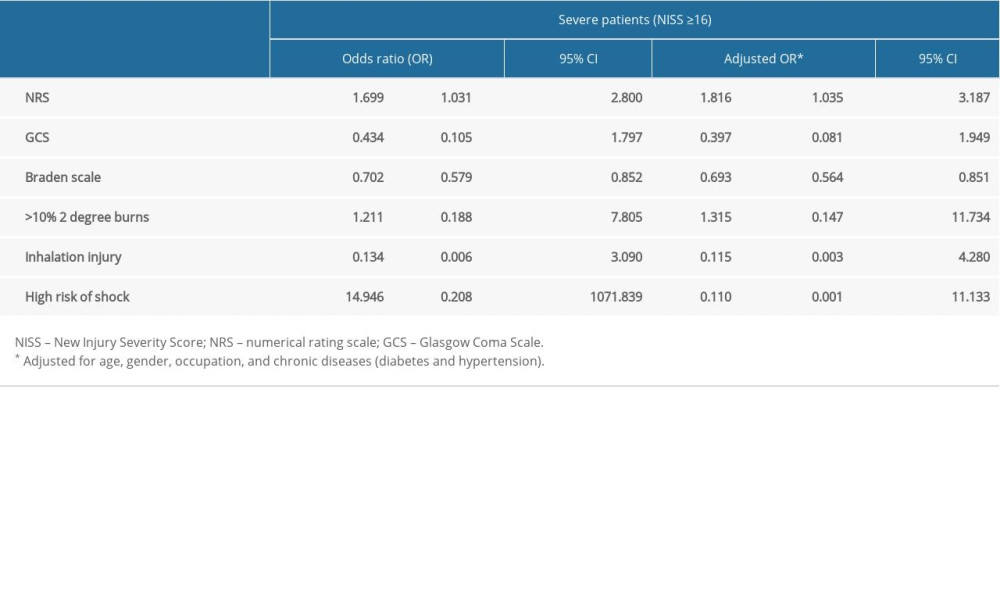 Table 3. Correlation analysis of different variables with New Injury Severity Score.
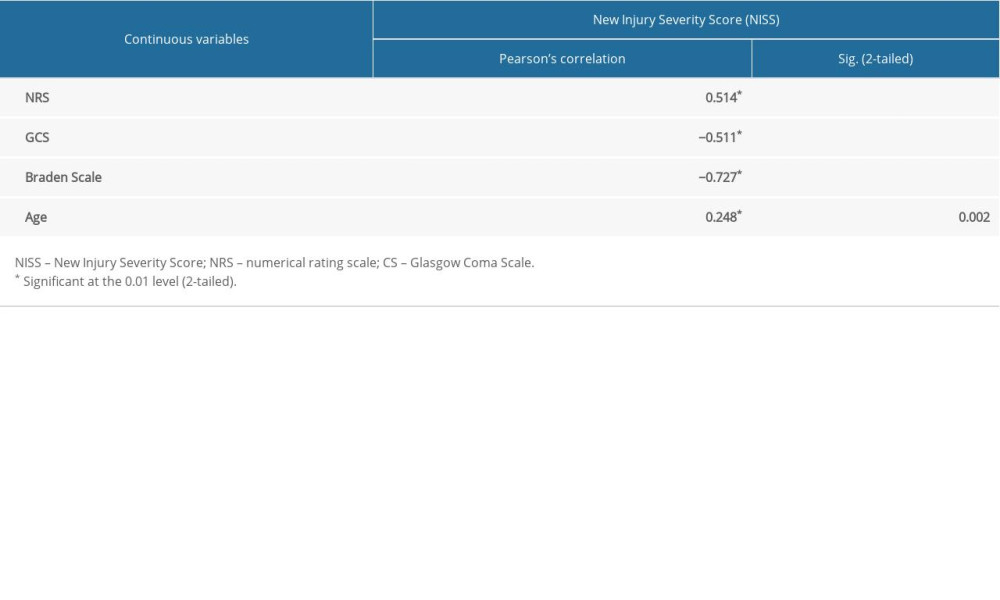 Table 4. Linear and non-linear fitting models of the Braden Scale with the New Injury Severity Score.
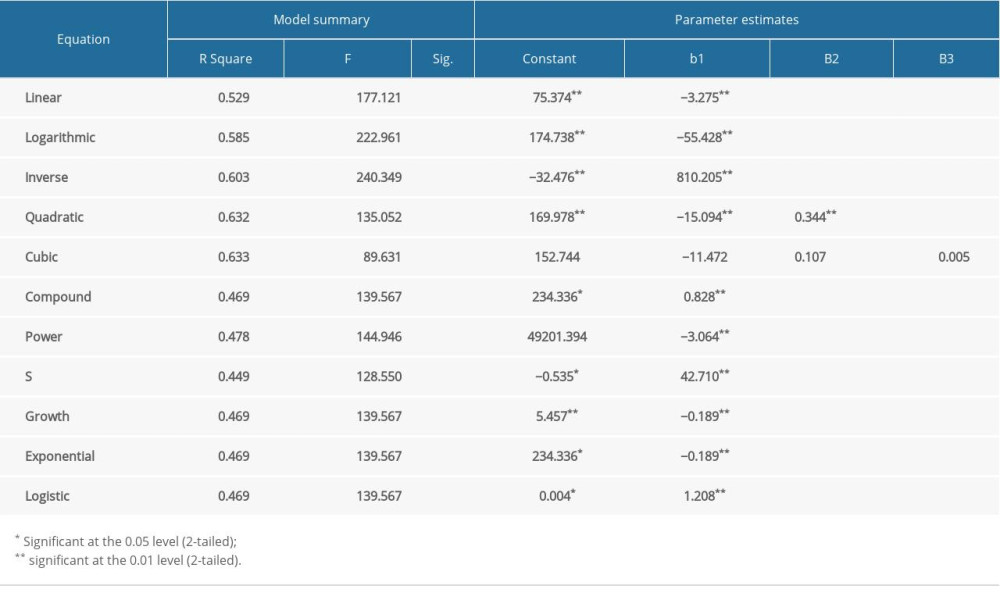
References
1. Yu M, Lv Q, Ding H, Evaluation of blast injury patients from the 2015 Tianjin explosions in China: Burns, 2016; 42(5); 1133-40
2. Liu Y, Wu P, Ho JK, Epidemiology of bus fires in mainland China from 2006 to 2015: Burns, 2018; 44(4); 995-99
3. Hughes A, Almeland SK, Leclerc T, Recommendations for burns care in mass casualty incidents: WHO Emergency Medical Teams Technical Working Group on Burns (WHO TWGB) 2017–2020: Burns, 2021; 47(2); 349-70
4. Salehi O, Tabibzadeh Dezfuli SA, Namazi SS, A new injury severity score for predicting the length of hospital stay in multiple trauma patients: Trauma Mon, 2016; 21(1); e20349
5. Shen X, Yan Y, Li X, Analysis on tank truck accidents involved in road hazardous materials transportation in china: Traffic Inj Prev, 2014; 15(7); 762-68
6. Chuang S, Chang KS, Woods DD, Beyond surge: Coping with mass burn casualty in the closest hospital to the Formosa Fun Coast Dust Explosion: Burns, 2019; 45(4); 964-73
7. Tobert D, von Keudell A, Rodriguez EK, Lessons from the Boston marathon bombing: An orthopaedic perspective on preparing for high-volume trauma in an urban academic center: J Orthop Trauma, 2015; 29(Suppl 10); S7-10
8. Considine J, LeVasseur SA, Villanueva E, The Australasian Triage Scale: Examining emergency department nurses’ performance using computer and paper scenarios: Ann Emerg Med, 2004; 44(5); 516-23
9. Christ M, Grossmann F, Winter D, Modern triage in the emergency department: Dtsch Arztebl Int, 2010; 107(50); 892-98
10. Nishi FA, Polak C, Cruz D, Sensitivity and specificity of the Manchester Triage System in risk prioritization of patients with acute myocardial infarction who present with chest pain: Eur J Cardiovasc Nurs, 2018; 17(7); 660-66
11. Cairós-Ventura LM, de Las Mercedes Novo-Muñoz M, Rodríguez-Gómez J, Validity and reliability of the Emergency Severity Index in a Spanish hospital: Int J Environ Res Public Health, 2019; 16(22); 4567
12. Ferrandini Price M, Arcos González P, Pardo Ríos M, Comparison of the simple triage and rapid treatment system versus the prehospital advanced triage model in multiple-casualty events: Emergencias, 2018; 30(4); 224-30
13. Ng C-J, You S-H, Wu IL, Introduction of a mass burn casualty triage system in a hospital during a powder explosion disaster: A retrospective cohort study: World J Emerg Surg, 2018; 13(1); 38
14. Atiyeh B, Gunn SW, Dibo S, Primary triage of mass burn casualties with associated severe traumatic injuries: Ann Burns Fire Disasters, 2013; 26(1); 48-52
15. Jhakal A, Sagar S, Kumar S, Comparison of ISS, NISS, and RTS score as predictor of mortality in pediatric fall: Burns Trauma, 2017; 5; 25
16. Sasser SM, Hunt RC, Faul M, Guidelines for field triage of injured patients: Recommendations of the National Expert Panel on Field Triage, 2011: MMWR Recomm Rep, 2012; 61(Rr-1); 1-20
17. Vassallo J, Fuller G, Smith JE, Relationship between the Injury Severity Score and the need for life-saving interventions in trauma patients in the UK: Emerg Med J, 2020; 37(8); 502-7
18. Abajas Bustillo R, Amo Setién FJ, Ortego Mate C, Predictive capability of the injury severity score versus the new injury severity score in the categorization of the severity of trauma patients: A cross-sectional observational study: Eur J Trauma Emerg Surg, 2020; 46(4); 903-11
19. Surowiecka-Pastewka A, Witkowski W, Kawecki M, A new triage method for burn disasters: Fast Triage in Burns (FTB): Med Sci Monit, 2018; 24; 1894-901
20. Kottner J, Dassen T, Interpreting interrater reliability coefficients of the Braden scale: A discussion paper: Int J Nurs Stud, 2008; 45(8); 1238-46
21. Ding Y, Yan Y, Niu J, Braden scale for assessing pneumonia after acute ischaemic stroke: BMC Geriatr, 2019; 19(1); 259
22. Watkins AA, Castillo-Angeles M, Calvillo-Ortiz R, Braden scale for pressure ulcer risk predicts rehabilitation placement after pancreatic resection: HPB (Oxford), 2019; 21(7); 923-27
23. Cohen RR, Lagoo-Deenadayalan SA, Heflin MT, Exploring predictors of complication in older surgical patients: A deficit accumulation index and the Braden Scale: J Am Geriatr Soc, 2012; 60(9); 1609-15
24. Griswold LH, Griffin RL, Swain T, Validity of the Braden Scale in grading pressure ulcers in trauma and burn patients: J Surg Res, 2017; 219; 151-57
25. Guo XX, Li ZJ, Li H, Organization and management of the treatment for the wounded in 8.12 Tinjin Port Explosion, China: Chin J Traumatol, 2015; 18(6); 323-25
26. Obuchowski NA, Bullen JA, Receiver operating characteristic (ROC) curves: Review of methods with applications in diagnostic medicine: Phys Med Biol, 2018; 63(7); 07TR01
27. Sundaram V, Lim J, Tholey DM, The Braden Scale, A standard tool for assessing pressure ulcer risk, predicts early outcomes after liver transplantation: Liver Transpl, 2017; 23(9); 1153-60
28. Tsai LH, Huang CH, Su YC, Comparison of prehospital triage and five-level triage system at the emergency department: Emerg Med J, 2017; 34(11); 720-25
29. Thom D, Appraising current methods for preclinical calculation of burn size – a pre-hospital perspective: Burns, 2017; 43(1); 127-36
30. Vercruysse GA, Alam HB, Martin MJ, Western Trauma Association critical decisions in trauma: Preferred triage and initial management of the burned patient: J Trauma Acute Care Surg, 2019; 87(5); 1239-43
31. Deutsch CJ, Tan A, Smailes S, The diagnosis and management of inhalation injury: An evidence based approach: Burns, 2018; 44(5); 1040-51
32. Hawker GA, Mian S, Kendzerska T, Measures of adult pain: Visual Analog Scale for Pain (VAS Pain), Numeric Rating Scale for Pain (NRS Pain), McGill Pain Questionnaire (MPQ), Short-Form McGill Pain Questionnaire (SF-MPQ), Chronic Pain Grade Scale (CPGS), Short Form-36 Bodily Pain Scale (SF-36 BPS), and Measure of Intermittent and Constant Osteoarthritis Pain (ICOAP): Arthritis Care Res (Hoboken), 2011; 63(Suppl 11); S240-52
33. Tohira H, Jacobs I, Mountain D, Comparisons of the outcome prediction performance of injury severity scoring tools using the Abbreviated Injury Scale 90 Update 98 (AIS 98) and 2005 Update 2008 (AIS 2008): Ann Adv Automot Med, 2011; 55; 255-65
34. Schisterman EF, Perkins NJ, Liu A, Optimal cut-point and its corresponding Youden Index to discriminate individuals using pooled blood samples: Epidemiology, 2005; 16(1); 73-81
35. Zhu H, Zhang X, Li X, Prediction of pathological nodal stage of locally advanced rectal cancer by collective features of multiple lymph nodes in magnetic resonance images before and after neoadjuvant chemoradiotherapy: Chin J Cancer Res, 2019; 31(6); 984-92
36. Shafshak TS, Elnemr R, The Visual Analogue Scale versus Numerical Rating Scale in measuring pain severity and predicting disability in low back pain: J Clin Rheumatol, 2020; 27(7); 282-85
37. Hoff JJ, Carroll G, Hong R, Presence of undertriage and overtriage in simple triage and rapid treatment: Am J Disaster Med, 2017; 12(3); 147-54
38. Zhang JJ, Wang TB, Fan D, Medical response to the Tianjin explosions: Lessons learned: Disaster Med Public Health Prep, 2018; 12(3); 411-14
39. Czapran A, Headdon W, Deane AM, International observational study of nutritional support in mechanically ventilated patients following burn injury: Burns, 2015; 41(3); 510-18
40. Berger MM, Pantet O, Nutrition in burn injury: Any recent changes?: Curr Opin Crit Care, 2016; 22(4); 285-91
41. Ashkenazi I, Schecter WP, Peleg K, Glasgow Coma Scale score in survivors of explosion with possible traumatic brain injury in need of neurosurgical intervention: JAMA Surg, 2016; 151(10); 954-58
Figures
 Figure 1. Quadratic fitting of the Braden Scale and New Injury Severity Score. NISS – New Injury Severity Score Black dots are individual patients, blue line is a reference line, red curve is the fitted quadratic curve, dark red area corresponds to the 95% confidence interval, and light red area corresponds to the 95% prediction interval. The figure was created with Origin Software (OriginPro 2019b, version 9.6.5.169, OriginLab Corp).
 Figure 2. Receiver operating characteristic (ROC) curve analysis: Ability of the Braden Scale to predict injury severity. The area under the ROC curve (AUC) for predicting injury severity was 0.896 (0.840, 0.953). The cut-off value of the Braden Scale was 17 based on the Youden index, with a sensitivity of 81.08% (64.29%, 91.44%) and specificity of 82.93% (74.85%, 88.89%). The ROC curve analysis was conducted with MedCalc software (MedCalc, MedCalc Software Ltd).
 Figure 3. Comparison of Braden Scale-Based Injury Score and New Injury Severity Score for predicting 30-day hospital discharge. The area under the receiver operating characteristic (ROC) curve of 30-day hospital discharge was 0.931 (range: 0.880–0.965) for the New Injury Severity Score (red line) and 0.937 (0.888–0.970) for the Braden Scale-based injury score (blue line) (Z=0.291, P=0.771, Delong test). The ROC curve analysis was conducted with MedCalc software (MedCalc, MedCalc Software Ltd).
 Figure 4. Comparison of Braden Scale-Based Injury Score and New Injury Severity Score for predicting and intensive care unit (ICU) admission rates. The area under the receiver operating characteristic (ROC) curve of the ICU admission was 0.977 (0.941–0.994) for the NISS (red line) and 0.977 (0.884–0.967) for the Braden Scale-based injury score (blue line) (Z=2.016, P=0.0438, Delong test). The ROC curve analysis was conducted with MedCalc software (MedCalc, MedCalc Software Ltd).
 Tables
 Table 1. Patient characteristics and potential predictors of injury severity.
 Table 2. The multivariate logistic regression between potential predictor markers and injury severity.
 Table 3. Correlation analysis of different variables with New Injury Severity Score.
 Table 4. Linear and non-linear fitting models of the Braden Scale with the New Injury Severity Score.
 Table 1. Patient characteristics and potential predictors of injury severity.
 Table 2. The multivariate logistic regression between potential predictor markers and injury severity.
 Table 3. Correlation analysis of different variables with New Injury Severity Score.
 Table 4. Linear and non-linear fitting models of the Braden Scale with the New Injury Severity Score.
 In Press
07 Mar 2024 : Clinical Research
Knowledge of and Attitudes Toward Clinical Trials: A Questionnaire-Based Study of 179 Male Third- and Fourt...Med Sci Monit In Press; DOI: 10.12659/MSM.943468
08 Mar 2024 : Animal Research
Modification of Experimental Model of Necrotizing Enterocolitis (NEC) in Rat Pups by Single Exposure to Hyp...Med Sci Monit In Press; DOI: 10.12659/MSM.943443
18 Apr 2024 : Clinical Research
Comparative Analysis of Open and Closed Sphincterotomy for the Treatment of Chronic Anal Fissure: Safety an...Med Sci Monit In Press; DOI: 10.12659/MSM.944127
08 Mar 2024 : Laboratory Research
Evaluation of Retentive Strength of 50 Endodontically-Treated Single-Rooted Mandibular Second Premolars Res...Med Sci Monit In Press; DOI: 10.12659/MSM.944110
Most Viewed Current Articles
17 Jan 2024 : Review article
Vaccination Guidelines for Pregnant Women: Addressing COVID-19 and the Omicron VariantDOI :10.12659/MSM.942799
Med Sci Monit 2024; 30:e942799
14 Dec 2022 : Clinical Research
Prevalence and Variability of Allergen-Specific Immunoglobulin E in Patients with Elevated Tryptase LevelsDOI :10.12659/MSM.937990
Med Sci Monit 2022; 28:e937990
16 May 2023 : Clinical Research
Electrophysiological Testing for an Auditory Processing Disorder and Reading Performance in 54 School Stude...DOI :10.12659/MSM.940387
Med Sci Monit 2023; 29:e940387
01 Jan 2022 : Editorial
Editorial: Current Status of Oral Antiviral Drug Treatments for SARS-CoV-2 Infection in Non-Hospitalized Pa...DOI :10.12659/MSM.935952
Med Sci Monit 2022; 28:e935952


