14 February 2022: Lab/In Vitro Research
Novel Insights into the Stemness and Immune Privilege of Mesenchymal Stem Cells from Human Wharton Jelly by Single-Cell RNA Sequencing
Zikuan Leng1ACEFG*, Longyu Li1BCF, Xiang Zhou2BDF, Guangyao Dong3BCE, Songfeng Chen1DEF, Guowei Shang1CDE, Hongwei Kou1DF, Bo Yang4ADF, Hongjian Liu1AFDOI: 10.12659/MSM.934660
Med Sci Monit 2022; 28:e934660
Abstract
BACKGROUND: Fundamental and clinical interest in mesenchymal stem cells (MSCs) has risen dramatically over the past 3 decades. The immunomodulatory and differentiation abilities are the main mechanisms in vitro and in vivo. However, increasing evidence casts doubt on the stemness and immunogenicity of MSCs.
MATERIAL AND METHODS: We conducted a high-throughput 10x RNA sequencing and Smart-seq2 scRNA-seq analysis to reveal gene expression of Wharton jelly MSCs (WJ-MSCs) at a single-cell level. Multipotent differentiation, subpopulations, marker genes, human leucocyte antigen (HLA) gene expression, and cell cluster trajectory analysis were evaluated.
RESULTS: The WJ-MSCs had considerable heterogeneity between cells in terms of gene expression. They highly, partially, and hardly expressed genes related to mesodermal differentiation, endodermal differentiation, and ectodermal differentiation, respectively. Some cells seem to be bipotent or unipotent stem cells. Further, Monocle and cell cluster trajectory analysis demonstrated that 1 of the 3 divided clusters performed as stem cells, accounting for 12.6% of the population. The marker genes for a stem cell cluster were CRIM1, GLS, PLOD2, NEXN, ACTR2, FN1, MBNL1, LMOD1, COL3A1, NCL, SEC62, EPRS, COL5A2, COL8A1, and VCAN. In addition, the MSCs also highly, partially, and hardly expressed HLA-I antigen genes, HLA-II genes, and the HLA-G gene, respectively, indicating that MSCs probably have immunogenicity. A Kyoto Encyclopedia of Genes and Genomes pathway analysis of the 3 clusters demonstrated that they were mainly connected with viral infectious diseases, cancer, and endocrine and metabolic disorders. The most expressed transcription factors were zf-C2H2, HMG/HMGY, and Homeobox.
CONCLUSIONS: We found that only a subpopulation of WJ-MSCs are real stem cells and WJ-MSCs probably do not have immune privilege.
Keywords: Genetic Heterogeneity, immune privilege, Mesenchymal Stem Cells, RNA-Seq, Cell Proliferation, Humans, RNA, Sequence Analysis, RNA, Transcription Factors, Umbilical Cord, Wharton Jelly
Background
The therapeutic and regenerative potential of mesenchymal stem cells (MSCs) has been widely and successfully investigated from basic research to clinical trials since the first report on bone marrow cells in 1961 [1]. Bone marrow, the umbilical cord (UC), and adipose tissue are the main sources of MSCs [2]. At present, there are almost 10 000 records related to MSCs in the Web of Science core database. Overall, MSCs play a positive role through 2 mechanisms, namely immunomodulatory effects and regenerative abilities [3,4]. Various types of cytokines secreted by MSCs regulate the inflammation process, and MSCs can directly interact with immune cells for immunomodulation [5,6]. In vitro, MSCs are expected to differentiate into osteocytes, adipocytes, and chondrocytes (mesodermal cells). They can also differentiate into neuronal cells/peripheral glia cells (ectodermal cells) and pancreatic cells/hepatocytes (endodermal cells) under specific induction conditions and restore damaged functions [7,8]. Remarkably, MSCs do not express
Although the short-term safety and effectiveness of MSC-based cell therapy has been extensively evaluated, 2 challenges remain. First, MSCs are a heterogenous cell population rather than a clonal population [11]. As a group, MSCs exhibit triploblastic differentiation ability under specific induction conditions, but the efficiency is low. For example, only 3% of MSCs can differentiate into microtubule-associated protein 2-positive neurons (ectoderm) [12], and approximately 5% can differentiate into insulin-positive β cells (endodermal) [13]. As for the expected differentiation, only 10% to 25% of MSCs differentiate into alkaline phosphatase-positive osteocytes (mesoderm) [14]. These reports suggest that not all MSCs can participate in triploblastic differentiation; hence, only a small subpopulation of MSCs may have pluripotency. Another hypothesis is that MSCs are composed of various types of bipotent/unipotent stem cells, and each type promotes ectodermal, mesodermal, or endodermal lineage differentiation, respectively. Individual cells may not be pluripotent, but the population as a whole is pluripotent. Second, the administration of allogeneic MSCs in regenerative medicine has usually been impaired by a very low survival rate in vivo (<3%) [15]. Most engrafted MSCs are immunologically rejected in 1 month in a severe stress environment, leading to the impairment of the functional recovery that appeared at the early stage through the immunoregulation effect of MSCs [16]. Thus, the immunogenicity of MSCs needs further exploration at the gene level.
To reveal the individual characteristics of MSCs fundamentally, we conducted a 10x Genomics high-throughput RNA sequencing clustering analysis of UC-MSCs to reveal gene expression at the single-cell level. In addition, Smart-seq2 single-cell RNA sequencing (scRNA-seq) analysis was used to quantify gene expression. To the best of our knowledge, this report is the first 10x scRNA-seq survey providing comprehensive, unbiased analysis of all MSC types and states based on individual gene activity. This study provides some new clues for the basic properties of MSCs.
Material and Methods
UMBILICAL CORD, SUPPLIES, AND REAGENTS:
This study involved 4 umbilical cords donated by maternity patients who provided informed consent. Before collecting the cord, we tested the patients’ blood for infectious viruses and other conditions. This study was approved by the Ethics Committee of the First Affiliated Hospital of Zhengzhou University (2021-KY-0275-002).
CELL CULTURING:
WJ tissue was dissociated from the cord, and WJ-MSCs were collected according to a previously reported process [17]. Briefly, the vein and artery vessels were removed, and then the mesenchymal tissue was removed from the WJ using a scalpel. After grinding, the tissue fragment was centrifuged down at 250×g for 5 min, treated with 2 mg/mL collagenase type solution at 37°C for 16 h, washed, and then treated with 2.5% trypsin (10×) for 30 min. Finally, the cells were seeded in the culture medium supplemented with 10% fetal bovine serum at 37°C with 5% CO2, which was regarded as the first passage. The third passage was used for the Smart-seq2 scRNA-seq analysis (3 samples) and the 10x scRNA-seq survey (1 sample).
SMART-SEQ2 SCRNA-SEQ ANALYSIS:
The Smart-seq2 protocol was applied for the single-cell transcription amplifications, and 1× Agencourt XP DNA beads (Beckman) were used to purify the cDNA products. Quality control was conducted, including the detection of
10X SCRNA-SEQ SURVEY:
Following the process used in our previous work [9], we found that the viability of the analyzed cells was more than 80%. A library was constructed by the Chromium controller (10x Genomics, Pleasanton, CA). GemCode technology was used for the nanoliter-sized GEMs (gel beads in emulsion). Lysis and barcoded reverse transcription of polyadenylated mRNA from single cells were performed inside every GEM. cDNA was fragmented and fragment ends were repaired. Quality control-pass libraries were sequenced. The final library was quantitated in 2 ways, namely the Agilent 2100 bioanalyzer instrument and real-time qPCR.
The libraries were then sequenced on an X-ten platform (BGI-Shenzhen, China). The single-cell 3′ v2 16-bp 10x barcodes were encoded at the start of Read 1, while sample index sequences were incorporated as the i7 index read. Read 1 was used to sequence 16-bp 10x barcodes and 10-bp randomers, while Read 2 was used to sequence the cDNA fragments.
ANALYSIS OF 10X SINGLE-CELL TRANSCRIPTOMICS DATA:
The analysis of 10x single-cell transcriptomics data was done according to our previous work [9]. Briefly, the raw reads were analyzed using the Cell Ranger Single Cell Software Suite [18] and R package Seurat [19]. The number of genes and unique molecule identifier (UMI) counts were examined to identify outliers, and UMI was standardized through log10 transformation to evaluate gene expression. Dimensionality reduction was dealt with by principal component analysis, followed by clustering with a graph-based clustering approach. U-MAP was then used for 2-dimensional visualization of the resulting clusters. The marker genes and differentially expressed genes (DEGs) were identified with the Find Conserved Markers function in the Seurat package [20], and cells expressing similar DEGs were divided into the same cluster. Pseudo-time cell trajectory analysis was conducted with R package Monocle 2 [21]. In this analysis strategy, the top 1000 genes with the most significant differences between every 2 clusters were selected as the data set, and the cell quasi-temporal change trajectory was constructed through data dimensionality reduction and cell sequencing. String analysis was performed using DIAMOND (v 0.8.31) to obtain the interactions between DEGs encoding proteins [22,23]. According to the DEG results, we classified the Gene Ontology (GO) analysis and Kyoto Encyclopedia of Genes and Genomes analysis (KEGG) in 3 dimensions: biological processes, cellular components, and molecular functions. GO analysis and KEGG pathways with a false discovery rate ≤0.05 were significantly enriched. The significant levels of terms and pathways underwent Bonferroni correction with a rigorous threshold (Q value ≤0.05).
Results
CELL CULTURING AND FLOW CYTOMETRY ANALYSIS:
WJ-MSCs were successfully obtained from the cords and adhered well to the plastic dishes. Flow cytometry analysis was carried out on the third passage. The results showed that 93% of the total cell population was alive confirmed by propidium iodide staining, and over 99.00% of the cells were CD105+, CD90+, CD73+, CD44+, CD29+, CD14−, and CD45− (Figure 1).
THE OVERVIEW OF THE RNA SEQUENCING SURVEY:
A total of 12 469 cells were sequenced in the 10x survey, resulting in 881 215 280 raw reads. The median number of genes and UMIs per cell were 3224 and 14 985, respectively. In the Smart-seq2 scRNA-seq analysis, the clean reads number was 22 773 973±13 483, with a clean reads ratio of 95.9%, and the total mapping gene ratio was 83.2% based on the reference genome. The 10x survey showed that the WJ-MSCs highly expressed
GENE EXPRESSION RELATED TO CELL PROLIFERATION, COLLAGEN SECRETION, AND MULTIPOTENT DIFFERENTIATION:
Genes related to cell proliferation were highly expressed, including CCNB1, CCND1, CCNG1, CDC20, CDK4, CDKN1A, and GADD45A. Genes related to collagen secretion were also highly expressed and included COL1A1, COL1A2, COL3A1, COL6A2, COL6A1, COL5A2, COL4A1, COL4A2, COL5A1, and COL8A1. Figure 2 shows more information about the expression of these genes. In particular, the fibroblast-related genes were highly expressed. Genes related to endodermal and mesodermal direction differentiation were more highly expressed than those related to ectodermal differentiation. CD44, CDH2, CTNNA1, CTNNB1, FN1, ITGB1, NRP2, and THY1 (CD105) were the main genes connected with endodermal differentiation that were highly expressed. CEBPB, CEBPD, ADIPOR, AP2B1, FOS, and JUN were the main genes related to mesodermal differentiation that were highly expressed. Figure 3 depicts the expression of many other genes.
EXPRESSION OF HUMAN LEUCOCYTE ANTIGEN GENES:
Generally, allogeneic transplantation of MSCs does not require major histocompatibility complex match. Here, our survey revealed that WJ-MSCs highly expressed human leucocyte antigen (HLA) type I antigens, namely HLA-A, HLA-B, and HLA-C genes. Meanwhile, WJ-MSCs partially expressed HLA type II antigens, namely HLA-DPA1 and HLA-DPB1 genes (Figure 4). There was scant expression of HLA-II gene family members, such as HLA-DRA, HLA-DRB1, HLA-DRB5, HLA-DQA1, HLA-DQA2, HLA-DQB1, and HLA-DQB2. Moreover, HLA-G was not expressed at all; this gene encodes the HLA-G protein, which is the key factor in resistance to immunological rejection. The Smart-seq2 scRNA-seq analysis matched those results, and the levels of relative gene expression were 98.14±30.76 (HLA-A), 35.84±11.20 (HLA-B), 58.50±5.26 (HLA-C), 2.80±2.46 (HLA-DPA1), 1.68±1.64 (HLA-DPB1), 0.01±0.01 (HLA-DRA), 0.09±0.09 (HLA-DRB1), 0.00±0.00 (HLA-DRB5), 0.17±0.11 (HLA-DQA1), 0.00±0.00 (HLA-DQA2), 0.00±0.00 (HLA-DQB1), 0.02±0.02 (HLA-DQB2), and 1.03±0.32 (HLA-G).
CELL CLUSTER ANALYSIS:
This survey first showed the cell cluster analysis on WJ-MSCs with the Monocle 2 method by X Ten RNA sequencing. When gene expression was similar between 2 cells, they would be close to one another, as shown in Figure 5A. Finally, 12 469 cells were divided into 3 clusters by a graph-based method, namely Cluster 1 (12.6%), Cluster 2 (61.1%), and Cluster 3 (26.3%). There were 6964 DEGs belong to Cluster 1, which had significant differences compared with the other 2 clusters. Similarly, there were 8355 and 8218 DEGs in Clusters 2 and 3, respectively (Figure 5B). Upon analysis and calculation of unique DEGs in each cluster, we determined cell markers for each. Marker genes for Cluster 1 were CRIM1, GLS, PLOD2, NEXN, ACTR2, FN1, MBNL1, LMOD1, COL3A1, NCL, SEC62, EPRS, COL5A2, COL8A1, and VCAN. Marker genes for Cluster 2 were RPL31, SCRG1, RPS10, ID3, SERPINE2, SPARC, CDKN1A, S100A6, RPSA, C6orf48, EEF1A1, COX7A2L, SPON2, RPS18, and TPD52L1. Marker genes for Cluster 3 were HMGN2, EBNA1BP2, SERBP1, ENO1, NUDC, CDC20, DIRAS3, MRTO4, CLSPN, KIF2C, DEPDC1, STMN1, CDCA8, NASP, and PSRC1. Figure 5C presents a gene heatmap of the top DEGs of the whole population based on the each top 10 DEGs unique to each cluster.
CELL CLUSTER TRAJECTORY ANALYSIS:
Cell cluster trajectory analysis can provide a clear view of both branched and linear differentiation. As shown in Figure 6, all cells could be set in 5 states marked by 5 different colors, with points 1 and 2 being the quasi-differentiation branch nodes. Cluster 1 was present in all states but mainly in states 1, 4, and 5. Cluster 2 was present in state 5. Cluster 3 was present in states 1, 2, and 3 (Figure 6A, 6B). Moreover, the top 6 related genes in the pseudo-time analysis were AURKAIP1, ENO1, HNRNPR, MRTO4, SRM, and STMN1. Considering the matching relationship, Cluster 1 appeared in most periods (Figure 6C). In the form of a heat map, the top 50 genes of the 3 clusters most related to the change of quasi-time series over time are shown in Figure 7. Cluster 1 had many more genes that were more highly expressed later in time, indicating that these cells had a greater capacity to become different functional cells. However, Cluster 2 seemed to be inactive over time and Cluster 3 seemed to be stable.
GO AND KEGG ANALYSES:
For all 3 clusters, the top 2 fields related to biological processes, cellular components, and molecular functions, respectively, were cellular process and metabolic process, cell and cell part, and binding and catalytic activity. KEGG pathway analysis of the 3 clusters demonstrated that they were mainly connected with viral infectious diseases, cancer, and endocrine and metabolic disorders. Organismal systems mainly pointed to endocrine and immune systems (Figure 8). Moreover, the most expressed transcription factors were zf-C2H2, HMG/HMGY, and Homeobox.
Discussion
The concept of MSCs was first named by the biologist Arnold Caplan in 1991 [24], with numerous reports about these cells emerging afterward. The basic characteristics in vitro and applications in vivo were explored. However, the concepts of MSCs and mesenchymal stromal cells gradually became confused [25]. In 2006, the International Society for Cellular Therapy advised naming the cells “mesenchymal stromal cells” rather than MSCs and established 3 standards for identifying the cell population [26]. In addition, increasingly more researchers grew to doubt that these cells were real stem cells [27,28]. In 2010, Caplan [29] first proposed calling them “medicinal signaling cells” to more accurately reflect the fact that the cells home in on an injury and secrete bioactive factors that are immunomodulatory and trophic (regenerative), but are in fact not stem cells. In 2017, he urged this again [30]. To reveal this better, omics approaches, such as those designed to analyze the gene expression patterns of a cell, help to discover their true basic characteristics. To the best of our knowledge, the current study is the first high-throughput gene expression resolution of mesenchymal signaling cells at a single-cell level paired with Smart Seq2 scRNA-seq to quantify the gene expression level.
MSCs have powerful immunomodulatory functions through modulating innate immunity (monocytes/macrophages and dendritic cells) and adaptive immunity (T cells and B cells). MSCs impair the maturation of dendritic cells that can activate T cells. In addition, MSCs can secrete several types of anti-inflammatory cytokines, such as tumor necrosis factor-α, stimulated gene-6, nitric oxide, interleukin-10, prostaglandin E2, indoleamine 2,3 dioxygenase, Fas ligand, and Jagged1 [3]. Indeed, in our RNA sequencing, MSCs highly expressed genes of anti-inflammatory and trophic factors, such as transforming growth factor-β, vascular endothelial growth factor, epidermal growth factor, hepatocyte growth factor, leukemia inhibitory factor, galectin, nitric oxide associated 1, fibroblast growth factor, nerve growth factor, and brain-derived neurotrophic factor. Therefore, MSCs have been regarded as a useful treatment alternative for inflammatory disorders such as graft-versus-host disease, Crohn disease, systemic lupus erythematosus, and type 1 diabetes. However, most of the transplanted cells do not survive longer than 1 month in animal models. Our work suggests that MSCs highly express HLA-A/B/C, indicating that the HLA matching may be necessary to evade this risk in clinical transplantation. However, another hypothesis suggests that once the MSCs differentiate into the target functional cells, they lose immunogenicity and are rejected by the host. More research is needed to confirm these possibilities.
MSCs exhibit considerable heterogeneity that is not only from the different tissue sources of MSCs, different ages, and different cell culturing methods [6], but also from the cells themselves at the gene expression level, as shown in the current analysis. Obviously, the MSCs are not from 1 clone, and our work showed that even 2 cells from 1 sample could display much different gene expression maps. To an extent, all the genes mentioned above were differentially expressed in the 10x scRNA-seq survey. Nevertheless, our newest data show that the whole gene expression map of a population of MSCs seems to remain stable from passage 1 to 7, especially for the first 3 passages (data not shown). As for the multipotent differentiation, endodermal differentiation (expected for MSCs) is the main direction, and MSCs have scant expression of the genes related to ectodermal differentiation. Furthermore, some cells expressed genes related to endodermal and mesodermal differentiation simultaneously, while others only one type or the other; that is, some cells were bipotent, while others were unipotent. The following cell cluster and trajectory gene analysis also confirmed that only Cluster 1 (12.6% of all cells) acted as stem cells. In brief, our work provides meaningful new clues about the nature of MSCs at a single-cell gene level. More research about the subpopulations of MSCs is necessary in future.
There are 2 limitations in this work. First, there was only 1 biological repetition for the 10x scRNA-seq survey because of funding limitations, which may result in bias. Fortunately, we used the Smart-seq2 scRNA-seq method to quantify the target genes, which was less expensive as well as useful. The 10x scRNA-seq survey gave us a direct view of the gene expression map, and the quantified results in the Smart-seq2 scRNA-seq analysis matched with those results. The second limitation of our work is that it only involved in vitro analysis. The properties of cells functioning in vivo and those of their descendants that undergo expansion in culture in vitro can differ significantly, although some properties of parental cells can undoubtedly be inherited by daughter cells. In addition, our work focused on WJ-MSCs. Whether MSCs from other sources have the same characteristics needs to be explored. More well-designed in vitro and in vivo research is necessary in the future.
Conclusions
This high-throughput scRNA-seq survey and the Smart-seq2 scRNA-seq analysis provided a comprehensive gene expression analysis of WJ-MSCs. Overall, we conclude that only a subpopulation of WJ-MSCs may be real stem cells and the MSCs probably do not have immune privilege.
Figures
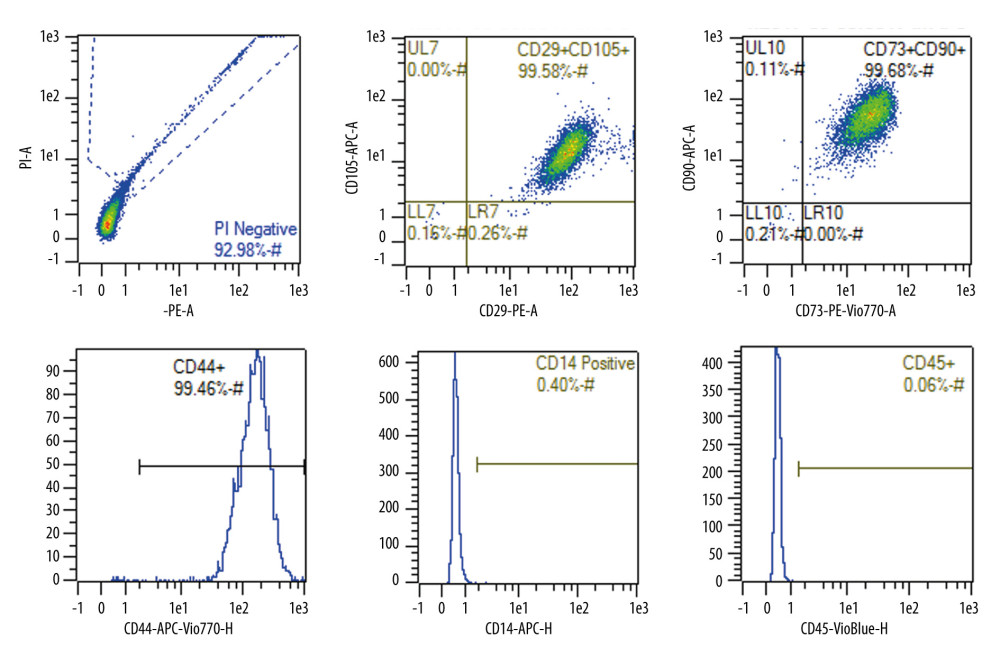 Figure 1. Identification of the isolated and cultured mesenchymal stem cells by flow cytometry.
 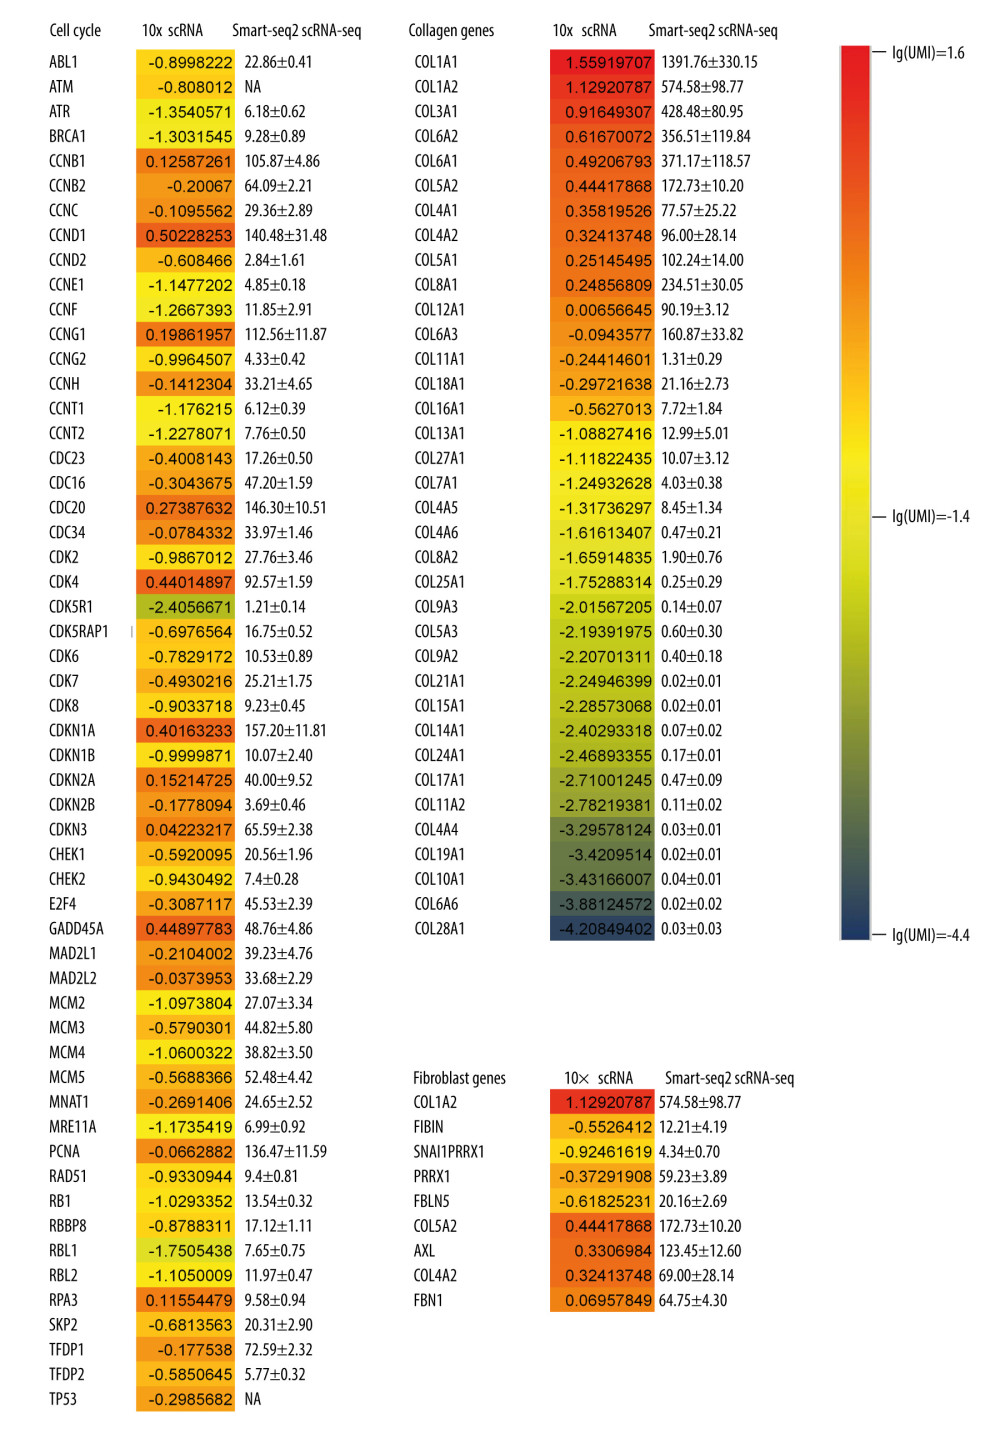 Figure 2. Gene expression of mesenchymal stem cells related to cell proliferation and collagen secretion. The data in the columns with color were from the 10x single-cell RNA sequencing (scRNA-seq) according to the unique molecular identifier (UMI) counting formulated by log10 for standardization. The Smart-seq2 scRNA-seq analysis results quantifying the gene expression are shown as mean±standard deviation. The 10x scRNA-seq survey matched the Smart-seq2 scRNA-seq very well.
 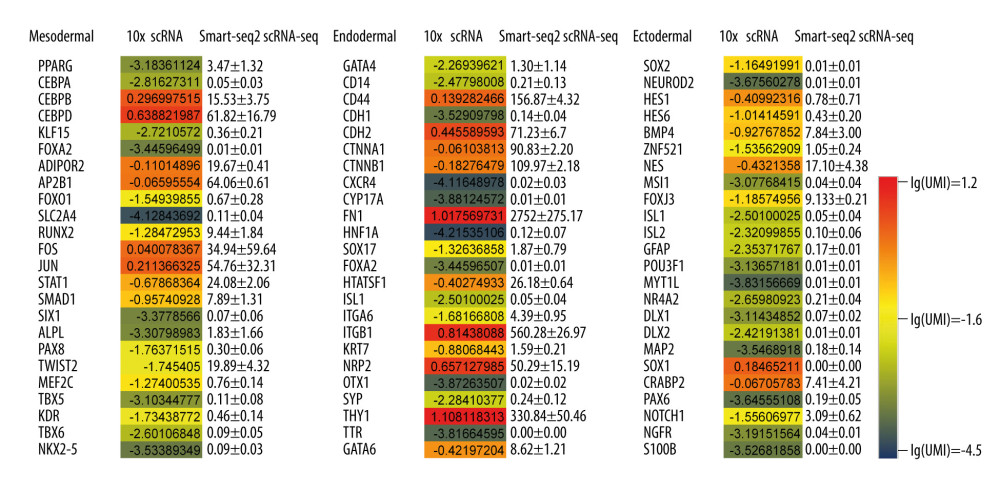 Figure 3. Gene expression related to mesodermal, endodermal, and ectodermal differentiation. Genes related to the ectodermal differentiation were scarcely expressed.
 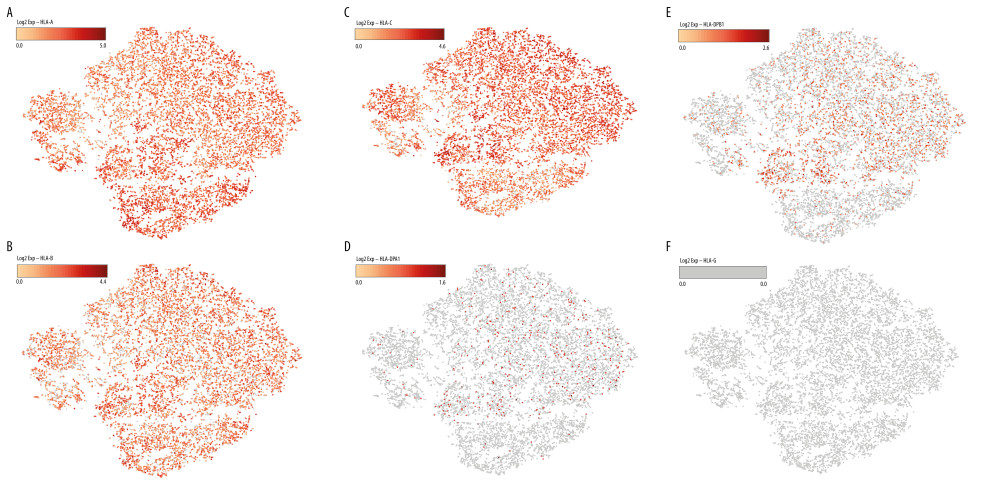 Figure 4. The 10x single-cell RNA sequencing showed the expression of human leucocyte antigen (HLA) genes: (A) HLA-A, (B) HLA-B, (C) HLA-C, (D) HLA-DPA1, (E) HLA-DPB1, and (F) HLA-G. The bar code in the upper left corner shows the intensity of the gene expression. One point represents 1 cell, and gray and red colors indicated low and high expression, respectively.
 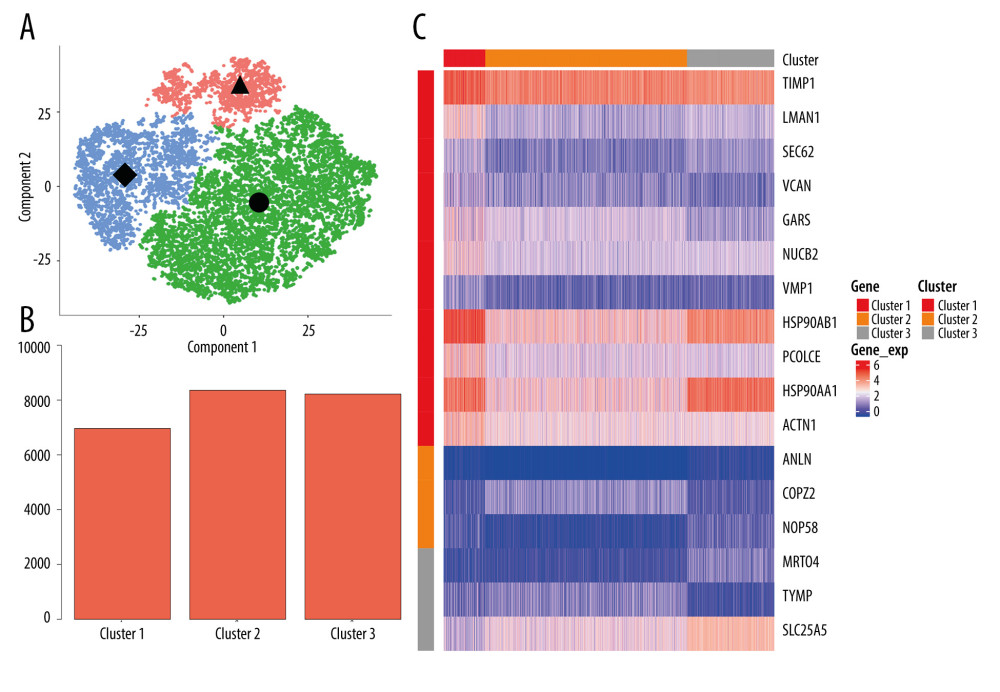 Figure 5. Monocle cell cluster analysis. (A) Three clusters were divided according to the differentially expressed genes (DEGs): Cluster 1 (▲), Cluster 2 (●), and Cluster 3 (◆). (B) The number of DEGs in each of the 3 clusters. (C) Gene heatmap of the top DEGs of the whole population based on the each top 10 DEGs unique to each cluster.
 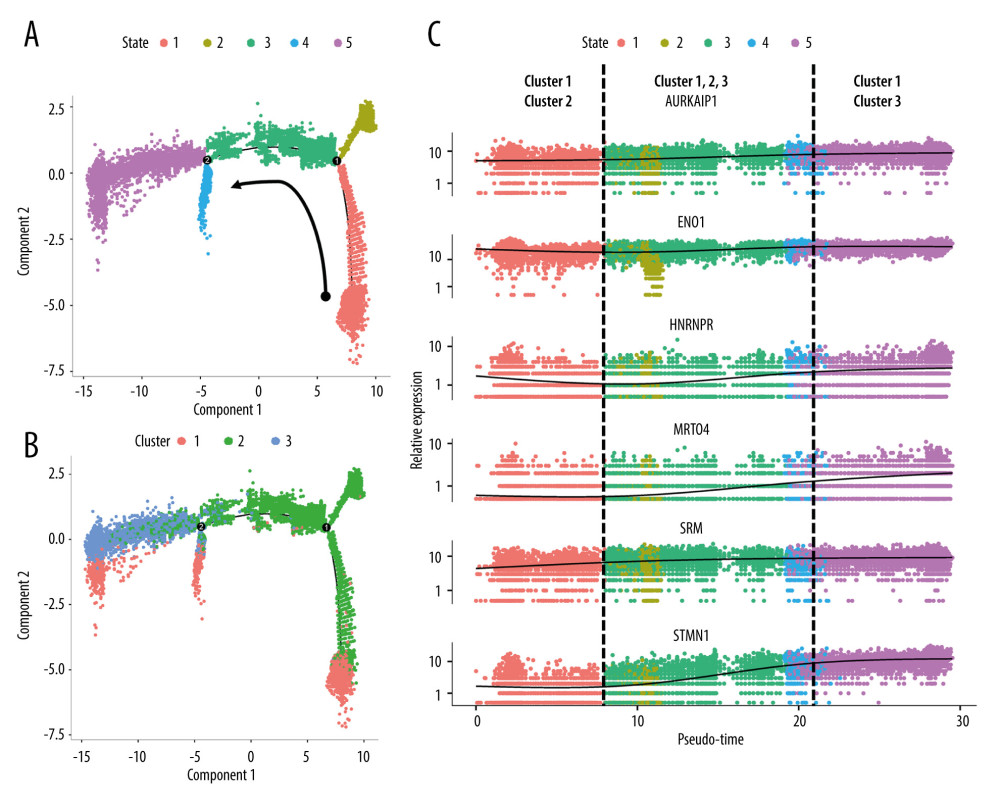 Figure 6. Cell cluster trajectory analysis. (A) Monocle analysis of mesenchymal stem cells (MSCs) cluster trajectories-state. (B) Monocle analysis of MSCs cluster trajectories-cluster. (C) Monocle analysis of the top 6 significantly differentially expressed genes in pseudo-time.
 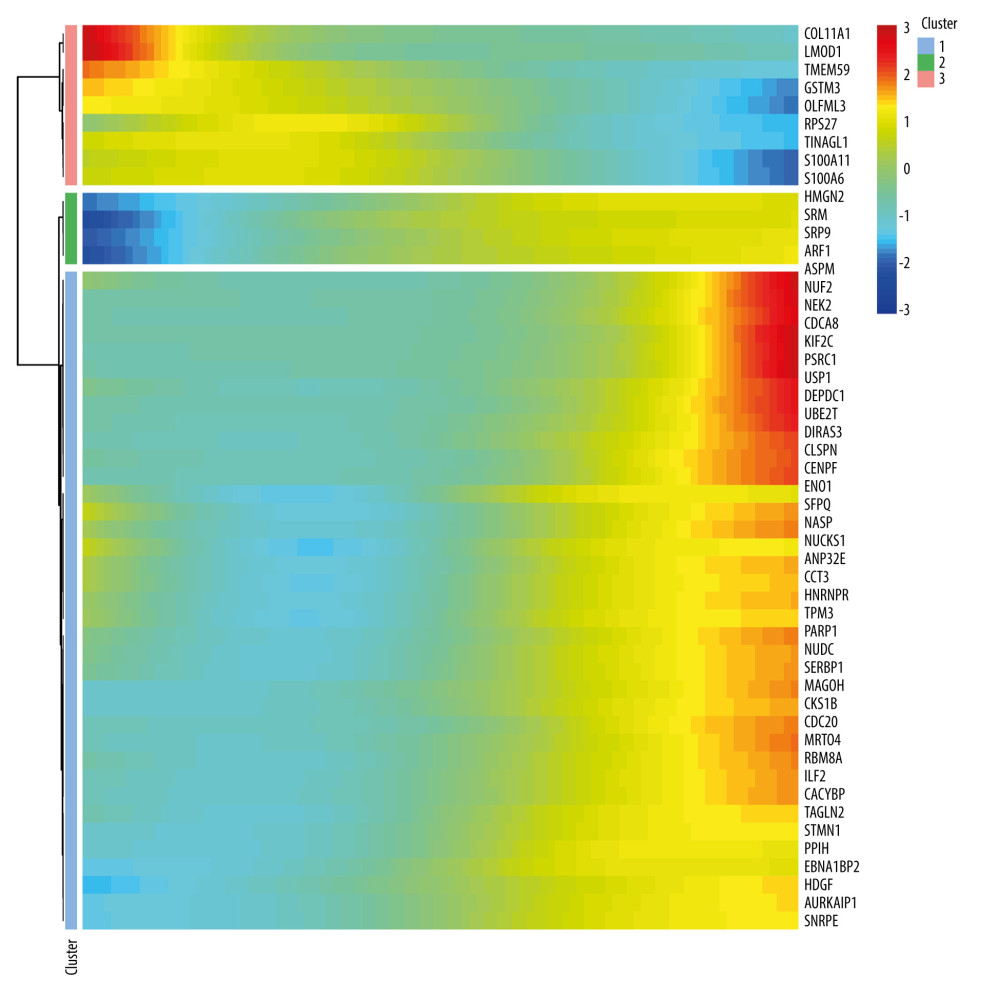 Figure 7. Monocle analysis of the top 50 significant genes in a pseudo-time heatmap.
 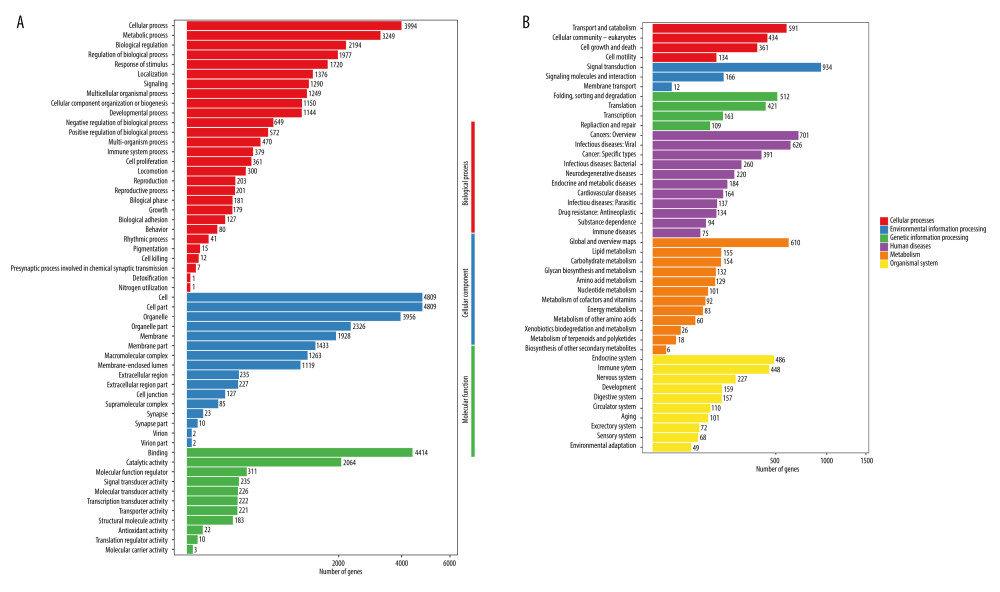 Figure 8. Gene ontology analysis (A) and Kyoto Encyclopedia of Genes and Genomes analysis (B).
 References
1. Till JE, McCulloch EA, A direct measurement of the radiation sensitivity of normal mouse bone marrow cells: Radiat Res, 1961; 14; 213-22
2. Álvarez-Viejo M, Mesenchymal stem cells from different sources and their derived exosomes: A pre-clinical perspective: World J Stem Cells, 2020; 12(2); 100-9
3. Zhuang WZ, Lin YH, Su LJ, Mesenchymal stem/stromal cell-based therapy: Mechanism, systemic safety and biodistribution for precision clinical applications: J Biomed Sci, 2021; 28(1); 28
4. Dzobo K, Recent trends in multipotent human mesenchymal stem/stromal cells: Learning from history and advancing clinical applications: OMICS, 2021; 25(6); 342-57
5. Markov A, Thangavelu L, Aravindhan S, Mesenchymal stem/stromal cells as a valuable source for the treatment of immune-mediated disorders: Stem Cell Res Ther, 2021; 12(1); 192
6. Müller L, Tunger A, Wobus M, Immunomodulatory properties of mesenchymal stromal cells: An update: Front Cell Dev Biol, 2021; 9; 637725
7. Mebarki M, Abadie C, Larghero J, Cras A, Human umbilical cord-derived mesenchymal stem/stromal cells: A promising candidate for the development of advanced therapy medicinal products: Stem Cell Res Ther, 2021; 12(1); 152
8. Huang H, Chen L, Chopp M, The 2020 yearbook of neurorestoratology: J Neurorestoratol, 2021; 9; 1-12
9. Leng Z, Zhu R, Hou W: Aging Dis, 2020; 11(2); 216-28
10. Barrett AN, Fong CY, Subramanian A, Human Wharton’s jelly mesenchymal stem cells show unique gene expression compared with bone marrow mesenchymal stem cells using single-cell RNA-sequencing: Stem Cells Dev, 2019; 28(3); 196-211
11. Mabuchi Y, Okawara C, Méndez-Ferrer S, Akazawa C, Cellular heterogeneity of mesenchymal stem/stromal cells in the bone marrow: Front Cell Dev Biol, 2021; 9; 689366
12. Rajabi H, Hosseini V, Rahimzadeh S, Current status of used protocols for mesenchymal stem cell differentiation: A focus on insulin producing, osteoblast-like and neural cells: Curr Stem Cell Res Ther, 2019; 14(7); 570-78
13. Gabr MM, Zakaria MM, Refaie AF, Insulin-producing cells from adult human bone marrow mesenchymal stem cells control streptozotocin-induced diabetes in nude mice: Cell Transplant, 2013; 22(1); 133-45
14. Mitxitorena I, Infante A, Gener B, Rodríguez CI, Suitability and limitations of mesenchymal stem cells to elucidate human bone illness: World J Stem Cells, 2019; 11(9); 578-93
15. Simerman AA, Dumesic DA, Chazenbalk GD, Pluripotent muse cells derived from human adipose tissue: A new perspective on regenerative medicine and cell therapy: Clin Transl Med, 2014; 3; 12
16. Sanabria-de la Torre R, Quiñones-Vico MI, Fernández-González A, Alloreactive immune response associated to human mesenchymal stromal cells treatment: A systematic review: J Clin Med, 2021; 10(13); 2991
17. Leng Z, Sun D, Huang Z: Cell Transplant, 2019; 28(7); 907-23
18. Zheng GX, Lau BT, Schnall-Levin M, Haplotyping germline and cancer genomes with high-throughput linked-read sequencing: Nat Biotechnol, 2016; 34(3); 303-11
19. Butler A, Hoffman P, Smibert P, Integrating single-cell transcriptomic data across different conditions, technologies, and species: Nat Biotechnol, 2018; 36(5); 411-20
20. Zhang X, Lan Y, Xu J, CellMarker: A manually curated resource of cell markers in human and mouse: Nucleic Acids Res, 2019; 47(D1); D721-28
21. Qiu X, Hill A, Packer J, Single-cell mRNA quantification and differential analysis with Census: Nat Methods, 2017; 14(3); 309-15
22. Szklarczyk D, Gable AL, Lyon D, STRING v11: Protein–protein association networks with increased coverage, supporting functional discovery in genome-wide experimental datasets: Nucleic Acids Res, 2019; 47(D1); D607-13
23. Buchfink B, Xie C, Huson DH, Fast and sensitive protein alignment using DIAMOND: Nat Methods, 2015; 12(1); 59-60
24. Caplan AI, Mesenchymal stem cells: J Orthop Res, 1991; 9(5); 641-50
25. Sipp D, Robey PG, Turner L, Clear up this stem-cell mess: Nature, 2018; 561(7724); 455-57
26. Dominici M, Le Blanc K, Mueller I, Minimal criteria for defining multipotent mesenchymal stromal cells. The International Society for Cellular Therapy position statement: Cytotherapy, 2006; 8(4); 315-17
27. García-Bernal D, García-Arranz M, Yáñez RM, The current status of mesenchymal stromal cells: Controversies, unresolved issues and some promising solutions to improve their therapeutic efficacy: Front Cell Dev Biol, 2021; 9; 650664
28. Viswanathan S, Shi Y, Galipeau J: Cytotherapy, 2019; 21(10); 1019-24
29. Caplan AI, What’s in a name?: Tissue Eng Part A, 2010; 16(8); 2415-17
30. Caplan AI, Mesenchymal stem cells: Time to change the name!: Stem Cells Transl Med, 2017; 6(6); 1445-51
Figures
 Figure 1. Identification of the isolated and cultured mesenchymal stem cells by flow cytometry.
 Figure 2. Gene expression of mesenchymal stem cells related to cell proliferation and collagen secretion. The data in the columns with color were from the 10x single-cell RNA sequencing (scRNA-seq) according to the unique molecular identifier (UMI) counting formulated by log10 for standardization. The Smart-seq2 scRNA-seq analysis results quantifying the gene expression are shown as mean±standard deviation. The 10x scRNA-seq survey matched the Smart-seq2 scRNA-seq very well.
 Figure 3. Gene expression related to mesodermal, endodermal, and ectodermal differentiation. Genes related to the ectodermal differentiation were scarcely expressed.
 Figure 4. The 10x single-cell RNA sequencing showed the expression of human leucocyte antigen (HLA) genes: (A) HLA-A, (B) HLA-B, (C) HLA-C, (D) HLA-DPA1, (E) HLA-DPB1, and (F) HLA-G. The bar code in the upper left corner shows the intensity of the gene expression. One point represents 1 cell, and gray and red colors indicated low and high expression, respectively.
 Figure 5. Monocle cell cluster analysis. (A) Three clusters were divided according to the differentially expressed genes (DEGs): Cluster 1 (▲), Cluster 2 (●), and Cluster 3 (◆). (B) The number of DEGs in each of the 3 clusters. (C) Gene heatmap of the top DEGs of the whole population based on the each top 10 DEGs unique to each cluster.
 Figure 6. Cell cluster trajectory analysis. (A) Monocle analysis of mesenchymal stem cells (MSCs) cluster trajectories-state. (B) Monocle analysis of MSCs cluster trajectories-cluster. (C) Monocle analysis of the top 6 significantly differentially expressed genes in pseudo-time.
 Figure 7. Monocle analysis of the top 50 significant genes in a pseudo-time heatmap.
 Figure 8. Gene ontology analysis (A) and Kyoto Encyclopedia of Genes and Genomes analysis (B).
 In Press
05 Mar 2024 : Clinical Research
Effects of Thermal Insulation on Recovery and Comfort of Patients Undergoing Holmium Laser LithotripsyMed Sci Monit In Press; DOI: 10.12659/MSM.942836
05 Mar 2024 : Clinical Research
Role of Critical Shoulder Angle in Degenerative Type Rotator Cuff Tears: A Turkish Cohort StudyMed Sci Monit In Press; DOI: 10.12659/MSM.943703
06 Mar 2024 : Clinical Research
Comparison of Outcomes between Single-Level and Double-Level Corpectomy in Thoracolumbar Reconstruction: A ...Med Sci Monit In Press; DOI: 10.12659/MSM.943797
21 Mar 2024 : Meta-Analysis
Economic Evaluation of COVID-19 Screening Tests and Surveillance Strategies in Low-Income, Middle-Income, a...Med Sci Monit In Press; DOI: 10.12659/MSM.943863
Most Viewed Current Articles
17 Jan 2024 : Review article
Vaccination Guidelines for Pregnant Women: Addressing COVID-19 and the Omicron VariantDOI :10.12659/MSM.942799
Med Sci Monit 2024; 30:e942799
14 Dec 2022 : Clinical Research
Prevalence and Variability of Allergen-Specific Immunoglobulin E in Patients with Elevated Tryptase LevelsDOI :10.12659/MSM.937990
Med Sci Monit 2022; 28:e937990
16 May 2023 : Clinical Research
Electrophysiological Testing for an Auditory Processing Disorder and Reading Performance in 54 School Stude...DOI :10.12659/MSM.940387
Med Sci Monit 2023; 29:e940387
01 Jan 2022 : Editorial
Editorial: Current Status of Oral Antiviral Drug Treatments for SARS-CoV-2 Infection in Non-Hospitalized Pa...DOI :10.12659/MSM.935952
Med Sci Monit 2022; 28:e935952


