03 September 2023: Clinical Research
Association Between Fatty Liver Index, Controlled Attenuation Parameter, and Metabolic Syndrome Stages: A Community-Based Study
Lee Won Chong12BDEG, Bagas Suryo Bintoro34CDEF, Ming-Hsien Tsai25DF, Yu-Min Lin12DF, Chyi-Huey Bai67ABCEG*DOI: 10.12659/MSM.940691
Med Sci Monit 2023; 29:e940691


Abstract
BACKGROUND: Controlled attenuation parameter (CAP) is a recent ultrasound-based method for measuring hepatic steatosis, which is common in patients with metabolic syndrome (MetS). The fatty liver index (FLI), an algorithm-based method, is frequently used to evaluate hepatic steatosis. This study assessed how FLI and CAP relate to the earlier MetS stage and their ability to identify it.
MATERIAL AND METHODS: A total of 170 community-based individuals were studied. Demographic information, body mass index, waist circumference, and blood pressures were collected. CAP was assessed by FibroScan. Fasting glucose, lipid tests, and γ-glutamyl transferase were measured. The CAP and FLI results were categorized into quartiles, with the MetS stages as the main outcomes. The odds ratio (OR) of the outcomes was calculated using logistic regression. The area under the curve in receiver operating characteristic analysis (AUC-ROC) was used to detect the stages of MetS. Sensitivity, specificity, and appropriate cut-offs based on ROC analysis are shown.
RESULTS: The higher the FLI or CAP category, the lower the proportion of non-MetS and the higher the proportion of moderate MetS. Each single-quartile increase in FLI and CAP was associated with an increased likelihood of being in the higher MetS stages – FLI: adjusted OR 3.1 (2.23-4.32); CAP: adjusted OR 1.96 (1.48-2.59). In the ROC analysis, FLI had a higher AUC-ROC than CAP in separating the stages of MetS, although findings were significant (P<0.001). FLI in detecting the stages of mild-to-severe versus non-MetS performed well (AUC-ROC [95% confidence interval]: 0.79 [0.72-0.87]), with high sensitivity (0.86) but low specificity (0.62).
CONCLUSIONS: FLI and CAP were positively associated with the MetS stage and its components, suggesting that they could be used as a MetS screening tool in community studies.
Keywords: metabolic syndrome, Fatty Liver, Community Health Services, Humans, Elasticity Imaging Techniques, gamma-Glutamyltransferase, Algorithms
Background
Metabolic syndrome (MetS) is a condition characterized by a group of risk factors that increase the risk of multi-end-stage organ damage, including cardiovascular diseases (CVD), diabetes, and nonalcohol fatty liver disease [1]. The recommended management of MetS is based on a 4-stage system (Stages A–D), with the recommended therapy dependent on the stage of the disease [2].
The accumulation of lipids within hepatocytes causes hepatic steatosis, which is the first stage in nonalcoholic fatty liver disease (NAFLD). NAFLD is the hepatic manifestation of MetS, which is characterized by adiposity [3]. It is a disease spectrum that includes varying degrees of simple steatosis, nonalcoholic steatohepatitis (NASH), and cirrhosis [4]. As the most common chronic liver disease, NAFLD is emerging as an important public health problem globally [5]. Based on growing evidence, NAFLD should be regarded as a systemic disease that can affect extrahepatic organs, including metabolic disorders, CVDs, chronic renal diseases, and malignancy, rather than as a liver-specific disease [6]. Because liver biopsy is the criterion standard for diagnosing NAFLD, noninvasive diagnostic methods that are comparable to histological results from biopsies are required. Emerging noninvasive methods for assessing hepatic steatosis include fatty liver index (FLI) [7] and controlled attenuation parameter (CAP) [8]. In the general Korean population, NAFLD determined by FLI correlated well with hepatic steatosis diagnosed by abdominal ultrasonography [9], and CAP is useful in grading NAFLD in general populations [10].
Besides their diagnostic potential in NAFLD, CAP and FLI are associated with MetS diagnosis. Hu et al reported that the proportion of people with MetS increases with higher CAP category [11]. Similarly, studies from Australia [12] and Taiwan [13] reported that CAP is associated with MetS and that CAP is a good predictor of MetS diagnosis, respectively.
However, limited studies have investigated the association of FLI and CAP with Sperling’s MetS staging model [2]. Most studies defined MetS as having 3 of 5 risk factors, without addressing the current recommendations on MetS staging. Without providing staging information when diagnosing MetS, metabolic abnormalities in the earlier stages are missed. In this study, we used a community of Taiwanese people to evaluate the association and detection capabilities of FLI, CAP, and MetS stages in a general population.
Material and Methods
STUDY POPULATION:
The study population was part of a community-based prospective cohort study that investigated the cardiovascular and cerebrovascular risk factors in residents of 6 villages in the Shilin District covered by Shin-Kong Wu Ho-Su Memorial Hospital [14]. The study ran between 2005 and 2006, with follow-up for over 10 years. This study was only partially implemented in 1 wave and represents a sub-study of this cohort. Herein, the inclusion criteria were: (1) age ≥50 years; (2) no prior stroke, myocardial infarction, or cancer; (3) negative for hepatitis B and C infection; (4) non-missing values for waist circumference (WC), blood pressure, fasting plasma glucose (FPG), glycated hemoglobin (HbA1C), triglyceride (TG), high-density lipoprotein cholesterol (HDL), which were for the identification of MetS; (5) non-missing values for aspartate aminotransferase (AST), alanine aminotransferase (ALT), and complete blood count, which were for fibrosis-4 (FIB-4) index; and (6) completed questionnaires at each participant’s fifth visit, which was between 2017 and 2019 [15].
The eligible participants were invited for a FibroScan assessment. A total of 178 participants completed the assessment. However, missing and questionable data values were removed during data cleaning, resulting in the inclusion of 170 participants in the final analysis (Figure 1). This study was conducted according to the guidelines of the Declaration of Helsinki and was approved by the institutional review board of Shin-Kong Wu Ho-Su Hospital, Taipei, Taiwan (approval number 20170919R, approval date: 2017-12-14), and each participant provided written informed consent prior to enrollment.
DEMOGRAPHIC AND LABORATORY DATA:
In order to complete the surveys, each participant was interviewed in person by a professional interviewer. Demographics including age, sex, and lifestyle parameters were collected. The FibroScan 8-h fasting blood samples were obtained, collected in serum, EDTA plasma, and sodium fluoride plasma (for glucose), and then stored at 80°C. Through physical examination, anthropometric and biochemical profiles were evaluated. The anthropometric measurements included height, weight, body mass index (BMI), WC, systolic blood pressure (SBP), and diastolic blood pressure (DBP). BMI is calculated by body weight (Kg) divided by the square of body height (m2). We used an automated blood pressure monitor to measure SBP and DBP. Each participant’s blood pressure was checked 2 times, once while sitting and once after a 5-min break. The 2 readings were then averaged. An autoanalyzer (Beckman, Palo Alto, CA) was used to assess blood biomarkers such as FPG, TG, HDL, low-density lipoprotein cholesterol (LDL-C), total cholesterol, AST, ALT, and g-glutamyl transferase (GGT). The glucose oxidase method was used to measure glucose, and the high-performance liquid chromatography method was used to measure HbA1C. The number of platelets per microliter of blood was calculated.
FLI, CAP, ULTRASOUND, AND FIB-4:
FLI was calculated using the Bedogni et al formula, which incorporates 4 variables (BMI, WC, serum TG, and serum GGT). The risk of fatty liver is low at a FLI <30, indeterminate at a FLI of 30–60; and high at a FLI ≥60 [7]. CAP measurement was performed using FibroScan by an experienced hepatologist. The CAP principle has previously been described [16]. In summary, CAP measures ultrasonic attenuation at 3.5 MHz. The right lobe of the participant’s liver was scanned through the intercostal spaces while lying on their back in a supine position with their right arm in maximal abduction.
CAP and FLI were categorized into quartiles (Q) for further analysis. FLI was classified into Q1: ≤7.6, Q2: 7.7–15.1, Q3: 15.2–30, and Q4: >30 while CAP was classified into Q1: ≤231 dB/m, Q2: 232–277 dB/m, Q3: 278–306 dB/m, and Q4: >306 dB/m. These classifications were compared with clinically used CAP classifications for diagnosing steatosis, which were developed based on the percentage fat in hepatocytes [17]. The categories were S0: ≤10% (≤215 dB/m), S1: 11–33% (>215 dB/m), S2: 34–66% (>252 dB/m), and S3 ≥67% (>296 dB/m) [18].
Ultrasound was performed by 3 hepatologists in our department using the Xario SSA-660A device (TOSHIBA, Japan). Predefined criteria were used to determine the severity of hepatic steatosis. These included increased hepatorenal contrast or the presence of bright echoes for steatosis grade 1 (S1) (mild steatosis); the presence of both increased hepatorenal contrast and bright echoes as well as vessel blurring for steatosis grade 2 (S2) (moderate steatosis); and the presence of posterior beam attenuation and non-visualization of the diaphragm, in addition to the criteria for S2, for steatosis grade 3 (S3) (severe steatosis). The liver image was assessed to be normal if the texture was homogenous, fine-level echoes were seen, the increases area was isoechoic compared to the renal cortex, and the hepatic vessels and diaphragm were adequately visualized [steatosis grade 0 (S0)][19].
The FIB-4 index is a test used to estimate fibrosis in liver disease and it is calculated using several parameters such as age, AST, ALT, and platelet count [20,21].
METABOLIC SYNDROME STAGING:
MetS was defined using the 5 standard risk factors: (1) elevated WC (≥90 cm for Asian men or ≥80 cm for Asian women), (2) elevated TG levels (≥150 mg/dL or drug treatment for TG), (3) reduced HDL level (≤40 mg/dL for men or ≤50 mg/dL for women or drug treatment for reduced HDL), (4) elevated systolic/diastolic BP (≥130/85 mmHg or hypertensive treatments), and (5) elevated FPG level (≥100 mg/dL or drug treatments for elevated glucose) [1].
The MetS stages developed in this study were based on staging developed during the Cardiometabolic Think Tank in 2014 [2], which acknowledges that MetS is a pathophysiological state that comprises risk factors that are both measured and unmeasured in the clinic and that there are several subtypes of MetS that lead to different types of end-organ damage. Stage A is defined as having none of the 5 MetS risk factors (non-MetS); Stage B as having 1–2 of the 5 risk factors (mild MetS); Stage C as having 3 of the 5 risk factors but without end-organ damage (moderate MetS); and Stage D as having end-organ damage (eg, CVD, diabetes, NAFLD) (severe MetS). In this study, participants with diabetes (FPG ≥126 mg/dl or HbA1C ≥6.5%) or fatty liver disease (FLI ≥60) were considered to have end-organ damage. The selected FLI cutoff for fatty liver disease was based on a previous publication [5].
STATISTICAL ANALYSES:
Statistical analysis was performed using STATA (version 14). Participants’ characteristics are presented as proportions based on their metabolic health conditions. For continuous variables, the
An ordered logistic regression analysis was performed using the lowest quartile of FLI and CAP as a reference to calculate the odds ratios (ORs) and 95% confidence interval (95% CI) of the outcomes. First, crude ORs were calculated. The model was then adjusted for sex (categorical) and age (continuous) (Model 1). The FIB-4 index (continuous) was then used to obtain Model 2. A Brant test of the proportional odds assumption was also performed to determine if ordered logistic regression analysis was appropriate [22].
For calculating the area under the receiver operating characteristic curve (AU-ROC), ROC analysis was performed in the logistic model. We developed 2 conditions as the outcome: (1) Having MetS (Stage B or C or D) versus non-MetS (Stage A) and (2) moderate-to-severe MetS (Stage C or D) versus mild-to-non-MetS (Stage A or B). The empirical cutoff values were calculated using the Youden index. The sensitivity and specificity of each outcome were calculated according to their cutoff point.
Results
STUDY POPULATION DEMOGRAPHICS AND DISEASE CHARACTERISTICS:
As shown on Table 1, a total of 170 patients were included in the analysis. The stratification of the participants by sex revealed that the majority were females (60% [102/170]). The mean age of females and males was 63.3 and 64.4 years (P=0.48), respectively, indicating that there was no significant difference in participants’ age according to sex. The mean BMI was also not significantly different between females and males (23.8 kg/m2 vs 24.8 kg/m2; P=0.069), respectively.
At baseline, 3 of the 5 MetS components were significantly different between the sexes. Females had lower WC (78.5 cm vs 85.6 cm,
The diagnostic test results showed that FLI was significantly lower in females (17.2 vs 30.9,
FLI AND CAP CORRELATE WITH METS AND THE 5 METS RISK FACTORS:
The correlation coefficient of CAP and FLI was 0.504 (P<0.000). The participants’ FLI and CAP categories were determined based on the quartiles described in the methods section and were correlated with the MetS stages and the 5 MetS risk factors (Table 2). Except for reduced HDL, all metabolic risk factors positively correlated with each increasing FLI quartile. For the CAP and the clinically routine CAP, all metabolic risk factors correlated positively with each increasing CAP quartile. These results were consistent with the ultrasound (US interpretation) results.
The increasing quartile for each FLI was associated with an increased likelihood of being in a higher MetS stage. In this analysis, the “outcome” was either Stage C only (with the reference category being a combination of Stage A and B) or a combination of Stage B and C (with the reference category being Stage A). A single-quartile increase in FLI (Q1 to Q2, Q2 to Q3, or Q3 to Q4) was determined using ordered logistical regression analysis, and showed there was about 3 times higher likelihood of being in a higher stage of MetS (Crude OR: 2.83, 95% CI: 2.09–3.84) (Table 3). After adjusting for covariates, the association between FLI and MetS stage persisted in Model 1 with an adjusted OR (AOR) of 3.1 (95% CI: 2.23–4.31) and Model 2 with an AOR of 3.1 (95% CI: 2.23–4.32) (Table 3). Similarly, there was a significant association between CAP and MetS stages. A single-quartile increase in CAP increased the likelihood of being in a higher stage of MetS by 1.86 times (crude OR: 1.86, 95% CI: 1.42–2.43), which also persisted after adjusting for covariates in Model 1 (AOR: 1.96; 95% CI: 1.49–2.59) and Model 2 (AOR: 1.96, 95% CI: 1.48–2.59).
In the sex-stratified analysis, higher FLI and CAP were also associated with higher MetS staging, which is consistent with the findings from the analysis of the overall population (Table 3). Even after controlling for covariates, the association of FLI and CAP with higher MetS remained significant.
THE MODEL PERFORMANCE OF FLI AND CAP ON DETERMINING METS STAGES:
An AU-ROC analysis was performed to assess the models’ performance. FLI had a higher AUC-ROC than CAP, despite having similar specificities (Figure 2). This indicates that FLI is more accurate in predicting MetS stages than CAP. The FLI in outcome 1 (mild-to-severe MetS versus non-MetS) had an AU-ROC of 0.79 (95% CI: 0.72–0.87), with high sensitivity (0.86) but low specificity (0.62). The FLI in outcome 2 (moderate-to-severe MetS versus mild-to-non-MetS) had a similar AU-ROC of 0.80 (95% CI: 0.71–0.87), with low sensitivity (0.62) but high specificity (0.87). The empirical cutoff points were 7.95 and 28.49, respectively. Despite the lower AU-ROC, CAP had a high specificity (0.84), with cutoff point of 305 when we screened our study population for the risky stages of MetS (stages C or D).
Discussion
In this cross-sectional study of Taiwanese adults, significant correlations were observed between MetS stages and CAP, and between MetS stages and FLI. These associations were independent of age, sex, and FIB-4 score. The findings suggest that both FLI and CAP are useful in MetS staging in Taiwanese adults. Moreover, we presented an empirical optimal cutoff point of FLI and CAP for MetS diagnosis.
As the prevalence of MetS increases, even among individuals with normal weight, there is an increasing need for early interventions [23,24]. Several MetS prediction tools have been developed for either immediate screening or predicting future risks, but tools to predict MetS staging are scarce [25]. Based on our current findings, the AU-ROC of CAP and FLI in predicting MetS stage is 0.66–0.80, implying that they can play a role in the early detection of MetS and alerting clinicians to intervene in such high-risk subjects.
FLI is known to be associated with hepatic-related mortality, and the association with all-cause, CVD, and cancer mortality rates is suspected to be dependent on insulin resistance [26]. Since insulin resistance is closely linked to MetS [27], it is likely that the significant correlation between FLI and MetS stages observed in our study is due to the underlying association of FLI and MetS with insulin resistance. A meta-analysis revealed that the correlation between CAP and histologically determined steatosis is strong [28], and CAP is correlated with MetS [11]. The results from CAP assessments were positively correlated with the number of MetS components and the prevalence of MetS in patients with chronic liver disease [10]. Furthermore, CAP values could be beneficial in monitoring the progression of MetS. These findings are consistent with CAP and MetS correlations in our study, where elevated TG, WC, and FPG were higher in participants in higher CAP quartiles. However, the correlation between CAP and MetS staging was weaker than the correlation between FLI and MetS staging in our present study. FLI contains WC and TG, which are MetS components, as well as BMI and GGT, which are independent risk factors for MetS. In addition, the MetS stage definition in our study included FLI (MetS Stage D: FLI ≥60). Consequently, the stronger correlation between FLI and MetS staging is not surprising.
CAP is better at distinguishing S0 from abnormal conditions (rather than staging steatosis) and enabling monitoring needs if the patient required further assessments [29]. CAP assessed fatty liver using FibroScan, but it is labor-intensive work that requires a well-trained physician. Therefore, its application in epidemiological studies may be limited. FLI is relatively cheap and is based on more traditional, widely available components, but FLI requires blood drawing while CAP does not.
Assessments of CAP and FLI have their pros and cons. In our study, consistent with Carvalhana’s study [30], CAP has more sensitivity and a higher correction than FLI. In NHANES analysis, the correlation coefficient of FLI and CAP was 0.645 [31]; it is not perfect, suggesting a potential difference between the 2 measures. The decision to choose either CAP or FLI should be made cautiously because of their unique consequences. The benefit of both procedures can be maximized by always keeping MetS in mind. FLI uses physical examination and blood assays. Similarly, the conventional procedures for the confirmation of MetS have depended on blood assays, which is an invasive and time-consuming procedure, which may cause subjects to resist these procedures during community screening. Meanwhile, the CAP score is noninvasive, safe, fast (approximately 5–10 min for application), convenient, portable, has high-reproducibility, and is highly accurate in the assessment of liver steatosis. CAP can be applied for subjects who were resistant to the inconvenience of overnight fasting or painful blood assays. Our results show CAP had a positive independent association with MetS stages in Taiwanese adults. If a high CAP value is detected during a FibroScan procedure, the gastroenterologist may be aware that, in the absence of blood test results, there is an increased likelihood that the patient is in a higher MetS stage.
As a result, we determined the good power based on the observation of ORs (in Table 3) and the AUC-ROC (in Figure 2). A sample size of 170 achieves 100% and 98% power, respectively, to detect an OR of 2.83 in FLI and 1.86 in CAP using a two-sided binomial test, alpha 0.05, and baseline proportion of 0.282. This estimate of power is based on the outcomes of MetS stages C and D vs A and B. The power of detecting AUC-ROC is also excellent. Using a 2-sided z-test with alpha 0.05, our data overall had 93% to 100% power to detect an AUC difference in FLI and CAP to MetS stages. Furthermore, utilizing a 2-sided binomial test with an alpha of 0.05 and MetS staging results of B–D vs A, our findings of FLI and CAP had low power in specificity but nearly 100% power to detect a change in sensitivity. Similar to this, 100% power can also identify specificity when the MetS staging result is C–D vs A–B, although the detection sensitivity is limited. It is important to know whether the target is rule-in or rule-out, depending on how early MetS stages may be recognized.
Overweight, metabolic disease, and fatty liver disease are interrelated and symptomatic of each other. Excessive weight may be the earliest symptom. According to the World Health Organization, the Asian ideal weight is given via a BMI of 18.5–22.9, which is the Asian-adjusted healthy BMI range, while a BMI over 23 is defined as overweight. In this study, we investigated the association between FLI, CAP, and MetS stages in a general population of Taiwan adults (Asian ethnicity). As shown in Table 1, the mean BMI was not significantly different between females and males (23.8 kg/m2 vs 24.8 kg/m2;
According to a previous study, Asian Americans with NAFLD had lower BMI and smaller waist circumference than non-Hispanic whites with NAFLD [32]. Another study showed that the factors significantly associated with elevated CAP were BMI (25–30) kg/m2, BMI >30 kg/m2, metabolic syndrome, alcohol >14 drinks/week, and liver stiffness >6 kPa [33]. Based on the above findings, we assume that our results are applicable to obese individuals.
There are some limitations in our study. First, the cross-sectional study design limits the interpretation of the results, as causation between FLI, CAP, and MetS could not be determined. However, from a pathophysiological standpoint, it is plausible that the fatty liver detected by FLI or CAP contributed to MetS. Second, there were differences in several key metabolic biomarkers between males and females. Therefore, a sex-specific cutoff may be required for FLI- and CAP-based MetS prediction. Further sex-specific analyses could modify model performance as expressed by AU-ROC. Lastly, our study participants were limited to 1 district in Taipei City, representing older adults in urban areas. Hence, the implications of the findings should be investigated for their appropriateness and applicability in other settings. Despite these limitations, our study has some strengths. Our participants were drawn from the community rather than a hospital-based population, making our findings applicable to a relatively healthy population. Furthermore, we utilized the MetS staging system to help us to identify patients with early MetS.
Conclusions
Our study demonstrated that both FLI and CAP had a positive independent association with MetS stages in Taiwanese adults, suggesting that assessing liver health using FLI or CAP could be beneficial for identifying individuals with metabolic abnormalities. Further prospective cohort studies with larger sample sizes are necessary to determine whether FLI and CAP can predict future MetS stages.
Figures
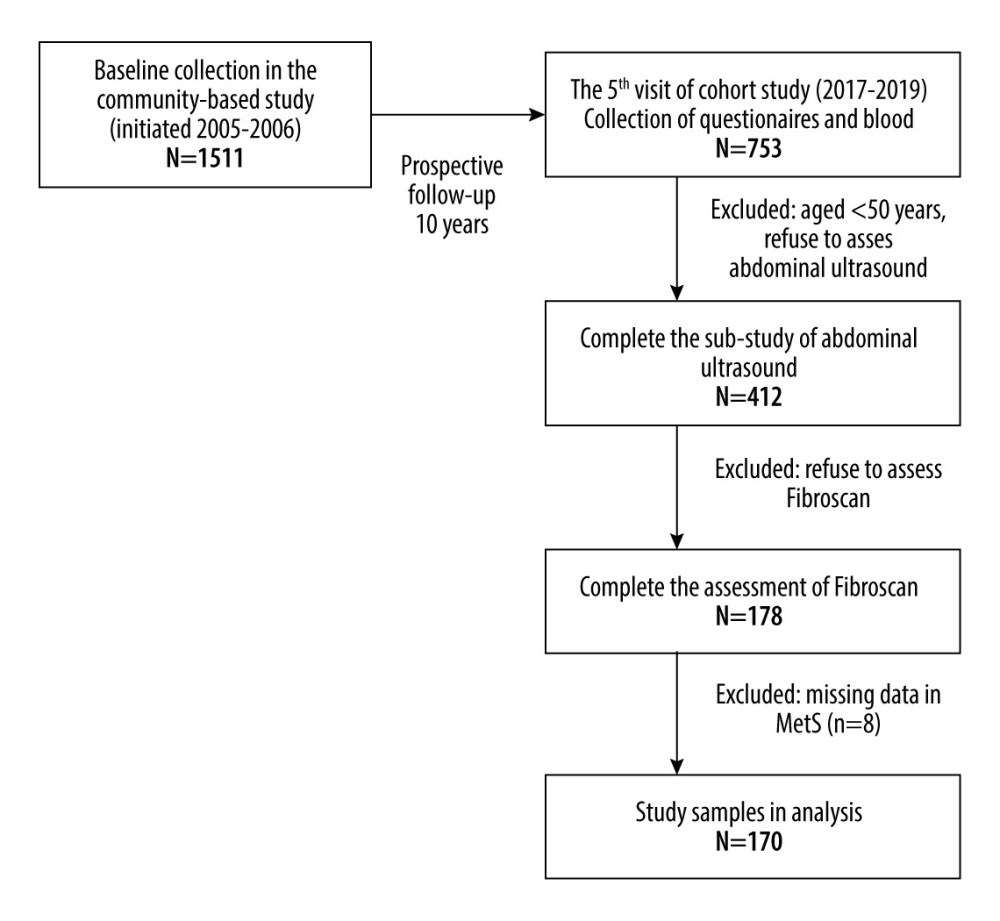 Figure 1. Flowchart of participants included in this study.
 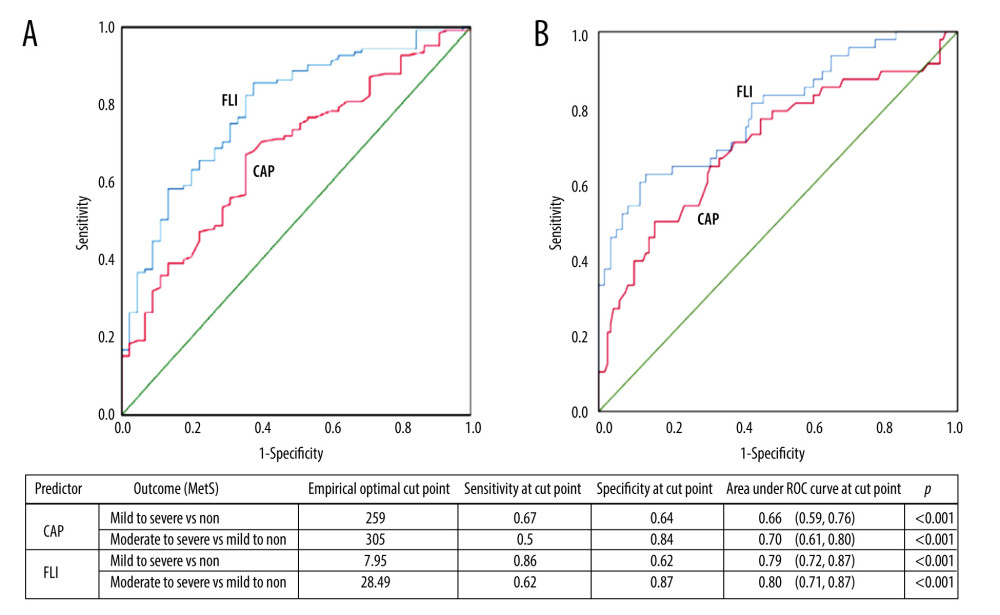 Figure 2. The area under the receiver operating characteristic curve (AU-ROC) of FLI and CAP in predicting the outcome (A) mild-to-severe MetS vs non-MetS and (B) moderate-to-severe MetS vs mild-to-non-MetS. MetS – metabolic syndrome; FLI – fatty liver index; CAP – controlled attenuation parameter.
 Tables
Table 1. Clinical and biochemical characteristics of the study subjects stratified by sex.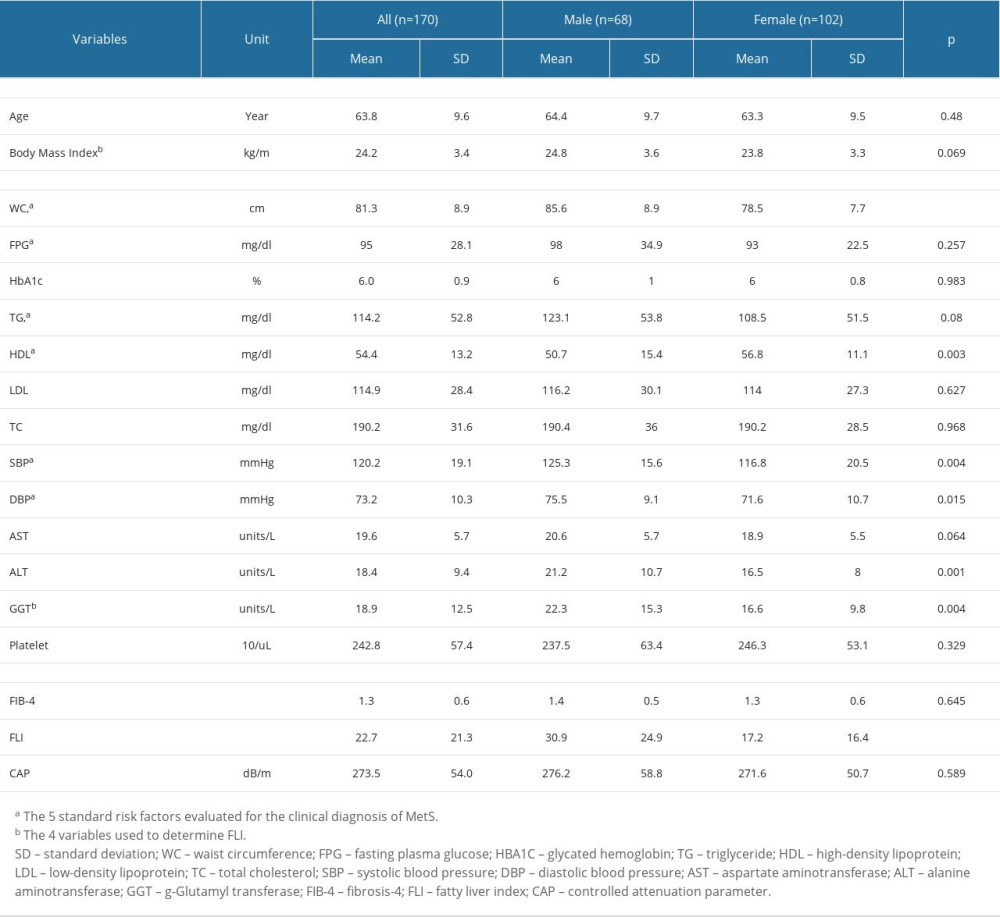 Table 2. Prevalence rates of metabolic syndrome components categorized, by FLI and CAP.
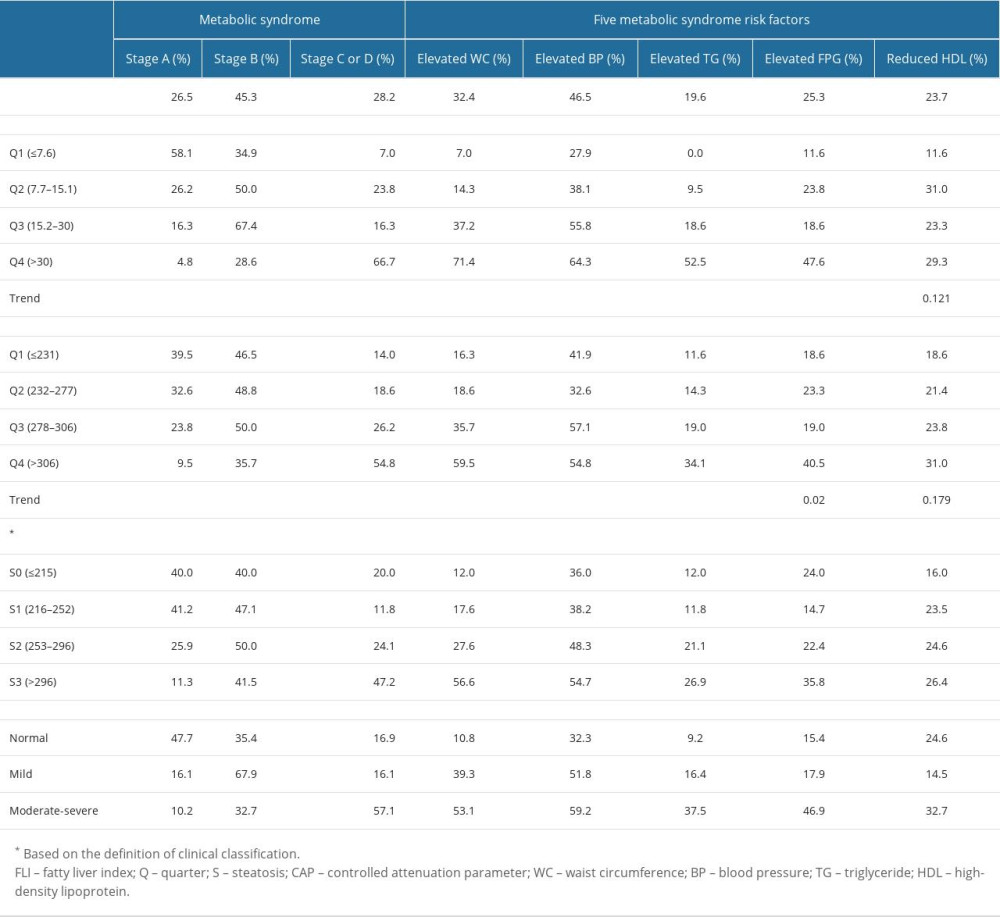 Table 3. The association of fatty liver index and controlled attenuation parameters with metabolic syndrome stage using ordered logistic regression.
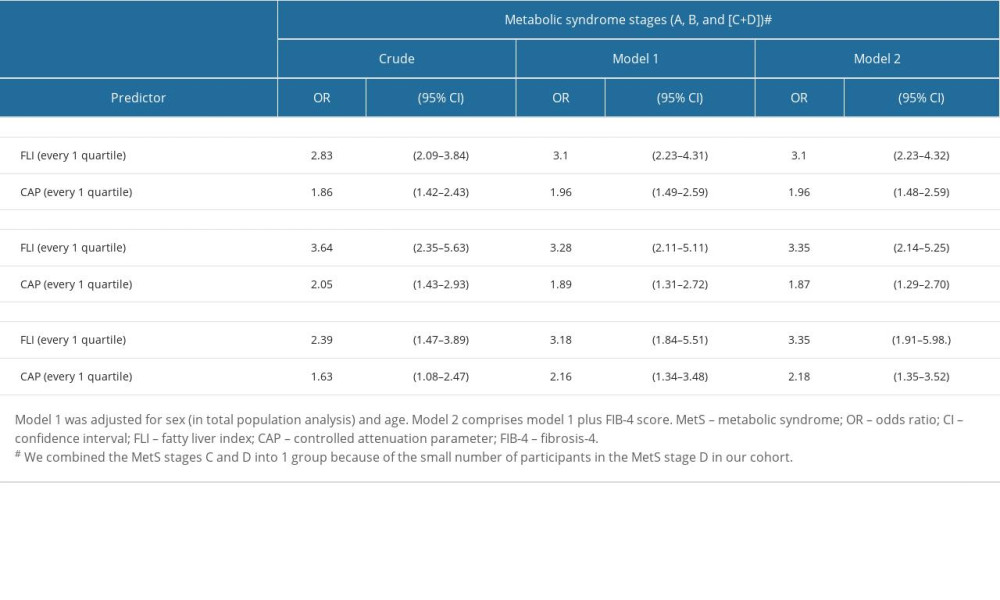
References
1. Alberti KG, Eckel RH, Grundy SM, Harmonizing the metabolic syndrome: a joint interim statement of the International Diabetes Federation Task Force on Epidemiology and Prevention. National Heart, Lung, and Blood Institute, American Heart Association, World Heart Federation. International Atherosclerosis Society, and International Association for the Study of Obesity: Circulation, 2009; 120; 1640-45
2. Sperling LS, Mechanick JI, Neeland IJ, The CardioMetabolic Health Alliance: Working toward a new care model for the metabolic Syndrome: J Am Coll Cardiol, 2015; 66; 1050-67
3. Vanni E, Bugianesi E, Kotronen A, De Minicis S, From the metabolic syndrome to NAFLD or vice versa?: Dig Liver Dis, 2010; 42; 320-30
4. Neuschwander-Tetri BA, Caldwell SH, Nonalcoholic steatohepatitis: Summary of an AASLD Single Topic Conference: Hepatology, 2003; 37; 1202-19
5. Khang AR, Lee HW, Yi D, The fatty liver index, a simple and useful predictor of metabolic syndrome: Analysis of the Korea National Health and Nutrition Examination Survey 2010–2011: Diabetes Metab Syndr Obes, 2019; 12; 181-90
6. Angulo P, Kleiner DE, Dam-Larsen S, Liver fibrosis, but no other histologic features, is associated with long-term outcomes of patients with nonalcoholic fatty liver disease: Gastroenterology, 2015; 149; 389-97e310
7. Bedogni G, Bellentani S, Miglioli L, The Fatty Liver Index: A simple and accurate predictor of hepatic steatosis in the general population: BMC Gastroenterol, 2006; 6; 33-35
8. Yen YH, Chen JF, Wu CK, The correlation of controlled attenuation parameter results with ultrasound-identified steatosis in real-world clinical practice: J Formos Med Assoc, 2017; 116; 852-61
9. Kim JH, Kwon SY, Lee SW, Lee CH, Validation of fatty liver index and lipid accumulation product for predicting fatty liver in Korean population: Liver Int, 2011; 31; 1600-601
10. de Ledinghen V, Vergniol J, Capdepont M, Controlled attenuation parameter (CAP) for the diagnosis of steatosis: A prospective study of 5323 examinations: J Hepatol, 2014; 60; 1026-31
11. Hu YY, Dong NL, Qu Q, The correlation between controlled attenuation parameter and metabolic syndrome and its components in middle-aged and elderly nonalcoholic fatty liver disease patients: Medicine (Baltimore), 2018; 97; e12931
12. Patel PJ, Hossain F, Horsfall LU, Controlled attenuation parameter in NAFLD identifies risk of suboptimal glycaemic and metabolic control: J Diabetes Complications, 2018; 32; 799-804
13. Lin YJ, Lin CH, Wang ST, Noninvasive and convenient screening of metabolic syndrome using the controlled attenuation parameter technology: An evaluation based on self-paid health examination participants: J Clin Med, 2019; 8; 1775
14. Hsieh YC, Hung CT, Lien LM, A significant decrease in blood pressure through a family-based nutrition health education programme among community residents in Taiwan: Public Health Nutr, 2009; 12; 570-77
15. Alizargar J, Bai CH, Factors associated with carotid Intima media thickness and carotid plaque score in community-dwelling and non-diabetic individuals: BMC Cardiovasc Disord, 2018; 18; 21-26
16. Sasso M, Beaugrand M, de Ledinghen V, Controlled attenuation parameter (CAP): A novel VCTE guided ultrasonic attenuation measurement for the evaluation of hepatic steatosis: Preliminary study and validation in a cohort of patients with chronic liver disease from various causes: Ultrasound Med Biol, 2010; 36; 1825-35
17. Sirli R, Sporea I, Controlled attenuation parameter for quantification of steatosis: which cut-offs to use?: Can J Gastroenterol Hepatol, 2021; 2021; 6662760
18. de Lédinghen V, Vergniol J, Foucher J, Non-invasive diagnosis of liver steatosis using controlled attenuation parameter (CAP) and transient elastography: Liver Int, 2012; 32; 911-18
19. Dasarathy S, Dasarathy J, Khiyami A, Validity of real time ultrasound in the diagnosis of hepatic steatosis: A prospective study: J Hepatol, 2009; 51; 1061-67
20. Sterling RK, Lissen E, Clumeck N, Development of a simple noninvasive index to predict significant fibrosis in patients with HIV/HCV coinfection: Hepatology, 2006; 43; 1317-25
21. Dyson JK, Anstee QM, McPherson S, Non-alcoholic fatty liver disease: A practical approach to diagnosis and staging: Frontline Gastroenterol, 2014; 5; 211-18
22. Long JSF: Regression models for categorical dependent variables using stata, 2014, Texas, Stata Press
23. Saklayen MG, The global epidemic of the metabolic syndrome: Curr Hypertens Rep, 2018; 20; 12
24. Bintoro BS, Fan YC, Chou CC, Metabolic unhealthiness increases the likelihood of having metabolic syndrome components in normoweight young adults: Int J Environ Res Public Health, 2019; 16; 3258
25. Zhang H, Shao J, Chen D, Reporting and methods in developing prognostic prediction models for metabolic syndrome: A systematic review and critical appraisal: Diabetes Metab Syndr Obes, 2020; 13; 4981-92
26. Calori G, Lattuada G, Ragogna F: Hepatology, 2011; 54; 145-52
27. Reaven GM, Banting lecture 1988. Role of insulin resistance in human disease: Diabetes, 1988; 37; 1595-607
28. Karlas T, Petroff D, Sasso M, Individual patient data meta-analysis of controlled attenuation parameter (CAP) technology for assessing steatosis: J Hepatol, 2017; 66; 1022-30
29. Pu K, Wang Y, Bai S, Diagnostic accuracy of controlled attenuation parameter (CAP) as a non-invasive test for steatosis in suspected non-alcoholic fatty liver disease: A systematic review and meta-analysis: BMC Gastroenterol, 2019; 19; 51
30. Carvalhana S, Leitão J, Alves AC, How good is controlled attenuation parameter and fatty liver index for assessing liver steatosis in general population: correlation with ultrasound: Liver Int, 2014; 34(6); e111-17
31. Sourianarayanane A, McCullough AJ, Accuracy of steatosis and fibrosis NAFLD scores in relation to vibration controlled transient elastography: An NHANES analysis: Clin Res Hepatol Gastroenterol, 2022; 46(7); 101997
32. Golabi P, Paik J, Hwang JP, Prevalence and outcomes of non-alcoholic fatty liver disease (NAFLD) among Asian American adults in the United States: Liver Int, 2019; 39(4); 748-57
33. de Ledinghen V, Vergniol J, Capdepont M, Controlled attenuation parameter (CAP) for the diagnosis of steatosis: A prospective study of 5323 examinations: J Hepatol, 2014; 60(5); 1026-31
Figures
Figure 1. Flowchart of participants included in this study.Figure 2. The area under the receiver operating characteristic curve (AU-ROC) of FLI and CAP in predicting the outcome (A) mild-to-severe MetS vs non-MetS and (B) moderate-to-severe MetS vs mild-to-non-MetS. MetS – metabolic syndrome; FLI – fatty liver index; CAP – controlled attenuation parameter. Tables
Table 1. Clinical and biochemical characteristics of the study subjects stratified by sex.Table 2. Prevalence rates of metabolic syndrome components categorized, by FLI and CAP.Table 3. The association of fatty liver index and controlled attenuation parameters with metabolic syndrome stage using ordered logistic regression.Table 1. Clinical and biochemical characteristics of the study subjects stratified by sex.Table 2. Prevalence rates of metabolic syndrome components categorized, by FLI and CAP.Table 3. The association of fatty liver index and controlled attenuation parameters with metabolic syndrome stage using ordered logistic regression. In Press
Clinical Research
Effects of Single-Bout Endurance Exercise Intensity on Peripheral Neurotrophic Factors in Patients With Isc...Med Sci Monit In Press; DOI: 10.12659/MSM.952089
Review article
Anisodus tanguticus in Cancer Research: A Review of Traditional Use, Phytochemistry, Extraction Methods, an...Med Sci Monit In Press; DOI: 10.12659/MSM.952999
Clinical Research
Nasal Mucociliary Clearance and Its Relationship With Disease Severity in Patients With Multiple SclerosisMed Sci Monit In Press; DOI: 10.12659/MSM.952850
Clinical Research
Modified Thoracoabdominal Nerves Block Through the Perichondrial Approach vs Subcostal Transversus Abdomini...Med Sci Monit In Press; DOI: 10.12659/MSM.953976
Most Viewed Current Articles
17 Jan 2024 : Review article 14,176,570
Vaccination Guidelines for Pregnant Women: Addressing COVID-19 and the Omicron VariantDOI :10.12659/MSM.942799
Med Sci Monit 2024; 30:e942799
13 Nov 2021 : Clinical Research 3,762,188
Acceptance of COVID-19 Vaccination and Its Associated Factors Among Cancer Patients Attending the Oncology ...DOI :10.12659/MSM.932788
Med Sci Monit 2021; 27:e932788
14 Dec 2022 : Clinical Research 2,466,310
Prevalence and Variability of Allergen-Specific Immunoglobulin E in Patients with Elevated Tryptase LevelsDOI :10.12659/MSM.937990
Med Sci Monit 2022; 28:e937990
16 May 2023 : Clinical Research 708,927
Electrophysiological Testing for an Auditory Processing Disorder and Reading Performance in 54 School Stude...DOI :10.12659/MSM.940387
Med Sci Monit 2023; 29:e940387