07 November 2023: Clinical Research
Navigating the Shifts: Retrospective Analysis of Alcohol Consumption and its Predictors Across Pre-Pandemic, Lockdown, and Post-Pandemic Eras in Poland
Daniel PankowskiDOI: 10.12659/MSM.940768
Med Sci Monit 2023; 29:e940768


Abstract
BACKGROUND: Alcohol consumption is a serious health risk that affects both physical and mental health. It is one of the major risk factors in the development of non-communicable diseases. The aim of this study was to perform a retrospective analysis of alcohol consumption patterns, determine of predictors of alcohol addiction, and attempt to distinguish and compare the profiles of participants differentiated in terms of their preferences in the pre-pandemic, lockdown, and post-pandemic periods.
MATERIAL AND METHODS: A retrospective study was conducted with a computer-assisted web interview on a representative sample of Polish citizens. Primary outcomes were sociodemographic and COVID-19-related variables, preferences regarding the type and location of consumed alcohol, reasons for drinking, severity of addiction symptoms, loneliness, quality of life, and health level.
RESULTS: During the lockdown period, the percentage of people declaring abstinence increased, as well as people who, according to the Alcohol Use Disorders Identification Test (AUDIT) cut-off points, could be diagnosed with probable alcohol dependence. The strongest predictors of the severity of addiction symptoms were preferences regarding the type and place of alcohol consumption, with a high percentage of explained variance (>50%). The analysis of profiles differentiated in terms of the preferred type of alcohol consumed allowed for the identification of 7 different profiles, which differed in terms of AUDIT score, loneliness, quality of life, and level of health.
CONCLUSIONS: Patterns of alcohol consumption changed during the pandemic. Alcohol-related preferences are important from the public health perspective.
Keywords: Alcohol Drinking, Loneliness, Quality of Life, Humans, Poland, Alcoholism, Pandemics, Retrospective Studies, Ethanol, Risk Factors
Background
The COVID-19 pandemic, especially its initial stage, greatly affected individuals and societies [1]. It had numerous consequences in the field of economics [2], education [3], medicine [4], and public health [5]. A number of analyses have shown that it also had an impact on mental health, leading to an increase in symptoms of depression [6], anxiety [7], and post-traumatic stress disorder [8]. The COVID-19 pandemic also reduced quality of life. Research conducted on groups of people in quarantine showed that this phenomenon is particularly noticeable among women, followed by the elderly population [9,10]. For the vast majority of people, for example in Europe, the pandemic stressor was a never-before-seen public health risk.
As indicated earlier, the COVID-19 pandemic and its accompanying difficulties, such as financial uncertainty, fear of getting sick, and many others, were strong stressors for a large part of society [11]. One of the maladaptive ways of coping with stress is the consumption of psychoactive substances, including alcohol [12]. However, research shows that the relationship between stressful events and alcohol consumption is more complex and also depends, among others variables, on affect [13]. Despite the fact that numerous studies confirm the negative effects of alcohol on physical [14] and mental health [15], this substance is still very popular. It accompanies many social situations and is characterized by a fairly high level of social acceptance [16].
Lockdown during the COVID-19 pandemic induced social stress and introduced isolation, which led to an increased sense of loneliness. This, in turn, could have also contributed to increased alcohol consumption [17]. Studies conducted before the pandemic indicate that loneliness has an effect on alcohol consumption and health, with an individual’s sex being a factor playing a significant role: female participants experiencing loneliness were 2.9 times more likely drink than their male peers [18]. Some studies conducted during the lockdown show that lack of social contacts and loneliness were some of the main reasons for consuming more of the various substances during lockdown [19]. These results are further supported by diary studies of daily alcohol consumption [20]. Moreover, alcohol is also used in social situations to, for instance, reduce shyness or social anxiety, especially in people with phobias [21]. These situations could have been reduced by minimizing the number of interactions with other people, somehow following the self-healing hypothesis.
Studies of representative samples conducted in different countries also suggest different patterns of alcohol consumption depending on the country. Barbossa et al [22] in a study conducted in the United States, noted that after the introduction of the lockdown, alcohol consumption increased in the group of participants by 29%. In turn, studies conducted in Australia indicate that lockdown reduced harmful alcohol consumption in younger drinkers [23]. Research conducted in the Czech Republic, in turn, indicates that despite the lack of changes in alcohol use disorders between the data collected in 2020 and 2017, a significant increase in weekly binge drinking behaviors was observed [24]. In Poland, depending on the study sample and methodology, the data indicate both a general decrease in the consumption of alcoholic beverages, with a simultaneous increase in specific subgroups [25], as well as the general increase in consumption [26]. However, during the preparation of this article, we were unable to find data from studies conducted on a representative Polish sample. Data from a meta-analysis by Acuff et al [27] indicate that total alcohol consumption did not change, while 23% of participants of analyzed studies reported increases in consumption, and 23% reported a decrease. In such a situation, the collective analysis of all participants can be misleading. This is also because the reasons for drinking alcohol can vary between participants. Moreover, the availability of preferred beverages and places can also change over time. It can seem that the analysis using a person-centered perspective is a better solution, which may allow for the distinguishing between specific profiles differentiated in terms of preferences and the comparing of alcohol consumption between them. In addition, from a clinical point of view, it is important to determine predictors of alcohol consumption and changes in their range. This is crucial from the perspective of public health and the preparation of specific interventions and identification of groups that can be at particular risk of this problem.
In Poland, on July 1, 2023, the state of epidemiological emergency was lifted. According to the results of our research, changes in consumption and preferences of alcoholic beverages may have occurred during the pandemic. Therefore, we decided to conduct a study on a representative sample of Polish citizens, in which the questions referred to 3 periods: before the pandemic (before March 2020: T1), during the lockdown, resulting from the introduction of restrictions (T2), and the present, when the pandemic is “officially” declared over (T3). Therefore, we decided to conduct a study and perform analyses aimed at:
Material and Methods
ETHICS STATEMENT:
The study was approved by the Ethics Committee of the University of Economics and Human Sciences in Warsaw.
PROCEDURE:
Before the actual study, a pilot study was conducted to determine the degree to which the participants were able to reliably recall the answers to the questionnaires included in the methodology. First, apart from the tools included in the study (see the Materials section), it was also planned to include additional short questionnaires that were to be used to assess the quality of life and level of general health. However, in the pilot study, the participants indicated that they were unable to reliably answer the questions contained in the above-mentioned questionnaires because they did not remember the period from a few years ago precisely enough. Therefore, it was decided to use single general questions to assess the above variables, and the participants in the pilot study declared they were able to answer these questions without any problems. Informed consent was obtained from all participants upon enrollment. The survey was conducted online with the help of computer assisted web interviews by a panel research company, which has a panel of approximately 300 000 members from which it selects a representative sample based on the structure of the population based on data provided by NetTrack, Social Diagnosis, and Central Statistical Office. The data collected from the participants were sent to the researchers in an anonymized form, from which it was not possible to determine their personal data. The data were collected from a representative sample of Polish citizens according to the distribution of sex, age, and city size class (n=1040). The inclusion criteria for the study, in addition to informed consent, was age of over 21 years (18 years of age prior to the onset of the COVID-19 pandemic). The study included people who had no clear contraindications to alcohol consumption in the last 2 years, namely, were not pregnant, did not breastfeed, and did not undergo surgery. The data were collected August 12 to 19, 2022. There were no missing data.
SOCIODEMOGRAPHIC VARIABLES:
The following information was given by the participants: (a) sex; (b) age; (c) level of education; (d) relationship status; (e) whether they had children; and (f) model of work in the pre-pandemic period, during the lockdown, and post-pandemic period (ie, after the lifting of the state of epidemiological threat).
PANDEMIC-RELATED VARIABLES:
Participants were asked to subjectively assess with “yes/no” if (a) they had been diagnosed with the coronavirus infection; (b) their loved one had a serious illness; (c) their financial situation drastically deteriorated; (d) they had much more free time; (e) their health deteriorated; (f) their family relations deteriorated; (g) they lost contact with relatives; and (h) they experienced the death of a loved one.
ALCOHOL PREFERENCES:
Participants were asked how often in the pre-pandemic period, during the lockdown, and in the post-pandemic period they had consumed the following types of alcohol: (a) beer/cider; (b) wine/champagne; (c) vodka; and (d) whiskey/cognac. Answers were given on a 5-point Likert scale (never/rarely/sometimes/often/very often).
PLACE OF ALCOHOL CONSUMPTION:
Participants were asked how often they consumed alcohol in the pre-pandemic period, during lockdown, and in the post-pandemic period in specific places: (a) bar/pub; (b) parties at friends’; (c) corporate events; (d) private parties; (e) with a partner/other family members (eg, until lunch/dinner); (f) alone, for example, watching TV; (g) in a club/disco; and (h) outdoors (eg, by a lake). Answers were given on a 5-point Likert scale (never/rarely/sometimes/often/very often).
REASONS FOR ALCOHOL CONSUMPTION:
The participants were also asked to indicate the reasons for consuming alcohol among the following: (a) for company; (b) for relaxation or improved mood; (c) for increasing boldness/self-confidence; (d) to fall asleep/sleep better; (f) because of problems; (g) for taste; and (h) because of boredom. The participants answered yes or no for the 3 periods: before the pandemic (T1), during the lockdown (T2), and after the pandemic (T3).
LONELINESS: The participants assessed their level of loneliness in the 3 periods: (a) before the pandemic (T1; α=0.912); (b) during lockdown (T2; α=0.928); and (c) after the pandemic (T3; α=0.946) by completing the Short Loneliness Scale, consisting of 3 questions [28].
SEVERITY OF SYMPTOMS OF ALCOHOL DEPENDENCE: This variable was assessed using the Alcohol Use Disorders Identification Test (AUDIT) [29,30], which consists of 10 questions. The participants answered in relation to the period before the pandemic (T1; α=0.857), during lockdown (T2; α=0.862), and after the pandemic (T3; α=0.870). The analyses also adopted cut-off points in line with the Polish interpretation of the results [25]: (a) low-risk drinking: 0–7 points; (b) risky alcohol consumption: 8–15 points; (c) harmful drinking of alcohol: 16–19 points; and (d) suspicion of alcohol addiction: 20 or more points.
SUBJECTIVE ASSESSMENT OF ONE’S OWN HEALTH:
The participants were asked to assess their health in comparison to that of other people of the same age and sex in the 3 periods: before the pandemic, during lockdown, and after the pandemic. The answers were given on a 7-point Likert scale (definitely worse/worse/slightly worse/the same/slightly better/better/definitely better).
QUALITY OF LIFE:
The participants were asked to assess their quality of life in the 3 periods: before the pandemic, during lockdown, and after the pandemic. The answers were given on a 7-point Likert scale (very bad/bad/rather bad/average/rather good/good/very good).
DATA ANALYSIS:
We examined the distribution of variables through skewness and kurtosis statistics, where: ±1=very good; ±2=acceptable; skewness >2; and kurtosis >7 = concern. Descriptive statistics of the analyzed variables are presented as frequencies, means, and standard deviations. The McNemar test was used to compare the number of abstainers and groups distinguished by the cut-off points of the AUDIT test between the 3 analyzed periods.
The calculations in the second step included selected dependent variables for which specific contributions were assessed (total AUDIT, as well as the differences between values of T2-T1; T3-T2; and T3-T1), while all independent variables were placed in the first step and the stepwise method was set. In stepwise regression analysis, only statistically significant predictors were included in the resulting model. Additionally, the use of this calculation method allowed for the elimination of the problem of collinearity: successively entered predictors also considered the mutual correlation between them. We decided to use the stepwise method owing to the large number of predictors; however, one should be careful when interpreting the calculation results, owing to limitations consisting of, among others, underestimating the standard errors of the coefficient estimates (see also the Limitations section).
Latent profile analysis (LPA) of the subjectively reported frequency of consumption of selected alcohols was performed with standardized data. Based on earlier exploratory analysis using hierarchical cluster analysis and k-means (data not shown), it was assumed that it would be possible to distinguish 5 to 6 classes. However, the analyses produced solutions ranging from 1 to 8 classes. An analytic hierarchy process, based on the fit indices AIC, AWE, BIC, CLC, and KIC [31], was adopted as the matching criterion. Calculations were made in RStudio using the tidyLPA module [32]. Unlike traditional variable-centered methods, LPA allows for the identification of hidden subpopulations that are differentiated in terms of the level of variables introduced into the model. This method focuses on determining the probability of belonging to a given profile (subpopulation) estimated directly from the model.
Next, differences between loneliness levels, subjective health, quality of life, total AUDIT score, and differences between successive periods in terms of these variables were assessed. Due to the lack of homogeneity of variances, ANOVA with Welch statistics was performed. The significance of the difference between the groups was calculated using Dunnett’s T3 test.
Power analysis was calculated after data collection using GPower 3.1 software for the linear multiple regression [33]. For a medium effect, multiple regression analyses with 16 predictors achieved a power of 1. Reliability was assessed using Cronbach’s alpha. Data analysis was conducted using R and SPSS version 25 for Windows.
Results
PARTICIPANTS:
A total of 1040 participants participated the study. The sample consisted of 498 men and 542 women, aged 21 to 78 years. Most participants had secondary education (45.2%) or higher (39.7%). Almost half of the participants were married (44.9%), and less than one-third of the participants were single (30.2%). Detailed descriptive statistics are presented in Table 1.
Next, the frequencies of negative alcohol consumption patterns were calculated according to the cut-off points of the AUDIT test and the number of abstainers. The number of people who declared that they did not consume alcohol (AUDIT item 1) was as follows: in the period before the pandemic: n=170; during the lockdown: n=232; and after the pandemic: n=192. The comparison of these values indicated that the number of abstainers statistically changed in analyzed periods (Q=42.767;
According to AUDIT item 1, the proportion of people who drank more during the lockdown compared with the pre-pandemic period was 13%, and the proportion of those who drank less frequently was 19.2%. Similarly, 19% of participants drank more often in the post-pandemic period than in the lockdown period, and 13.3% drank less often. Data also indicate that 11.6% respondents drink more often in the post-pandemic period than in the pre-pandemic period.
In turn, the analysis of item 2 of the AUDIT test showed that 10.7% of people drank less and 15.5% drank more in the lockdown period than in the period before the pandemic. Further analysis showed that 12.1% of participants drank more and 14.9% drank less in post-pandemic period than during lockdown. In turn, 11.4% of participants drank less, and 11.6% drank more in the post-pandemic period than before the pandemic.
The next step was to determine the number of people with a specific pattern of alcohol consumption, according to Polish cut-off scores (see: Methods section; [30]). There were no statistically significant differences in the number of people classified as low risk between all 3 analyzed periods. An increase in the number of people drinking harmfully during the lockdown period (P=0.027) was noted; however, the comparison of people drinking harmfully before the pandemic (T1) and after the pandemic (T3) turned out to be statistically insignificant (P=0.109). The increase in the number of addicts according to the AUDIT criteria between before the pandemic (T1) and during the lockdown (T2) was on the border of statistical significance (P=0.053), and the difference between the period before the pandemic (T1) and after the pandemic (T3) was statistically significant (P=0.029). The exact values are presented in Table 2.
PREDICTORS OF THE SEVERITY OF SYMPTOMS OF ALCOHOL DEPENDENCE:
Subsequently, predictors of the severity of symptoms of alcohol addiction in the 3 analyzed periods were determined. Multivariate stepwise regression analysis was performed, and its results are presented in Table 3.
The analyzed models are characterized by a high percentage of explained variance, ranging from approximately 51% (pre-pandemic period) to over 57% (lockdown). In all cases, the strongest predictor of the severity of alcohol addiction symptoms was the preference for vodka consumption (β in the range from 0.225 for the lockdown period to 0.277 in the period after the pandemic) and alcohol consumption alone (β in the range from 0.132 for the pre-pandemic period to 0.157 in the post-pandemic period). In all models, the protective factors were female sex and alcohol consumption for taste.
PREDICTORS OF CHANGES IN THE SEVERITY OF SYMPTOMS OF ALCOHOL DEPENDENCE:
The next step was to determine the predictors of changes in the severity of alcohol addiction symptoms (Table 4).
In the analyzed models, it was possible to explain the relatively low percentage of variance. The difference in variance between the lockdown and the pre-pandemic period was about 3%, and the difference between the timeframe in the post-pandemic period and lockdown was about 7%.
Many of the predictors in the analyzed models were protective. There was a large difference between the factors responsible for changes in the severity and symptoms of alcohol addiction. In the differences between the lockdown period and the pre-pandemic period, the strongest protective factor was the pre-lockdown preference for wine/champagne (β=−0.124), and the strongest positive predictor was preferred consumption with a partner/other family members (pre-pandemic; β=0.119). In turn, in the difference between the post-pandemic period and the lockdown period, the strongest protective factor was the preference for beer/cider (β=−0.176). In people who drank beer/cider more often during the lockdown period, the decrease in the intensity of addiction symptoms was the greatest. Alcohol consumption in disco clubs during the lockdown was also found to be a factor associated with increased consumption (β=−0.088). It should also be noted that being unemployed was associated with a lower severity of addiction symptoms in both differences between the lockdown and pre-pandemic periods, as well as differences between the post-pandemic and lockdown periods, which may be directly related to economic status. We noted differences between the post-pandemic period and before the pandemic in certain respondents. For people currently working remotely (β=0.107) and preferring whiskey/cognac during lockdown (β=0.118), there was an increase in the severity of addiction symptoms.
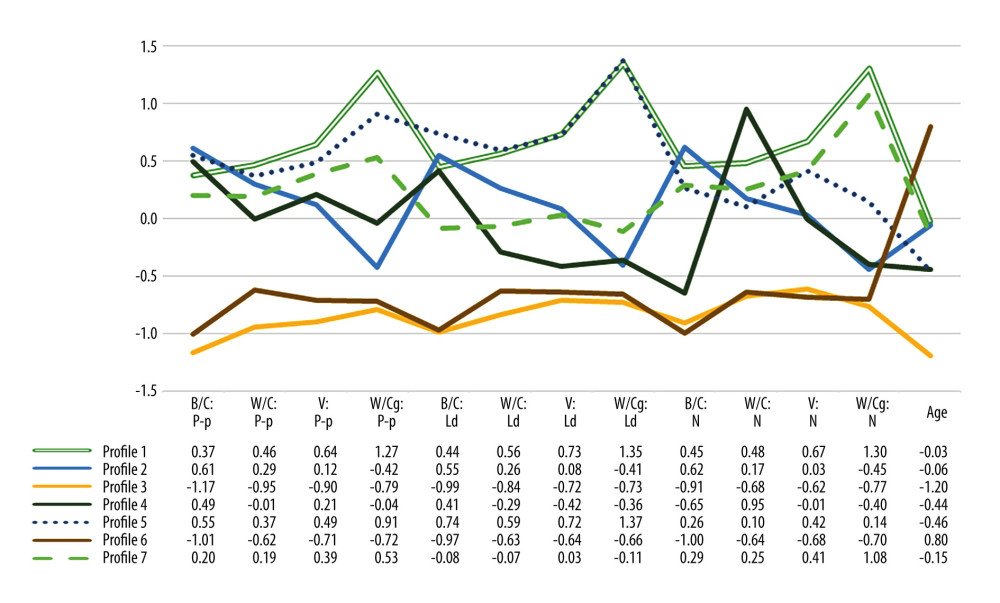
PATTERNS CONCERNING THE PREFERENCES FOR THE CONSUMPTION OF SELECTED TYPES OF ALCOHOL BY LPA:
Model 3 was used (equal variances and covariances). According to the guidelines of Akogul and Erisoglu [31], the best suited solution was the one distinguishing 7 classes (profiles). A graph of the average frequency of spirit consumption along with age profiles is presented in Figure 1.
A total of 7 profiles were identified in the LPA:
The next step was to compare the selected profiles in terms of the level of health, quality of life, loneliness, and severity of addiction symptoms. Also, the differences between them in the 3 analyzed periods were considered. Calculations were made using ANOVA, with Welch statistics. Subsequent profiles were compared with Dunnett’s T3 test. The results are presented in Table 5.
Further analysis showed that in the case of loneliness, profile 6 participants had a statistically significantly lower level than participants from profiles 2, 3, and 4 in the pre-pandemic period. However, during the lockdown period, profile 6 participants had statistically significant lower levels than profiles 1, 2, 3, 5, and 7. The declared level of loneliness in profile 6 after the pandemic was also statistically significantly lower than in profiles 1, 2, 3, and 5, while profile 3 participants were statistically significantly higher than profiles 1 and 2. The increase in the level of loneliness between the periods before the pandemic and lockdown was higher in profile 7 than in profile 6. When comparing the change in the level of loneliness between after pandemic and lockdown periods, profile 3 participants had a statistically significantly lower decrease than did participants in profile 7.
In the case of health, in the post-pandemic period, the only statistically significant difference concerned profiles 5 and 6. Statistically significant differences concerning changes in declared level of health between the pre-pandemic period and lockdown were observed only between profiles 1 and 7; participants from profile 7 declared a greater deterioration than did participants from profile 1.
The quality of life in the pre-pandemic period in profile 7 participants was statistically significantly higher than in profile 6 participants. The decline in quality of life between the pre-pandemic and lockdown periods in profile 7 participants was statistically significantly greater than in profiles 1 and 6. A comparison of the differences in the quality of life between the period before the pandemic and after the pandemic showed that there is a statistically significant difference between profile 4, in which there was an increase, and profile 7, in which there was a decrease.
The results of the AUDIT test before the pandemic of participants from profile 1 were statistically significantly higher than those of profiles 2, 3 and 6, and those from profile 2 were lower than those of profile 5 participants. The overall AUDIT result was also statistically significantly lower in profiles 3 and 6 than in the other profiles. In the case of the lockdown period, profile 5 participants had a statistically significantly higher score than all other groups. In turn, profile 3 and 6 participants had statistically significantly lower AUDIT scores than all other groups. Additionally, profile 1 participants had a statistically significantly higher AUDIT result than those from profile 2. Regarding the post-pandemic period, profile 3 and 6 participants had a statistically significantly lower result than those from profiles 1, 2, 5, and 7. Additionally, profile 5 participants had a higher score than did profile 2 participants. Moreover, profile 2 participants had a statistically significantly lower score than those from profiles 1 and 7. Between the lockdown period and pre-pandemic period, there was a statistically significant increase in the AUDIT score for profile 5 participants (greater than in other groups 2, 6, 7). In the case of the difference in the overall AUDIT score between the post-pandemic period and pre-pandemic period, we observed that profile 3 participants had a statistically significantly higher decrease than did profile 2 and 6 participants. Additionally, profile 7 participants had a statistically significantly greater increase in the AUDIT score than did those from profile 2. In the case of a difference between the post-pandemic period and the lockdown period, it was observed that profile 5 participants had a statistically significantly greater decrease in the overall AUDIT score than did those in profiles 1, 2, 3, 6, and 7. However, profile 7 participants had statistically significant a greater increase than did those from profiles 2, 5, and 6.
Discussion
STUDY LIMITATIONS:
The most important limitation of the study is the retrospective nature of the collected data. Unfortunately, it was not possible to conduct diary studies in the analyzed time intervals, which would better show the changes that took place at that time. In the case of this type of research, it would also be problematic to collect a representative sample or obtain data from the period before the pandemic. Also, the subjective assessment of the frequency of consumption may be a limitation. Nonetheless, our goal was to determine the preferences and their changes in the analyzed periods, which is why this method was selected for the study. Another limitation may be the use of single questions to assess the level of health and quality of life of the participants. In this situation, we decided to take such a step to not overload the participants with the number of questions and owing to the problem declared by people participating in the pilot study with the answers to the questions contained in the questionnaires in relation to the periods before the pandemic and during the lockdown. Otherwise, a respondent would have to repeat a questionnaire 3 times for them to be able to refer to all analyzed periods. It should also be noted that stepwise regression analysis, despite its very wide use in scientific data, is also a method that can lead to overfitting. More information on this subject can be found in the work by Smith [38]. In conclusion, the results should be interpreted with great caution: the retrospective nature of the collected data may have influenced the results, especially since they were based on the memory of events from a few years ago. It is also worth remembering that health status and quality of life were analyzed using single, general questions, and therefore the results may not necessarily be consistent with the results obtained using validated tools. The predictors described in the study should also be verified in further analyses based, for example, on longitudinal or experimental studies.
Future analyses should start with replication, which would confirm the maintained results. Despite the limitations associated with retrospective studies, it is currently impossible to investigate a different formula that would allow for a more thorough analysis of this issue (such as a longitudinal study). As indicated earlier, both high inflation and other social factors, related to, among others, the war in Ukraine, may affect alcohol consumption in Poland. Therefore, future studies may include variables related to these issues, such as the severity of symptoms of post-traumatic stress disorder. Concerning COVID-19, in future studies, it is also worth taking a closer look at the psychosocial variables associated with COVID-19, such as fear of COVID [39], adherence to recommendations, or beliefs related to COVID-19 that could more fully explain changes in alcohol consumption between the analyzed periods.
Conclusions
This research examined the nuanced patterns of alcohol consumption in Poland during the COVID-19 pandemic. Notably, we observed an increase in the number of abstainers during the lockdown period, which, despite a decrease after the pandemic, was still higher than before the pandemic. The number of people potentially addicted to alcohol has increased since the pre-pandemic period. We also found the severity of alcohol addiction symptoms was significantly associated with certain alcohol types, suggesting the pivotal roles of economic factors and accessibility in shaping consumption patterns.
Additionally, we differentiated 7 distinct profiles based on participants’ alcohol preferences, which showed varied levels of loneliness, subjective health assessments, and quality of life. Despite the limitations of retrospective data and subjective self-assessments, these insights underscore the importance of targeted interventions for different subgroups and highlight the necessity of ongoing research to understand the impacts of global events on substance use patterns.
Tables
Table 1. Participants’ demographic characteristics.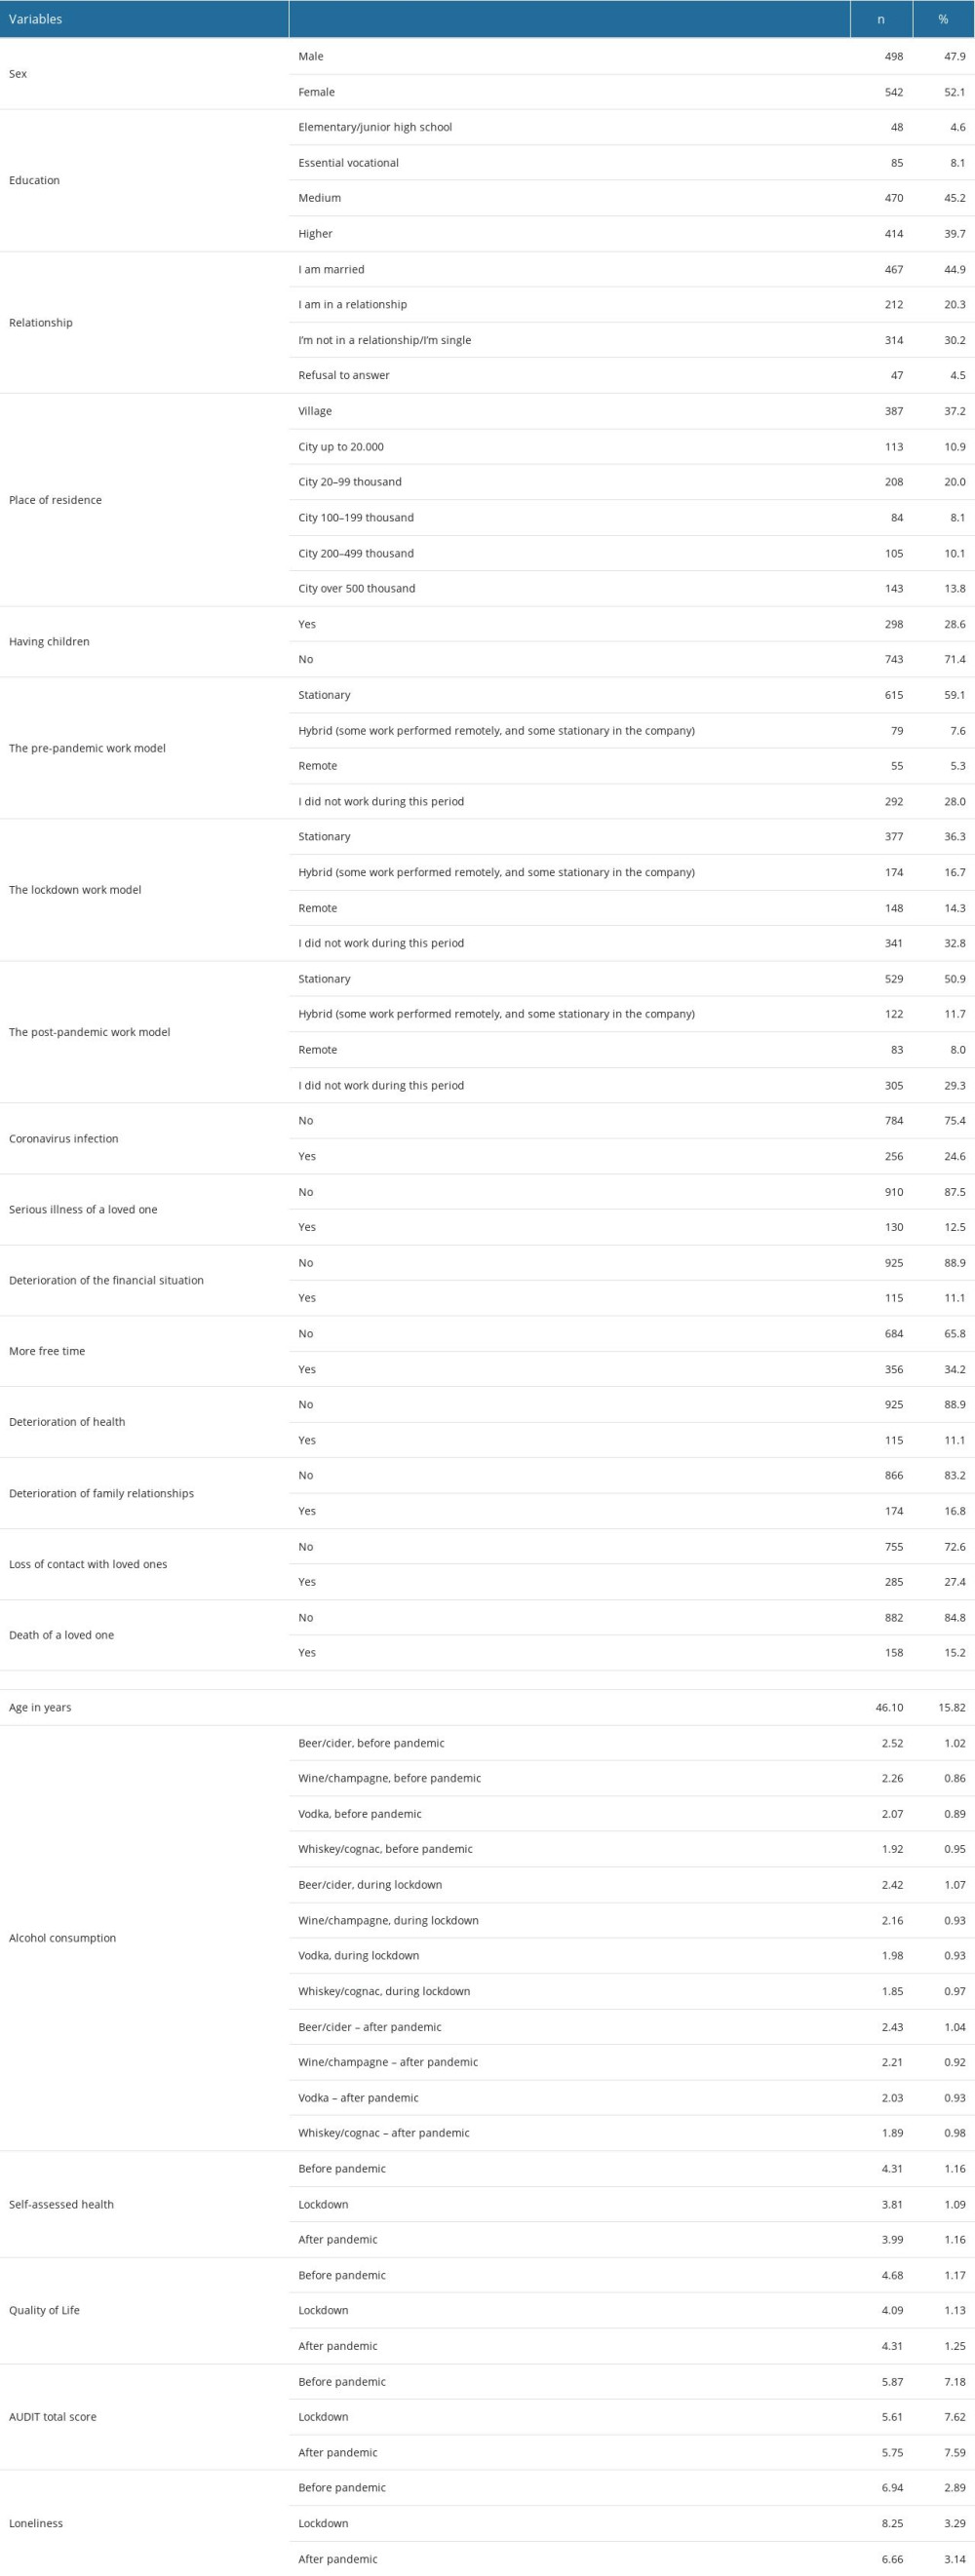 Table 2. Distribution of the number of specific risk groups for alcohol dependence according to the Polish Alcohol Use Disorders Identification Test (AUDIT) cut-off points.
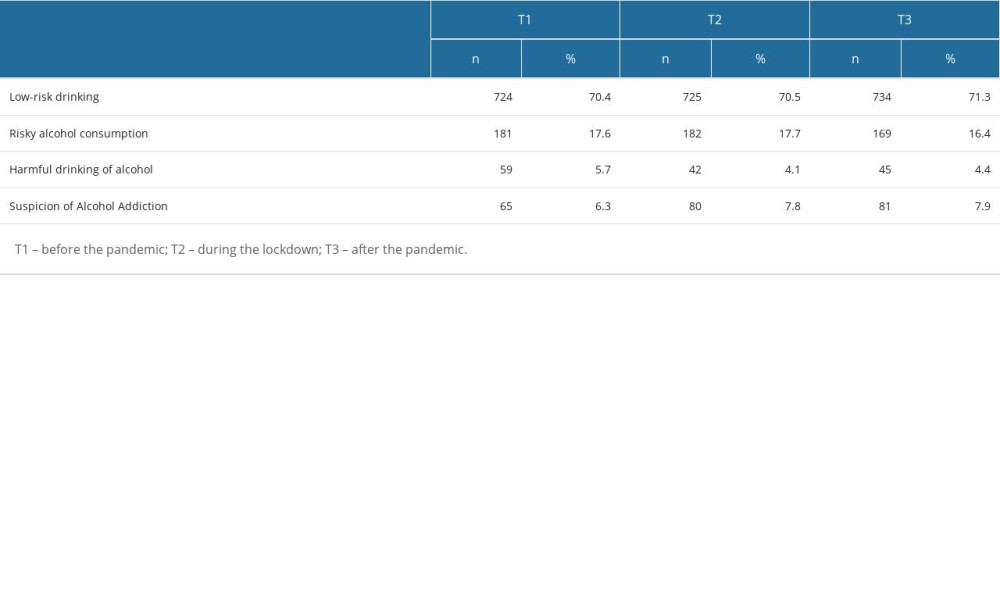 Table 3. Predictors of the severity of symptoms of alcohol dependence in pre-pandemic, lockdown, and post-pandemic periods.
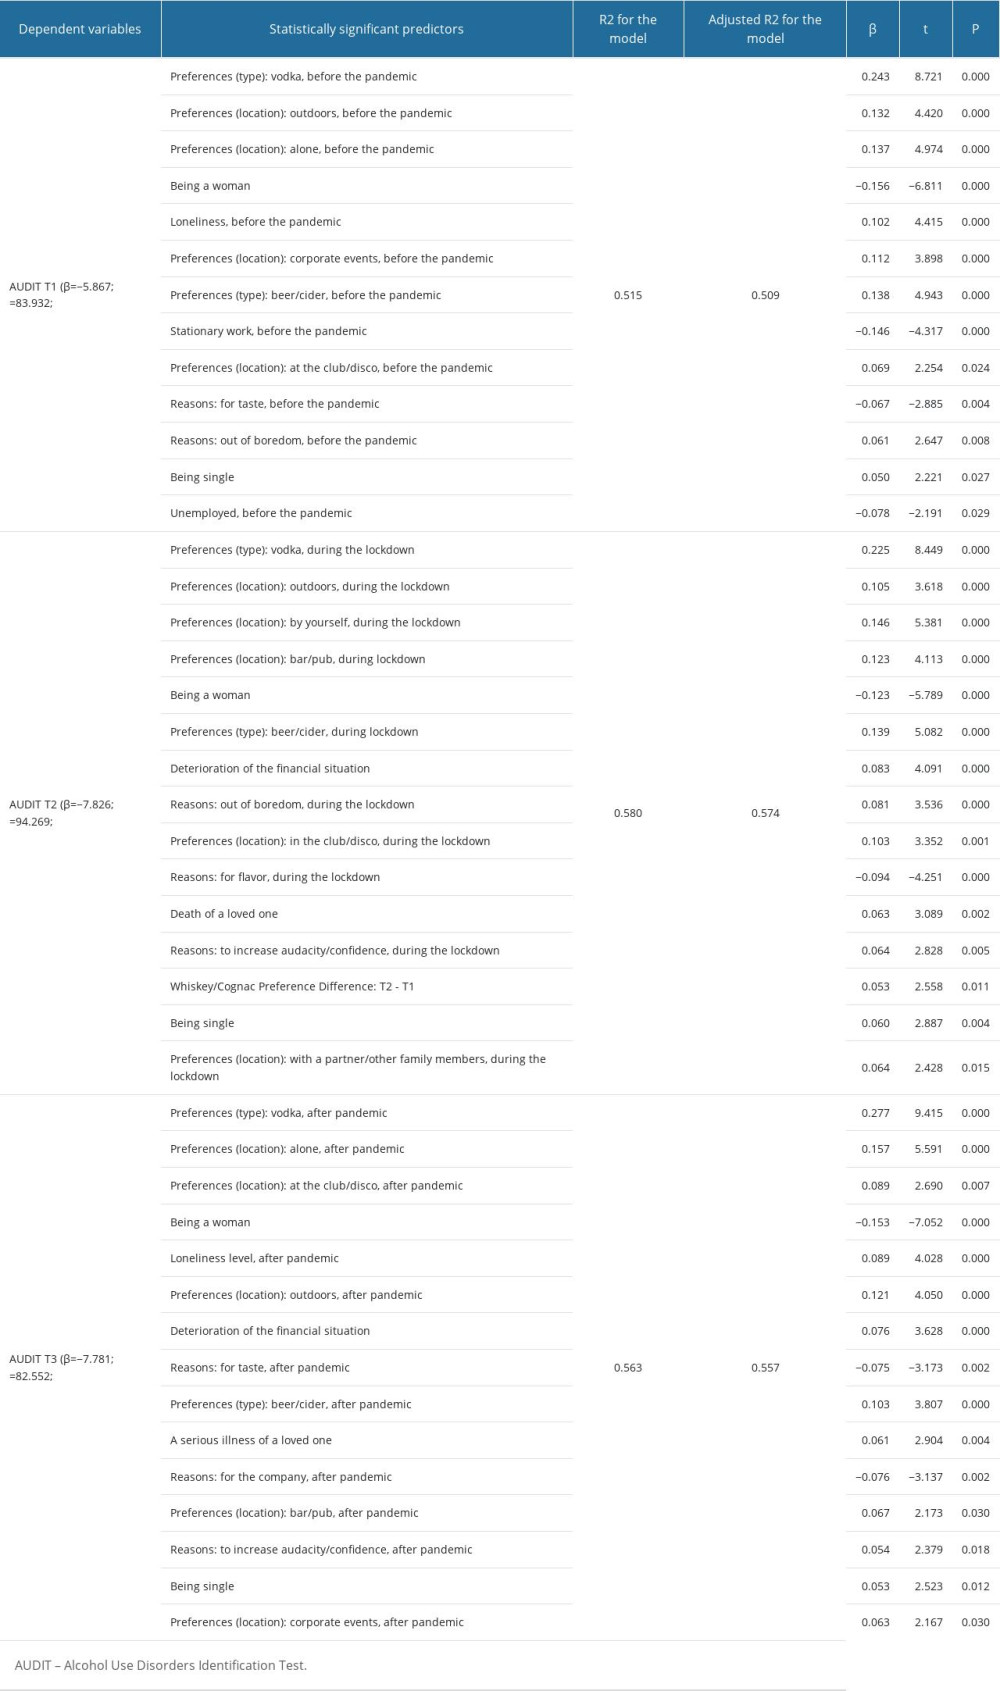 Table 4. Predictors of changes in the severity of alcoholism dependence symptoms.
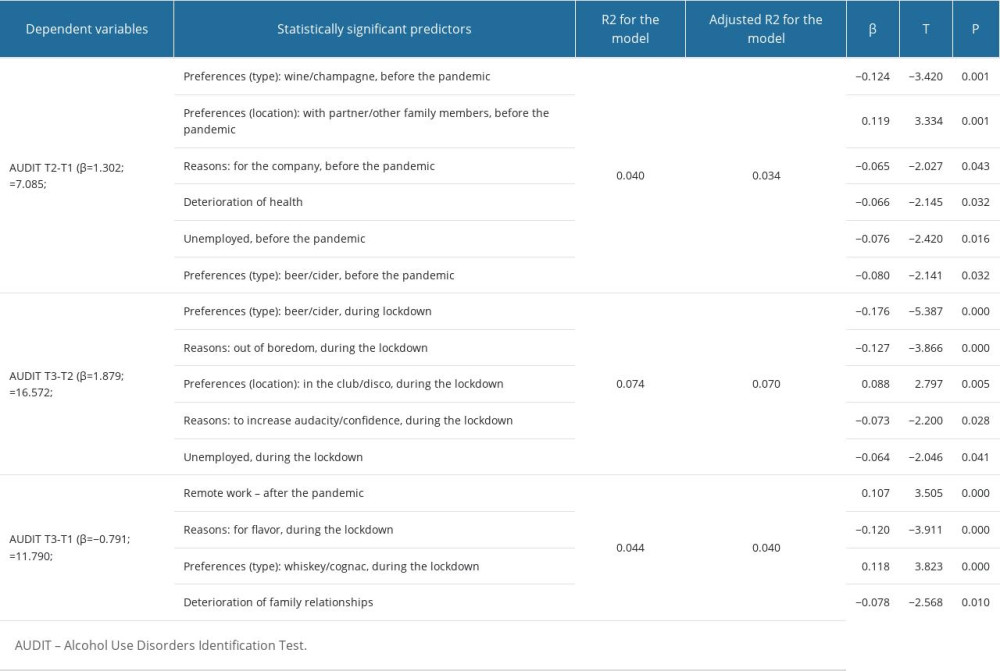 Table 5. Differences between distinguished profiles.
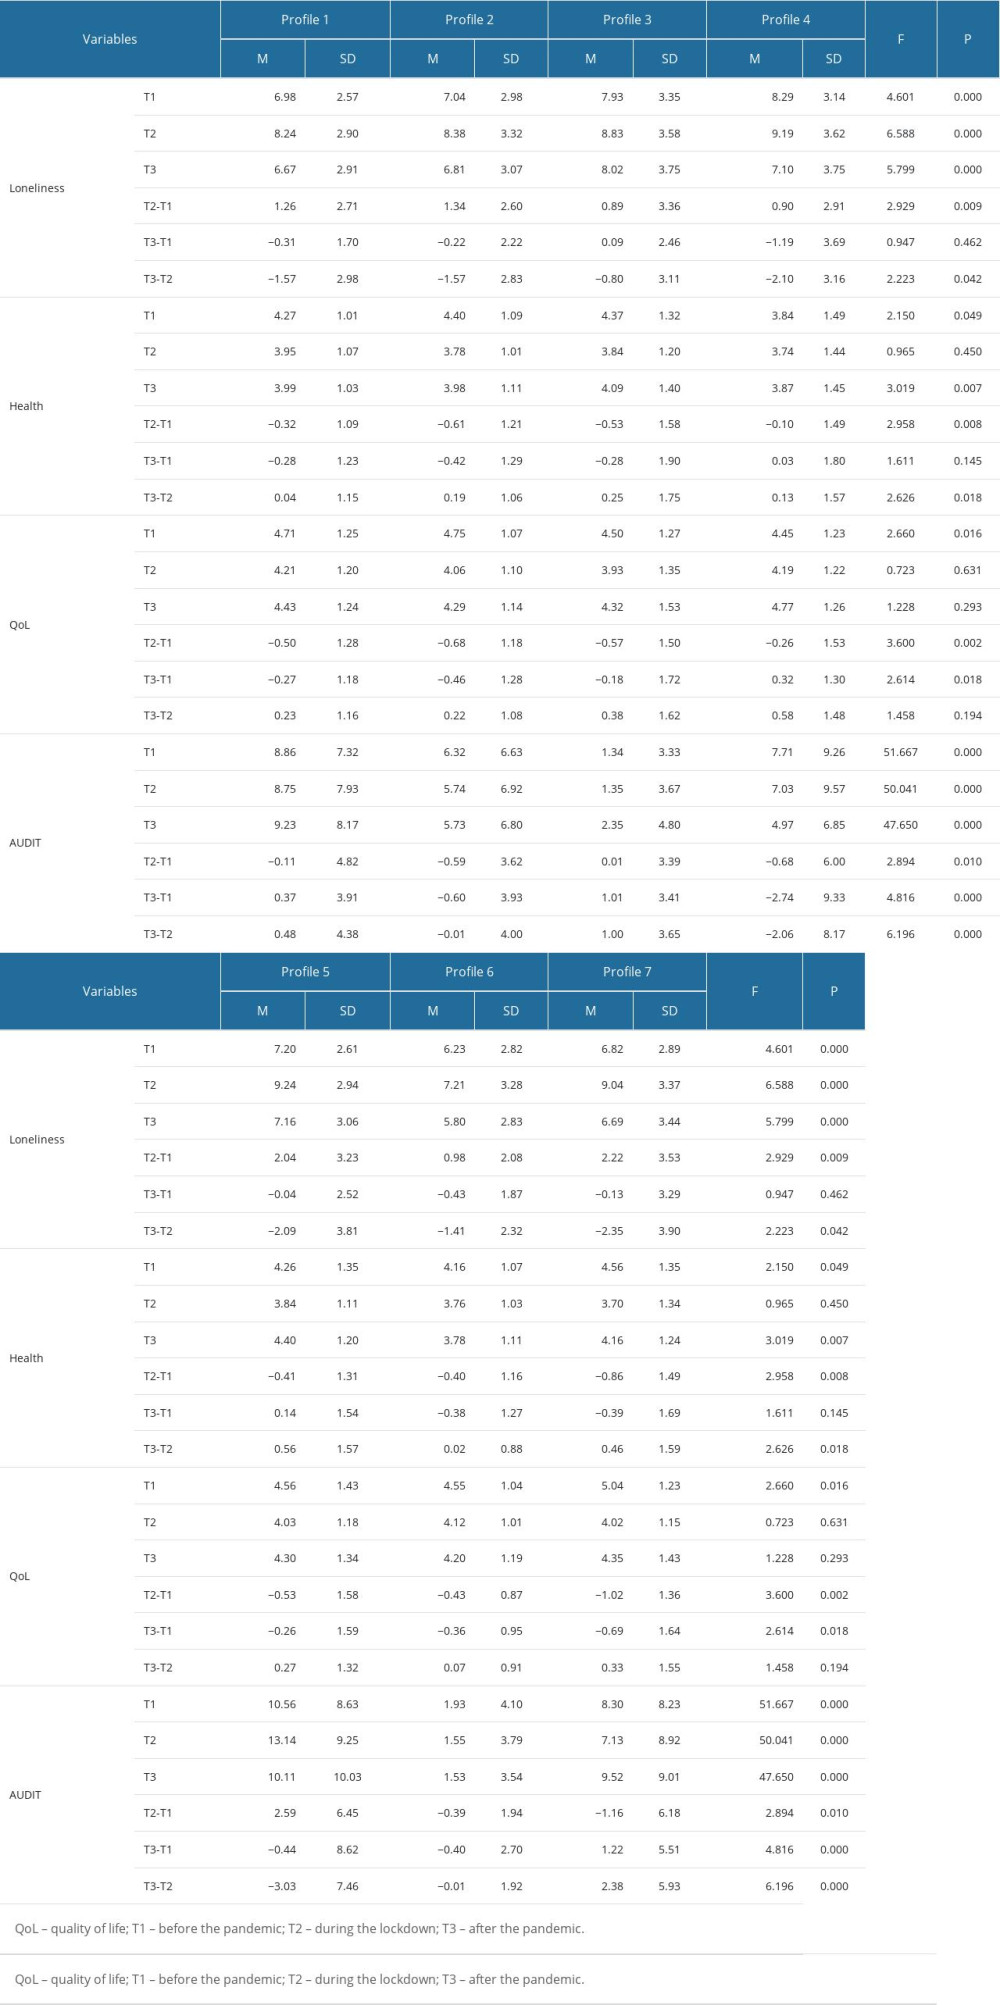
References
1. Khan A, Khan N, Shafiq M, The economic impact of COVID-19 from a global perspective: Contemp Econ, 2021; 15(1); 64-76
2. Singh G, Shaik M, The short-term impact of COVID-19 on global stock market indices: Contemp Econ, 2021; 15(1); 1-19
3. Chertoff JD, Zarzour JG, Morgan DE, The early influence and effects of the coronavirus disease 2019 (COVID-19) pandemic on resident education and adaptations: J Am Coll Radiol, 2020; 17(10); 1322-28
4. Freudenberg LS, Paez D, Giammarile F, Global impact of COVID-19 on nuclear medicine departments: an international survey in April 2020: J Nucl Med, 2020; 61(9); 1278-83
5. Budd J, Miller BS, Manning EM, Digital technologies in the public-health response to COVID-19: Nat Med, 2020; 26(8); 1183-92
6. Ettman CK, Abdalla SM, Cohen GH, Prevalence of depression symptoms in US adults before and during the COVID-19 pandemic: JAMA Netw Open, 2020; 3(9); e2019686
7. Santabárbara J, Lasheras I, Lipnicki DM, Prevalence of anxiety in the COVID-19 pandemic: An updated meta-analysis of community-based studies: Prog Neuropsychopharmacol Biol Psychiatry, 2021; 109; 110207
8. Fekih-Romdhane F, Ghrissi F, Abbassi B, Prevalence and predictors of PTSD during the COVID-19 pandemic: Findings from a Tunisian community sample: Psychiatry Res, 2020; 290; 113131
9. Ferreira LN, Pereira LN, da Fé Brás M, Ilchuk K, Quality of life under the COVID-19 quarantine: Qual Life Res, 2021; 30(5); 1389-405
10. Bidzan-Bluma I, Bidzan M, Jurek P, A Polish and German population study of quality of life, well-being, and life satisfaction in older adults during the COVID-19 pandemic: Front Psychiatry, 2020; 11; 585813
11. Dubey S, Biswas P, Ghosh R, Psychosocial impact of COVID-19: Diabetes Metab Syndr, 2020; 14(5); 779-88
12. Lazarus RS, Folkman S: Stress, appraisal, and coping, 1984, Springer publishing Company
13. Park CL, Armeli S, Tennen H, The daily stress and coping process and alcohol use among college students: J Stud Alcohol, 2004; 65(1); 126-35
14. Boffetta P, Hashibe M, Alcohol and cancer: Lancet Oncol, 2006; 7(2); 149-56
15. Boden JM, Fergusson DM, Alcohol and depression: Addiction, 2011; 106(5); 906-14
16. Grønkjær M, Curtis T, Crespigny CD, Delmar C, Acceptance and expectance: Cultural norms for alcohol use in Denmark: Int J Qual Stud Health Well-being, 2011; 6(4); 8461
17. Fairbairn CE, Sayette MA, A social-attributional analysis of alcohol response: Psychol Bull, 2014; 140(5); 1361-82
18. McKay MT, Konowalczyk S, Andretta JR, Cole JC, The direct and indirect effect of loneliness on the development of adolescent alcohol use in the United Kingdom: Addict Behav Rep, 2017; 6; 65-70
19. Vanderbruggen N, Matthys F, Van Laere S, Self-reported alcohol, tobacco, and cannabis use during COVID-19 lockdown measures: results from a web-based survey: Eur Addict Res, 2020; 26(6); 309-15
20. Bragard E, Giorgi S, Juneau P, Curtis BL, Loneliness and daily alcohol consumption during the COVID-19 pandemic: Alcohol Alcohol, 2022; 57(2); 198-202
21. Carrigan MH, Randall CL, Self-medication in social phobia: A review of the alcohol literature: Addict Behav, 2003; 28(2); 269-84
22. Barbosa C, Cowell AJ, Dowd WN, Alcohol consumption in response to the COVID-19 pandemic in the United States: J Addict Med, 2021; 15(4); 341-44
23. Callinan S, Smit K, Mojica-Perez Y, Shifts in alcohol consumption during the COVID-19 pandemic: Early indications from Australia: Addiction, 2021; 116(6); 1381-88
24. Winkler P, Formanek T, Mlada K, Increase in prevalence of current mental disorders in the context of COVID-19: Analysis of repeated nationwide cross-sectional surveys: Epidemiol Psychiatr Sci, 2020; 29; e173
25. Szajnoga D, Klimek-Tulwin M, Piekut A, COVID-19 lockdown leads to changes in alcohol consumption patterns. Results from the Polish national survey: J Addict Dis, 2021; 39(2); 215-25
26. Skotnicka M, Karwowska K, Kłobukowski F, Dietary habits before and during the COVID-19 epidemic in selected European countries: Nutrients, 2021; 13; 1690
27. Acuff SF, Strickland JC, Tucker JA, Murphy JG, Changes in alcohol use during COVID-19 and associations with contextual and individual difference variables: A systematic review and meta-analysis: Psychol Addict Behav, 2022; 36(1); 1-19
28. Hughes ME, Waite LJ, Hawkley LC, Cacioppo JT, A short scale for measuring loneliness in large surveys: Results from two population-based studies: Res Aging, 2004; 26(6); 655-72
29. Babor TF, Higgins-Biddle JC, Saunders JB, Monteiro MG, The alcohol use disorders identification test: Geneva: World Health Organization, 2001; 1-37
30. : The State Agency for the Prevention of Alcohol-Related Problems [PARPA], 2020 Available from:https://www.parpa.pl/images/autodiagnoza_20_10_2020_1.pdf
31. Akogul S, Erisoglu M, An approach for determining the number of clusters in a model-based cluster analysis: Entropy, 2017; 19(9); 452
32. Rosenberg JM, Beymer PN, Anderson DJ: TidyLPA: Easily carry out Latent Profile Analysis (LPA) using open-source or commercial software [R package], 2019 Available from: https://data-edu.github.io/tidyLPA/
33. Faul F, Erdfelder E, Lang AG, Buchner A, G*Power 3: A flexible statistical power analysis program for the social, behavioral, and biomedical sciences: Behav Res Methods, 2007; 39(2); 175-91
34. Ham LS, Bonin M, Hope DA, The role of drinking motives in social anxiety and alcohol use: J Anxiety Disord, 2007; 21(8); 991-1003
35. Wang Y, Lu H, Hu M, Alcohol consumption in China before and during COVID-19: Preliminary results from an online retrospective survey: Psychiatry Front, 2020; 11; 597826
36. Chodkiewicz J, Talarowska M, Miniszewska J, Alcohol consumption reported during the COVID-19 pandemic: The initial stage: Int J Environ Res Public Health, 2020; 17(13); 4677
37. Silczuk A, Gujska JH, Wojtyniak B, The COVID-19 crisis and the incidence of alcohol-related deaths in Poland: Med Sci Monit, 2023; 29; e940904
38. Smith G, Step away from stepwise: J Big Data, 2018; 5; 32
39. Ahorsu DK, Lin CY, Imani V, The fear of COVID-19 scale: Development and initial validation: Int J Ment Health Addict, 2022; 20(3); 1537-45
Tables
Table 1. Participants’ demographic characteristics.Table 2. Distribution of the number of specific risk groups for alcohol dependence according to the Polish Alcohol Use Disorders Identification Test (AUDIT) cut-off points.Table 3. Predictors of the severity of symptoms of alcohol dependence in pre-pandemic, lockdown, and post-pandemic periods.Table 4. Predictors of changes in the severity of alcoholism dependence symptoms.Table 5. Differences between distinguished profiles.Table 1. Participants’ demographic characteristics.Table 2. Distribution of the number of specific risk groups for alcohol dependence according to the Polish Alcohol Use Disorders Identification Test (AUDIT) cut-off points.Table 3. Predictors of the severity of symptoms of alcohol dependence in pre-pandemic, lockdown, and post-pandemic periods.Table 4. Predictors of changes in the severity of alcoholism dependence symptoms.Table 5. Differences between distinguished profiles. In Press
Clinical Research
Body Weight and Insulin Resistance Indicators Among ChildrenMed Sci Monit In Press; DOI: 10.12659/MSM.951434
Clinical Research
Comparison of Radiographic Cervical Sagittal Alignment Parameters in Patients With Nonspecific Neck Pain, D...Med Sci Monit In Press; DOI: 10.12659/MSM.952950
Clinical Research
Combined Fibrinogen and Urinary α1-Microglobulin as Predictors of Respiratory Tract Infection in Children w...Med Sci Monit In Press; DOI: 10.12659/MSM.951066
Database Analysis
Evaluation of Salivary Total Oxidant Status (TOS) and Total Antioxidant Status (TAS) in Orthodontic Patient...Med Sci Monit In Press; DOI: 10.12659/MSM.952052
Most Viewed Current Articles
17 Jan 2024 : Review article 14,175,576
Vaccination Guidelines for Pregnant Women: Addressing COVID-19 and the Omicron VariantDOI :10.12659/MSM.942799
Med Sci Monit 2024; 30:e942799
13 Nov 2021 : Clinical Research 3,756,620
Acceptance of COVID-19 Vaccination and Its Associated Factors Among Cancer Patients Attending the Oncology ...DOI :10.12659/MSM.932788
Med Sci Monit 2021; 27:e932788
14 Dec 2022 : Clinical Research 2,465,966
Prevalence and Variability of Allergen-Specific Immunoglobulin E in Patients with Elevated Tryptase LevelsDOI :10.12659/MSM.937990
Med Sci Monit 2022; 28:e937990
16 May 2023 : Clinical Research 708,651
Electrophysiological Testing for an Auditory Processing Disorder and Reading Performance in 54 School Stude...DOI :10.12659/MSM.940387
Med Sci Monit 2023; 29:e940387