23 February 2024: Clinical Research
Urinary Concentration of Renal Biomarkers in Healthy Term Neonates: Gender Differences in GST-pi Excretion
Monika KamianowskaDOI: 10.12659/MSM.942819
Med Sci Monit 2024; 30:e942819


Abstract
BACKGROUND: Serum creatinine, the criterion standard in assessment of renal function, is not reliable for the neonatal period because of its dependence on renal immaturity and maternal creatinine levels. Thus, it is important to study other biomarkers of renal function in neonates. The present study aimed to measure the urinary concentration of renal biomarkers: calbindin, clusterin, GST-pi (glutathione-S-transferase-alpha), KIM-1 (kidney injury molecule 1), MCP-1 (monocyte chemoattractant protein-1), and B2M (beta 2-microglobulin) in healthy term neonates.
MATERIAL AND METHODS: In the study, we included 80 healthy term neonates – 40 females and 40 males. We collected the neonates’ urine on their first day of life. Urinary concentrations of calbindin, clusterin, KIM-1, MCP-1, and B2M were assessed using an immunoassay for kidney toxicology research. Because dilution of the urine affects the concentrations of urinary biomarkers, we normalized them to the concentration of urinary creatinine (Cr) and present them as biomarker/Cr ratios.
RESULTS: We obtained the following values of the assessed biomarker/Cr ratios (median [Q1-Q3]): calbindin/Cr.: 197.04 (56.25-595.17), KIM-1/Cr: 0.09 (0.04-0.18), MCP-1/Cr: 0.05 (0.02-0.14), B2M/Cr: 126.12 (19.03-342.48), GST-pi/Cr in boys: 1.28 (0.46-3.77), GST-pi/Cr in girls: 8.66 (2.51-27.82), clusterin/Cr: 4.55 (1.79-12.97) ng/mg Cr.
CONCLUSIONS: We showed the urinary levels of calbindin, clusterin, GST-pi, KIM-1, MCP-1, B2M in white, West Slavic, healthy term neonates. We found that in there is an association between female sex and a higher urinary GST-pi excretion, but urinary excretion of calbindin, clusterin, KIM-1, MCP-1, and B2M is sex-independent. The urinary levels of the assessed biomarkers do not depend on the method of delivery.
Keywords: biomarkers, Infant, Newborn, Kidney
Background
Despite considerable advances in the neonatal medicine, the assessment of kidney function in neonates is still a challenge [1,2]. Acute kidney injury (AKI) commonly occurs in neonatal intensive care units (NICU). According to the largest neonatal AKI study – the AWAKEN (Assessment of Worldwide Acute Kidney injury Epidemiology in Neonates) – 30% of neonates who are admitted to the NICU develop AKI [3]. Its prevalence is even higher in specific groups of patients: very low birth-weight neonates, neonates undergoing cardiac surgery, and children with hypoxic-ischemic encephalopathy [4]. Neonatal AKI is strongly associated with multiple adverse outcomes: prolonged and complicated hospitalization, prolonged mechanical ventilation, and high mortality. AKI affects distant organs, and associations have been reported between neonatal AKI and intraventricular hemorrhage, abnormal brain MRI, bronchopulmonary dysplasia, and prolonged mechanical ventilation [5]. The diagnosis of neonatal AKI is unfortunately under-recognized. Only 10–30% of newborns with AKI are correctly diagnosed [6]. Because of its high incidence rate and high mortality (20–50%), AKI is one of the most important diseases among NICU patients [7].
Neonatal AKI survivors are prone to developing chronic kidney disease (CKD). The following mechanisms underlying the development of CKD following AKI were proposed: loss of nephrons, hyperfiltration, endothelial injury, maladaptive repair mechanisms, interstitial inflammation, fibrosis, and vascular insufficiency. The phenotype of CKD differs depending on the site and severity of the injury and may be manifested as hypertension, tubular dysfunction, proteinuria, reduced GFR, and hyperfiltration [8].
Serum creatinine concentration is the criterion standard in assessment of renal function in clinical practice [9]. However, serum creatinine is not reliable for the neonatal period because of its dependence on renal immaturity and maternal creatinine levels [10]. As creatinine depends on the muscle mass, its levels in neonates are low. The neonates’ serum creatinine levels may be elevated for at least 2 days after delivery because the maternal creatinine is transferred through the placenta [11]. Also, gestational age (GA) and preterm birth impact neonatal serum creatinine levels. In children born before 32 weeks of gestation, serum creatinine increases after birth and then, starting from the fourth day, slowly decreases. Therefore, it is not reliable in detecting AKI in the first days after delivery [12]. Moreover, the values of serum creatinine may not change until the loss of 25–50% of kidney function [13].
To detect AKI more easily, earlier, and more effectively, novel biomarkers are being developed. The following substances are among the proposed potential urinary biomarkers of renal function and injury: NGAL (neutrophil gelatinase-associated lipocalin), KIM-1 (kidney injury molecule 1), osteoactivin, osteopontin, IL-18 (interleukin-18), cathepsin B, calbindin, clusterin, GST-alpha (glutathione S-transferase-alpha), GST-pi (glutathione S-transferase-pi), TIMP-1 (tissue inhibitor of metalloproteinases 1), TFF-3 (trefoil factor-3), B2M (beta 2-microglobulin), and MCP-1 (monocyte chemoattractant protein-1) [14–20].
The literature provides insight into the state of knowledge regarding biomarkers of kidney injury. In 2021 Correa et al provided a valuable prospective analysis of 17 urine biomarkers in 40 stable preterm neonates. This study gave an insight into potential reference standards for premature babies. However, because 80% of the neonates were born from hypertensive pregnancies, 60% had respiratory distress syndrome, and 20% were born from pregnancies complicated by rupture of the amniotic sac and premature placental abruption, accurate assessment of the reference values given by the authors causes interpretation difficulties [15]. Also, De Freitas et al focused on urine biomarkers in neonates and assessed both preterm and term neonates. However, in both groups, there were patients treated with nephrotoxic drugs (31% of term neonates and 43% of preterm neonates) [21]. This negatively affects the ability to use these results as potential normal values. Among others, Capelli et al, Miklaszewska et al, and Askenazi et al assessed biomarkers of preterm neonates with kidney injury [14,22–24]. There are also studies available in the literature assessing biomarkers in newborns with severe clinical conditions, including asphyxiated neonates [16,25]. Unfortunately, most of these studies did not assess healthy term neonates or include in this group children with a clinical condition potentially leading to kidney damage, such as the need for nephrotoxic drugs.
In the literature on renal biomarkers, only a few studies refer to neonates and even fewer discuss healthy full-term neonates [11]. Normal reference ranges for neonates are not usually available in laboratories, but many researchers need them to have a point of reference in their research. There are several studies available in the literature regarding concentrations of calbindin, clusterin, GST-pi, MPC-1, and B2M in preterm neonates [15,26–29]. However, to the best of our knowledge, the literature lacks studies regarding healthy full-term neonates [30,31]. There is an enormous gap in research regarding this group of children, which is essential to establish reference values. Additionally, the reference values are crucial for applying biomarkers for diagnosis of renal injury and function in neonates. A profound understanding of biomarker physiology is essential to use it as an effective tool to diagnose diseases such as AKI.
In the present study, instead of focusing on children in a serious clinical condition and children born prematurely, we focused on healthy newborns. Our study included only healthy term neonates to establish possible reference values for this age group and to draw the attention of other researchers to the importance of finding reference values for healthy newborns. We focused our research on the following biomarkers: calbindin, clusterin, GST-pi, KIM-1, MCP-1, and B2M.
Calbindin is a calcium-binding protein. It is in the distal tubule and the proximal part of the collecting duct of the nephron and plays a considerable role in active transport of calcium in the kidney [32]. Studies show that it is released from damaged distal renal tubule cells into the urine after renal injury induced by various triggers [33,34]. Assessment of calbidin may be useful in predicting tubular damage in neonates and distinguishing between distal and proximal renal tubular injury.
Clusterin is a heat-shock protein secreted by epithelial and secretory cells as a response to stress conditions affecting the kidneys [35,36]. It can be detected both in mesangial cells and in cells of the renal tubule epithelium. Clusterin has both anti-apoptotic and protective roles against ischemia-reperfusion injury in the kidneys [37]. Its increased levels in the urine may be seen in various kidney diseases [35]. We focused on this biomarker because of its role in ischemia-reperfusion injury and the fact that ischemia-reperfusion injury is the major cause of AKI commonly occurring in NICUs [38].
Glutathione-S-transferase-pi (GST-pi) is an enzyme important in the processes of detoxification, which catalyzes the addition of glutathione to electrophilic compounds [39]. This molecule is present in the distal tubule of the nephron. Its release into the urine occurs after cell damage when the cell integrity of the renal tubule is disturbed [40,41]. GST-pi is a scavenger of free radicals, which helps the cells of tubular epithelium survive stressful conditions associated with generation of these compounds [42]. In physiological conditions, the concentration of GST-pi in the urine is low, but it increases after renal injury [43,44]. After birth, neonates are vulnerable to reactive oxygen species and reactive nitrogen species, which induce oxidative damage. The kidneys are prone to oxidative stress [45]. This biomarker was chosen because of its role as a scavenger of free radicals and thus has a role in oxidative-stress-related renal diseases in neonates [46].
Kidney injury molecule-1 (KIM-1) is a transmembrane protein that is not normally present in the kidneys, but its expression occurs on the proximal tubule apical membrane after injury. KIM-1 allows the epithelial cells to recognize and phagocytose dead cells, which can be found in the kidney after ischemia [47]. KIM-1 facilitates elimination of apoptotic cells from the lumen of the renal tubule and plays an important role in anti-inflammatory responses [48]. This molecule was chosen because of its connection with ischemia, the most common cause of AKI [49]. As it is specific to proximal renal injury, it may be useful in the diagnosis of drug-induced nephrotoxicity. Use of nephrotoxic drugs is common in the NICU and includes antibiotics (eg, vancomycin and aminoglycosides) affecting proximal renal tubules [5].
Monocyte chemoattractant protein-1 (MCP-1) is a chemokine important in innate immunity and tissue inflammation [50]. MCP-1 plays an important role in inflammatory disease of the kidneys. It mediates the release of monocytes from the bone marrow and then directs them to the site of inflammation. It is also responsible for proliferation, migration, and differentiation of leukocytes [51]. Higher expression and secretion of MCP-1 occurs in renal tissues and this molecule can be detected in the urine of patients with renal diseases [17]. This biomarker was chosen because of its role in inflammatory diseases and the fact that AKI is associated with intrarenal inflammation. Assessment of MCP-1 may give insight into progression of inflammation in the kidneys [52].
In people with normal kidney function, beta2-microglobulin (B2M) is constantly produced in the body and then eliminated by the kidneys, mainly through glomerular filtration. After filtration, 99.9% is reabsorbed in the renal proximal tubules and catabolized in their cells. The proximal tubular dysfunction observed in many clinical conditions can lead to increased excretion of B2M in the urine because of decreased reabsorption and catabolism of this molecule [53,54]. This biomarker was chosen because of its ability to indicate the localization of nephron injury. The proximal renal tubule is a major site for tubular damage and proximal tubule injury is the most frequent cause of AKI. Therefore, it is important to identify the site of injury [55].
The understanding of the above listed biomarkers may be essential to better diagnose AKI in neonates as these biomarkers are involved in pathological processes in this disease. Ischemia-reperfusion injury, oxidative damage, and intrarenal inflammation are crucial in the pathogenesis of AKI in neonates. Moreover, changes in the concentrations of some biomarkers (B2M, calbindin, GST-pi, KIM-1, B2M) are specific to the location of the injury. Therefore, assessing these biomarkers would be useful in determining the site of damage.
In this study we measured markers of renal function – calbindin, clusterin, GST-pi, KIM-1, MCP-1, and B2M – in healthy full-term newborns on their first day of life. We wanted to determine possible reference values of these parameters for the white, West Slavic, healthy term neonatal population.
Material and Methods
ETHICS STATEMENT:
Our study was carried out according to the ethical guidelines of the Declaration of Helsinki, and the Local Bioethics Committee of the Medical University of Białystok approved the study (protocol code: APK.002.502.2021, date of approval: 16th December 2021). Parents of all children taking part in the study received appropriate information about the aim and methods of the research and of the proceeding after obtaining the test results. They gave their written, informed consent to the study before its beginning.
PATIENT RECRUITMENT:
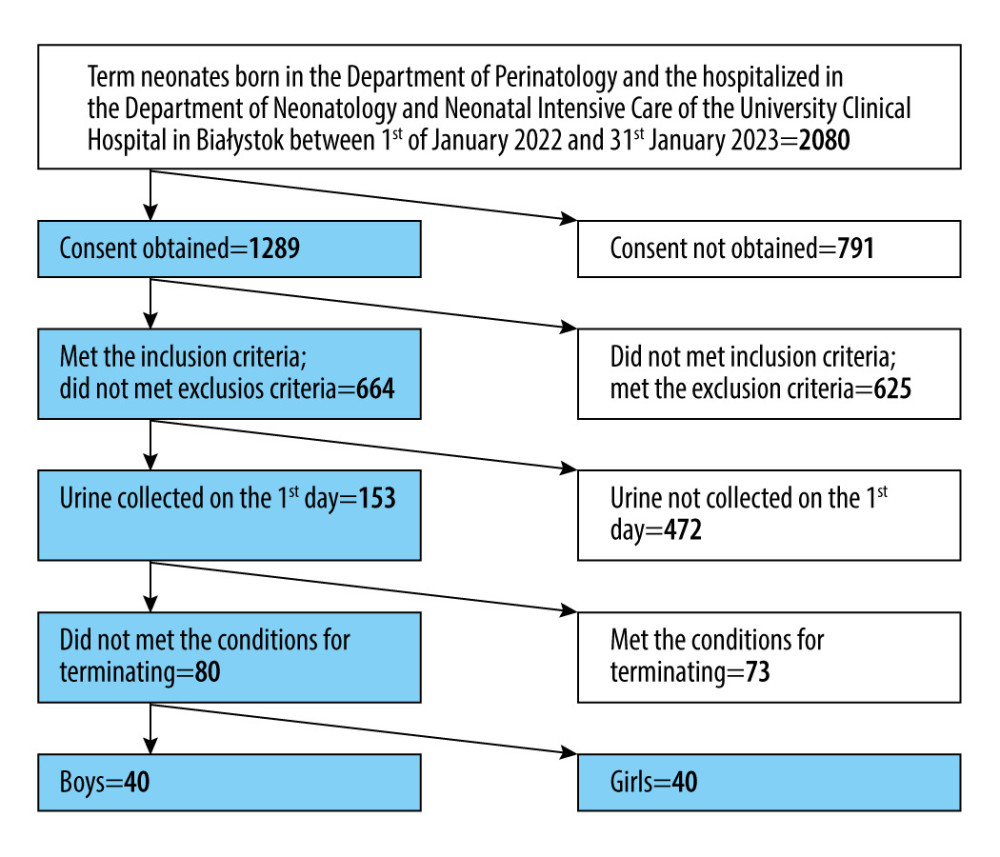
The prospective study took place at the Medical University of Białystok in the Department of Neonatology and Neonatal Intensive Care. We enrolled 80 white, West Slavic, healthy, full-term neonates. Only children born between 37 and 42 weeks of pregnancy in the Department of Perinatology of the University Clinical Hospital in Białystok and hospitalized in the Department of Neonatology and Neonatal Intensive Care of the University Clinical Hospital in Białystok between 1 January 2022 and 31 January 2023 were included in the study. The study aimed to assess the values of the biomarkers in healthy neonates; therefore, we used accurate criteria of inclusion and excluded all postnatal and prenatal factors that can influence renal function.
Criteria for including a newborn in the study:
Criteria for excluding a newborn from the study:
We ended participation in the study when a neonate developed a nosocomial infection, the general condition deteriorated, or the parents’ consent was withdrawn.
The algorithm of patient screening is presented in Figure 1.
SAMPLE COLLECTION:
We collected the neonate’s urine only once on the first day of life. Urine samples were taken at 9 am. To collect the urine noninvasively, we used bags, which were sterile and single-use (ZARYS, Zabrze, Poland). Urine from the bag was transferred to a sterile syringe (Romed, Wilnis, The Netherlands) and stored in a refrigerator (4°C) up to 2 hours. Then, it was centrifuged for 10 minutes at 1000 rpm (Eppendorf SE, Hamburg, Germany). Centrifugate samples of the urine were stored in the refrigerator (4°C) and then frozen and kept in a freezer (−80°C) for no more than 4 months. Our samples were stored at −80°C to reduce potential sample degradation [56]. The samples were thawed immediately before the analysis. We did not thaw and freeze the samples repeatedly.
DETERMINATION OF URINARY CREATININE CONCENTRATION:
The concentration of urinary creatinine was measured with a Cobas 6000/C501 analyzer (Roche Diagnostics Corporation, Indianapolis, USA) with an in vitro test for quantitative determination of the creatine concentration in urine. Buffered Jaffé’s kinetic reaction without deproteinization was used. The results are presented in milligrams per deciliter (mg/dl). The assessment was done in an accredited diagnostic laboratory of the Department of Laboratory Diagnostics at the University Clinical Hospital in Białystok.
DETERMINATION OF BIOMARKERS’ CONCENTRATIONS AND VALUES OF BIOMARKER/CR RATIOS:
The concentrations of calbindin, clusterin, GST-pi, KIM-1, MCP-1, and B2M were measured using an immunoassay for kidney toxicology research – the Bio-Plex Pro™ RBM Human Kidney Toxicity Panel 1 and 2 (BIO-RAD, Hercules, CA, USA) – according to the manufacturer’s instructions. Determinations were performed using a specialized plate reader (Bio-Plex 200, BIO-RAD, Hercules, CA, USA). Prior to the determination, the instrument was validated and calibrated to ensure reliability and consistency of the results using the commercially available Bio-Plex® Validation Kit 4.0 and Bio-Plex Calibration Kit (BIO-RAD, Hercules, CA, USA).
The characteristics of the immunoassay parameters are presented in Table 1.
The concentrations of all assessed biomarkers are presented in nanograms per milliliter (ng/ml).
As dilution of the urine affects the concentrations of urinary biomarkers, we normalized them to the urinary concentration of creatinine [57]. All biomarker/creatinine (biomarker/Cr) ratios are given in nanograms per milligram of creatinine (ng/mg Cr).
STATISTICAL ANALYSIS OF DATA:
Our study had a strict restriction of enrollment to control confounding variables. As the clinical condition and age were the most important confounding factors, we assessed only healthy full-term neonates enrolled according to the inclusion and exclusion criteria.
Counts (percentages) are used to present discrete variables. The continuous variables are shown as median, first quartile, and third quartile (median [Q1–Q3]). Normality of data distribution was assessed using the Shapiro-Wilk test [58]. Since the distribution was not normal, we compared the continuous variables between 2 independent groups with the Mann-Whitney U test. This test is used to detect differences between medians of 2 populations. Assumptions of the Mann-Whitney U test are: continuous variables, non-normal distribution of data, similar shape of the 2 groups, and independent, randomly selected samples [59]. We used the chi-square test to determine if there were non-random associations between the 2 categorical variables. This test is a test of independence. Assumptions of the chi-square test are: random selection, frequency data, independence of study groups, mutually exclusive categories, categorical variable, single data contribution, cell expected frequency of 5 or more in at least 80% of cells and at least 1 in all cells [60]. We assessed the associations between the variables with Spearman’s rank correlation coefficients. Correlations were used to assess whether there was a possible linear association between the variables. Assumptions of the Spearman’s rank correlation coefficients are: variables measured on ratio, interval, or ordinal scale, paired observations, and monotonic relationship [61]. The level of significance was α=0.05, and the results were significant when the value of P was lower than 0.05 (P<0.05). For all assessed biomarkers, we determined the 95% confidence interval for the mean of a normal population to establish a likely range of values that with 95% probability contains the true mean of the population. We used the following equation [62]:
We also wanted to find a reference interval in which the central 95% values of healthy subject lie. To do that, we calculated the reference interval for the biomarker/Cr ratios with a nonparametric approach using sample quantiles [63]. All the above tests were done using the Statistica 13.3 package (StatSoft, USA). There were no missing data on the concentrations of the biomarkers and the values of the biomarker/Cr ratios. Nonparametric statistics, such as Mann-Whitney U test and Spearman’s rank correlation coefficients, are not significantly affected by outliers because they are computed based on ranks or sign. Ranks and medians are not affected by extreme values (when compared to mean, which is sensitive to outliers) [64].
Results
CHARACTERISTICS OF THE NEONATES:
The characteristics of the neonates taking part in the study are presented in Table 2.
All neonates taking part in the study were born at 37–42 weeks of gestation. The median gestational age of the assessed neonates was 39 weeks. They had the following anthropometric measurements: median birth weight=3345 g, median head circumference=34 cm, and median length=55 cm. We did not find any significant differences between female and male neonates in gestational age and anthropometric measurements (birth weight, length, head circumference) (
ANALYSIS OF THE BIOMARKERS’ CONCENTRATIONS AND VALUES OF BIOMARKER/CR RATIOS:
The concentrations of the assessed biomarkers (calbindin, KIM1, MCP-1, B2M, GST-pi, clusterin) and the values of the biomarker/Cr ratios are presented in Table 3.
The median values of the assessed biomarkers concentrations were: calbidin=130.75 ng/ml, KIM-1=0.07 ng/ml, MCP-1=0.03 ng/ml, B2M=54.56 ng/ml, and clusterin=2.03 ng/ml. We did not find any differences in the levels of calbindin, KIM1, MCP-1, B2M, and clusterin between males and females (P>0.05 in each case, Mann-Whitney U test). The median values of the assessed biomarker/Cr ratios were: calbindin/Cr=197.04 ng/mg Cr, KIM-1/Cr=0.09 ng/mg Cr, MCP-1/Cr=0.05 ng/mg Cr, B2M/Cr=126.12 ng/mg Cr, and clusterin/Cr.=4.55 ng/mg Cr. The values of the biomarker/Cr ratios calculated from these biomarkers did not differ between males and females (P>0.05 in each case, Mann-Whitney U test). However, the concentration of GST-pi and the value of the GST-pi/Cr ratio varied by sex. Both parameters were higher in females (P<0.01, Mann-Whitney U test). The median concentrations of GST-pi in males and females were: 0.76 and 6.97 ng/ml, respectively. The median values of GST-pi/Cr ratios in males and females were 1.28 and 8.66 ng/mg Cr, respectively. Biomarker levels and the associated biomarker/Cr ratios were compared between vaginal- and cesarean-born newborns (Mann-Whitney U test). The detailed data are presented in Table 4. No differences were found in either biomarker’s levels or the value of the biomarker/Cr ratio between vaginal-born and cesarean-born children.
ANALYSIS OF 95% CONFIDENCE INTERVALS (CI) FOR THE MEAN OF A NORMAL POPULATION:
We calculated the 95% CI for the mean of a normal population for all assessed biomarker/Cr ratios. We used the following equation: sample mean±z value×(standard deviation/√[sample size]). The 95% CI for the value of the GST-pi/Cr ratio was calculated separately for males and females because these variables were sex-dependent. The estimated 95% confidence intervals for the mean of a normal population are presented in Table 5. The above presented 95% CIs for the mean of a normal population show a likely range of values that with 95% probability contain the true mean of the population.
ANALYSIS OF THE CORRELATIONS:
We assessed the associations between the variables (their strength and direction) with Spearman’s rank correlation coefficients. The concentration of any biomarker and the value of any biomarker/Cr ratio did not correlate with gestational age and anthropometric measurements. Positive correlations were found between almost all biomarker/Cr ratios. The following correlations were found: calbidin/Cr and KIM-1/Cr (
The correlations between the biomarker/Cr ratios are presented in Table 6.
We correlated new biomarkers of renal damage with known indicators, such as KIM-1/Cr ratio and B2M/Cr ratio. A positive correlation of calbidin/Cr, clusterin/Cr, GST-pi/Cr, and MCP-1/Cr with KIM 1 or B2M may indicate their roles in the assessment of renal function in newborns. However, tests in newborns with low birth weight, hypoxia, renal defects, or other factors leading to damage to the renal tubules to assess their importance in diagnostics are necessary.
ANALYSIS OF THE REFERENCE INTERVALS:
We also determined the reference intervals (intervals in which the central 95% values of healthy subject lie). To do that, we calculated the reference interval for the biomarker/Cr ratios with a nonparametric approach using sample quantiles. The obtained reference intervals are presented in Table 7.
Discussion
This study measured markers of renal function – calbindin, clusterin, GST-pi, KIM-1, MCP-1, and B2M – in healthy full-term newborns on their first day of life. We obtained the following median values of the assessed biomarker/Cr ratios: calbindin/Cr=197.04, KIM-1/Cr=0.09, MCP-1/Cr=0.05, B2M/Cr=126.12, GST-pi/Cr in males=1.28, GST-pi/Cr in females=8.66, clusterin/Cr=4.55 ng/mg Cr.
We wanted to determine possible reference values of these parameters for the neonatal population. Despite many studies focused on renal biomarkers, few of them refer to healthy full-term neonates [11]. There is an enormous gap in current research regarding this group of children, which is essential to establish reference values. In our study, we tried to find these values in healthy full-term neonates, taking a step closer to using them in clinical practice.
Because of the special nature of the neonatal period in human life, we compared our results to those previously published. However, this comparison was difficult because there are very few studies in the literature regarding healthy full-term newborns. The vast majority of the literature refers to adults, older children, and premature newborns. This significantly limits the possibility of comparing our results with other studies. We tried to assess how the values of the tested biomarkers behave in healthy full-term newborns compared to other age groups and find the probable causes of these regularities. In Table 8, we show the results of other studies on these biomarkers.
Calbindin as a biomarker of nephrotoxicity was assessed, among others, in cisplatin-induced kidney injury [33,65] and as a part of various biomarker testing in the adult and neonatal population [15,26,65]. However, the results in these studies are inconsistent [15,26,33,65,66]. The urinary calbindin concentration and the value of calbindin/Cr ratio in our study were both higher than reported in previous research. However, none of them assessed healthy full-term neonates, so the findings cannot be easily compared. We observed changes in the distribution of calbindin in preterm neonates, as their kidneys are still undergoing maturation. The expression of calbindin in the collecting duct decreases and the expression in the distal tubular cells increases. These processes may lead to higher urinary calbindin concentration in healthy full-term neonates when compared to preterm children [67]. In contrast, lower urinary calbindin in adults may result from age-related decrease in its expression in the kidneys because of lower levels of circulating vitamin D [68].
Our study findings indicate that the urinary clusterin level in healthy full-term neonates is comparable to that of adults [66,69], but it is significantly lower than in preterm neonates [15,26]. Clusterin expression is increased in immature and injured renal tubules [70]. Both situations are typically seen in preterm neonates, which still undergo nephrogenesis; therefore, their kidneys are especially prone to injury. Lower urinary clusterin levels in full-term neonates, when compared to preterm neonates, may result from their greater maturity and the lower vulnerability to kidney-damaging factors and, therefore, a lower probability of kidney damage [71].
The GST-pi’s urinary excretion is higher in preterm neonates than in healthy adults [28]. In our study we showed that urinary GST-pi levels in healthy full-term neonates are like the values reported in healthy adults [28,41], but they were significantly lower than in the preterm neonates [28]. Premature babies are much more vulnerable to oxidative stress than full-term neonates and adults as their antioxidant defenses are too weak to counterbalance the generation of reactive oxygen species. Therefore, it seems rational that the urinary concentration of GST-pi in this group is higher [45]. We found that both GST-pi concentration and the GST-pi/Cr ratio were higher in females than in males. von Scholten et al reported similar results [72]. Sexual dysmorphism of GST activity can be observed in various organs. Females have a higher GST-pi detoxification activity, which may be related to female sex hormones [73]. For this reason, separate norms should be prepared for males and females.
In our study, we showed that urinary KIM-1 concentration in healthy full-term neonates is similar to the values reported in healthy adults by Brott et al [66] or reported in healthy full-term neonates by Bennett et al [31]. However, the data on urinary KIM-1 levels are inconsistent. Values presented for preterm and full-term neonates and for adults vary among studies conducted by different researchers [15,30,26,29,66]. Here, it is difficult to compare them with our study. However, low values of urinary KIM-1 in healthy full-term neonates without kidney injury seem rational, as this molecule is not normally present in the kidneys [57]. Similar to other studies, we found that urinary KIM-1 level does not depend on sex [30,74].
In our study we showed that urinary MCP-1 were like those observed by other researchers in healthy children [75,76], but they were significantly lower than in healthy adults [69,77]. The explanation for this phenomenon is that the level of MCP-1 correlates with biological age [78]. It reflects states promoting aging and diseases related to age, such as sterile inflammation and cell senescence [79]. Its levels in healthy children and neonates are lower than in healthy adults.
The urinary B2M concentrations in our study were like those observed in healthy adults [66], but they were significantly lower than in preterm neonates [26,27], which is consistent with the fact that increasing prematurity is associated with increased glomerular permeability and decreased proximal tubular protein reabsorption [28]. Both situations lead to lower urinary B2M concentration in the full-term neonates assessed in our study when compared to preterm children.
Knowledge of the normal values of tested parameters allows clinicians to conduct research on sick children and use them in clinical practice. A better understanding of the biomarkers’ application may help in early detection of AKI, and may allow early treatment and better outcomes in neonates, a group of patients especially prone to having AKI [80].
Research such as the present study requires utilization of frozen samples, and evaluation of storage degradation by comparing fresh and stored samples is very important. However, we did not focus on this aspect, as it was not the aim of the study. To minimize sample degradation, our samples were stored at −80°C [80]. However, future studies should evaluate the degradation of biomarkers during storage to better understand how storage affects them and to what extent results obtained from frozen samples can be generalized to fresh samples. The relatively small group of neonates included in the study suggests conducting researches on a larger group of patients, which would make it possible to draw solid conclusions about the assessed biomarkers of renal function and injury. We assessed 80 healthy neonates from a specific population – white, West Slavic, newborns, so we cannot generalize our conclusions to other populations. Therefore, similar studies should be conducted in various racial and ethnic groups. We chose to focus on assessing biomarkers in urine due to its noninvasiveness and easy collection method. However, it would be valuable to measure both their urinary and serum concentrations. Such a procedure may provide a more complete understanding of biomarkers’ physiology. We did not compare the results with other laboratories because that was not the purpose of our study. We discussed our results in comparison to those obtained by other researchers. However, it would be valuable to conduct similar tests in different laboratories and compare the results to increase their reliability. Conducting longitudinal studies to observe the changes of the assessed biomarkers over time would be valuable, as changes in these biomarkers on the following days of the neonate’s life are not well known. Including preterm neonates in these studies could also impact clinical practice and facilitate comparative analysis.
Conclusions
We showed the urinary levels of calbindin, clusterin, GST-pi, KIM-1, MCP-1, and B2M in white, West Slavic, healthy term neonates. They might serve as reference values in further researches concerning different clinical states. There is an association between female sex and an elevated urinary GST-pi excretion in term newborns. Urinary excretion of calbindin, clusterin, KIM-1, MCP-1, and B2M in full-term neonates is sex-independent. The urinary levels of the assessed biomarkers in full-term neonates do not depend on the method of delivery (cesarean and vaginal delivery).
Tables
Table 1. The characteristics of the immunoassays used to measure the concentrations of the biomarkers.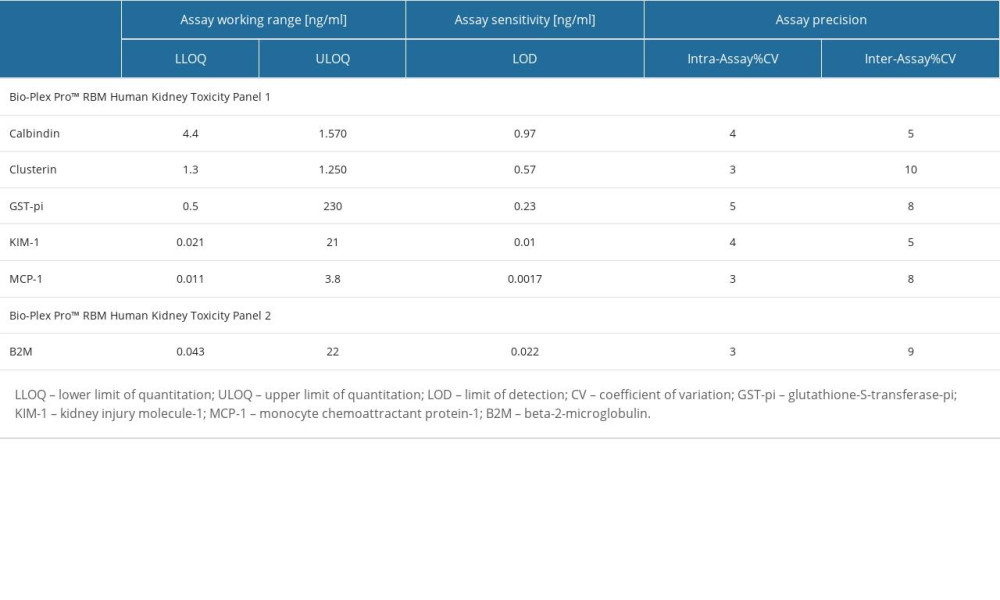 Table 2. The characteristics of the newborns taking part in the research.
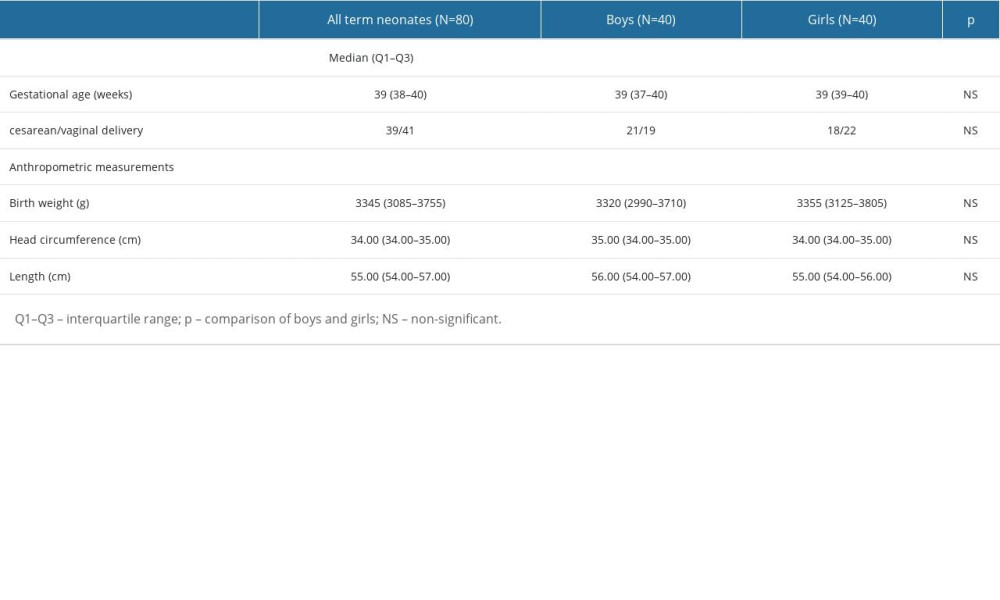 Table 3. The concentrations of the assessed biomarkers and the values of the biomarker/Cr ratios.
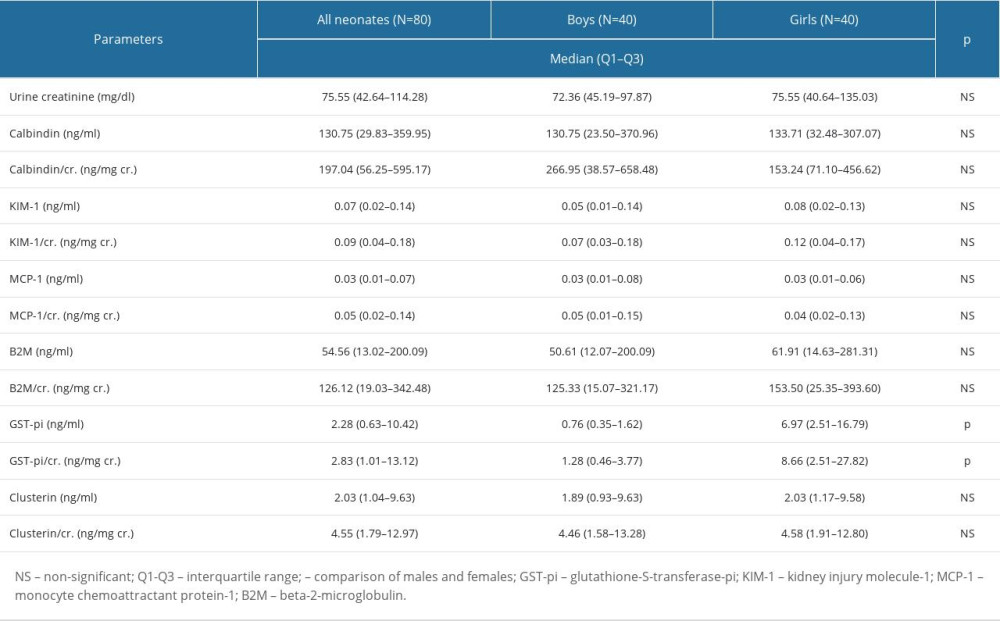 Table 4. The biomarkers’ concentrations and the values of the biomarker/Cr ratios in the cesarean- and vaginal-born neonates.
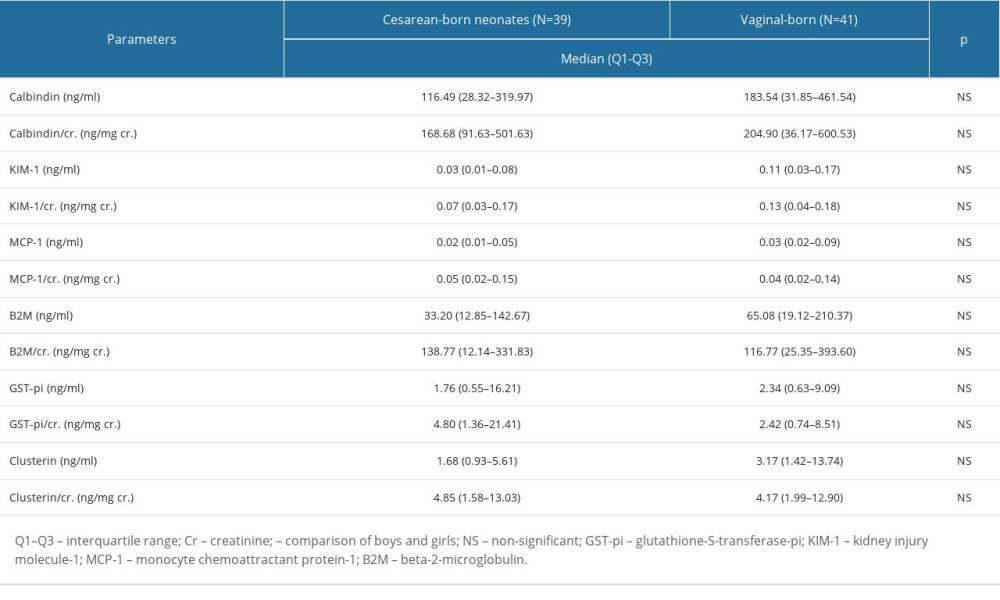 Table 5. Mean and 95% confidence interval (CI) for the biomarkers’ concentrations and the values of the biomarker/Cr ratios.
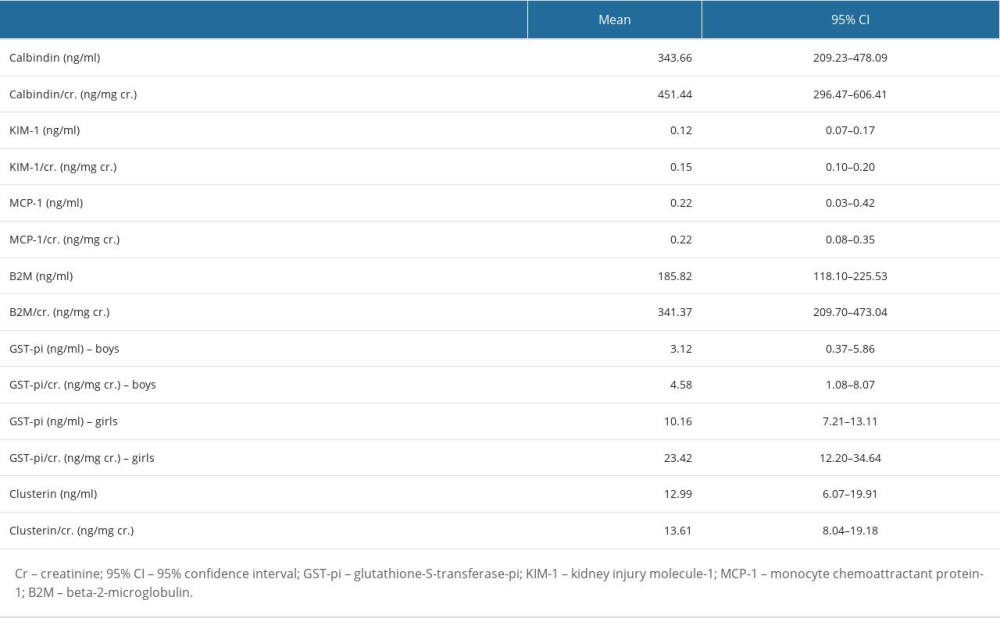 Table 6. The correlations between the biomarker/Cr ratios.
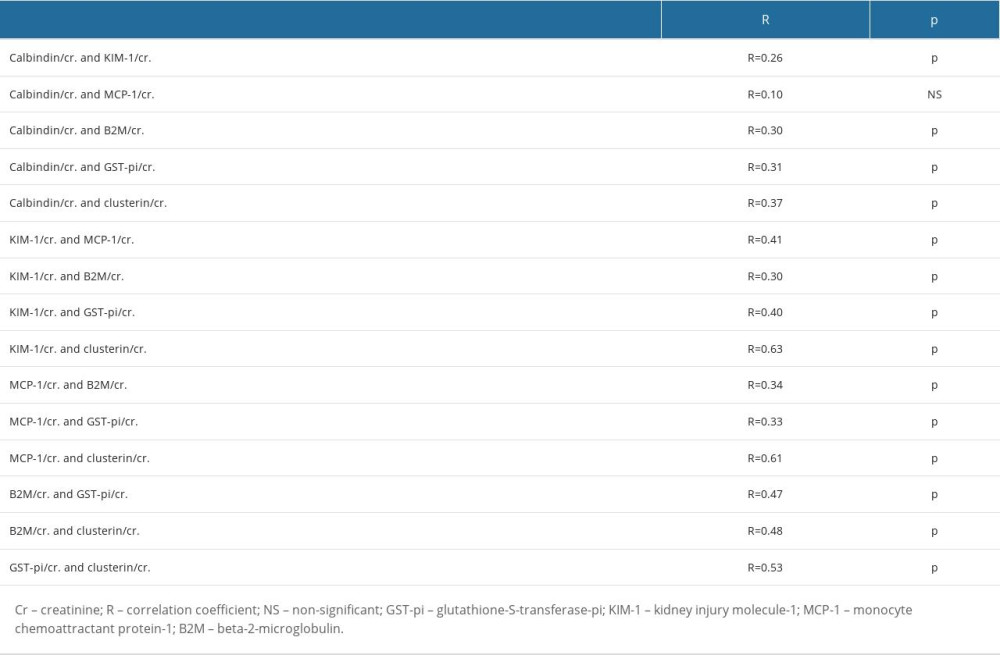 Table 7. The 95% reference intervals for all biomarker/Cr ratios.
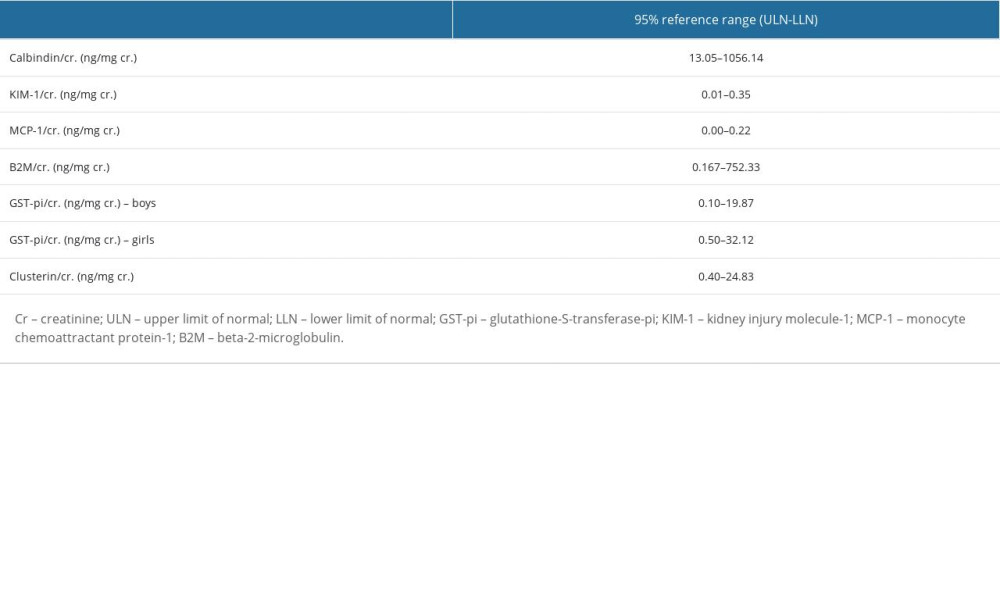 Table 8. Studies concerning urinary calbindin, clusterin, glutathione-S-transferase-pi (GST-pi); kidney injury molecule-1 (KIM-1); monocyte chemoattractant protein-1 (MCP-1); beta-2-microglobulin (B2M).
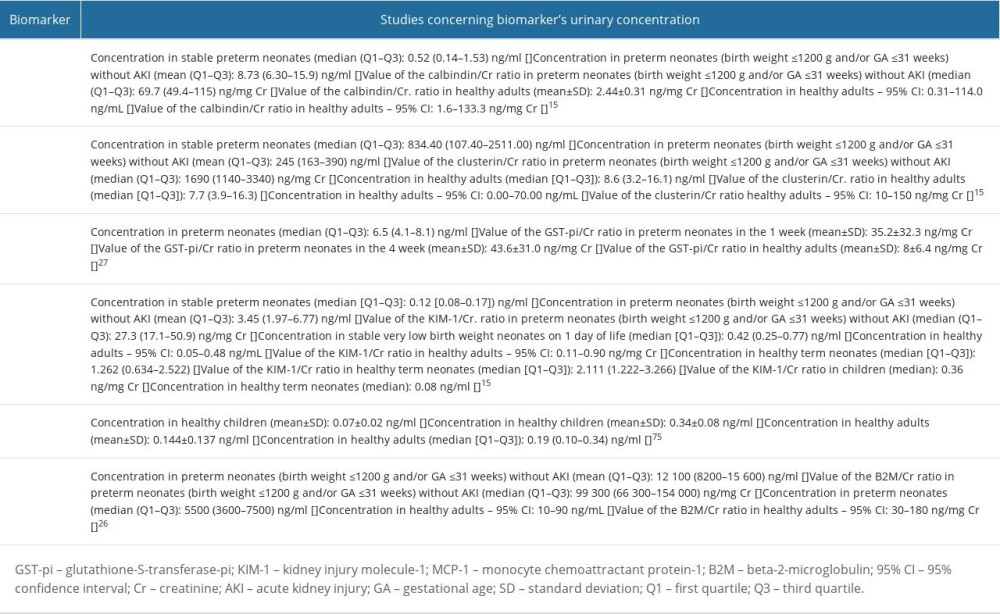
References
1. Walker MW, Clark RH, Spitzer AR, Elevation in plasma creatinine and renal failure in premature neonates without major anomalies: Terminology, occurrence and factors associated with increased risk: J Perinatol, 2011; 31(3); 199-205
2. Thayyil S, Sheik S, Kempley ST, Sinha A, A gestation- and postnatal age-based reference chart for assessing renal function in extremely premature infants: J Perinatol, 2008; 28(3); 226-29
3. Jetton JG, Boohaker LJ, Sethi SK, Incidence and outcomes of neonatal acute kidney injury (AWAKEN): A multicentre, multinational, observational cohort study: Lancet Child Adolesc Health, 2017; 1(3); 184-94
4. Starr MC, Kula A, Lieberman J, The impact of increased awareness of acute kidney injury in the Neonatal Intensive Care Unit on acute kidney injury incidence and reporting: Results of a retrospective cohort study: J Perinatol, 2020; 40(9); 1301-7
5. Coleman C, Tambay Perez A, Selewski DT, Neonatal acute kidney injury: Front Pediatr, 2022; 10; 842544
6. Carmody JB, Swanson JR, Rhone ET, Recognition and reporting of AKI in very low birth weight infants: Clin J Am Soc Nephrol, 2014; 9(12); 2036-43
7. Momtaz HE, Sabzehei MK, Rasuli B, The main etiologies of acute kidney injury in the newborns hospitalized in the neonatal intensive care unit: J Clin Neonatol, 2014; 3(2); 99-102
8. Chaturvedi S, Ng KH, Mammen C, The path to chronic kidney disease following acute kidney injury: A neonatal perspective: Pediatr Nephrol, 2017; 32(2); 227-41
9. Stevens LA, Coresh J, Greene T, Assessing kidney function – measured and estimated glomerular filtration rate: N Engl J Med, 2006; 354(23); 2473-83
10. Guignard JP, Drukker A, Why do newborn infants have a high plasma creatinine?: Pediatrics, 1999; 103(4); e49
11. Mak RH, Abitbol CL, Standardized urine biomarkers in assessing neonatal kidney function: are we there yet?: J Pediatr (Rio J), 2021; 97(5); 476-77
12. Kuo J, Akison LK, Chatfield MD, Serum and urinary biomarkers to predict acute kidney injury in premature infants: a systematic review and meta-analysis of diagnostic accuracy: J Nephrol, 2022; 35(8); 2001-14
13. Charlton J, Guillet R, Neonatal acute kidney injury: Diagnosis, exposures, and long-term outcomes: Neoreviews, 2018; 19; e322-36
14. Capelli I, Vitali F, Zappulo F, Biomarkers of kidney injury in very-low-birth-weight preterm infants: Influence of maternal and neonatal factors: In Vivo, 2020; 34(3); 1333-39
15. Correa LP, Marzano ACS, Silva Filha R, Biomarkers of renal function in preterm neonates at 72h and 3 weeks of life: J Pediatr (Rio J), 2021; 97(5); 508-13
16. Zhang Y, Zhang B, Wang D, Evaluation of novel biomarkers for early diagnosis of acute kidney injury in asphyxiated full-term newborns: A case-control study: Med Princ Pract, 2020; 29(3); 285-91
17. Kim MJ, Tam FW, Urinary monocyte chemoattractant protein-1 in renal disease: Clin Chim Acta, 2011; 412(23–24); 2022-30
18. Wasilewska A, Taranta-Janusz K, Kuroczycka-Saniutycz E, Urinary OPN excretion in children with glomerular proteinuria: Adv Med Sci, 2011; 56(2); 193-99
19. Kamianowska M, Kamianowska A, Wasilewska A, Urinary levels of kidney injury molecule-1 (KIM-1) and interleukin-18 (IL-18) in children and adolescents with hyperuricemia: Adv Med Sci, 2023; 68(1); 79-85
20. Kamianowska M, Szczepański M, Krukowska A, Urinary levels of cathepsin B in preterm newborns: J Clin Med, 2021; 10(18); 4254
21. DeFreitas MJ, Seeherunvong W, Katsoufis CP, Longitudinal patterns of urine biomarkers in infants across gestational ages: Pediatr Nephrol, 2016; 31(7); 1179-88
22. Miklaszewska M, Korohoda P, Drożdż D, eGFR values and selected renal urine biomarkers in preterm neonates with uncomplicated clinical course: Adv Clin Exp Med, 2019; 28(12); 1657-66
23. Askenazi DJ, Halloran BA, Heagerty PJ, Urine acute kidney injury biomarkers in extremely low gestational age neonates: A nested case control study of 21 candidate urine biomarkers: Pediatr Nephrol, 2023; 38(4); 1329-42
24. Askenazi DJ, Koralkar R, Levitan EB, Baseline values of candidate urine acute kidney injury biomarkers vary by gestational age in premature infants: Pediatr Res, 2011; 70; 302-6
25. Hoffman SB, Massaro AN, Soler-García AA, A novel urinary biomarker profile to identify acute kidney injury (AKI) in critically ill neonates: A pilot study: Pediatr Nephrol, 2013; 28(11); 2179-88
26. Askenazi DJ, Koralkar R, Patil N, Acute kidney injury urine biomarkers in very low-birth-weight infants: Clin J Am Soc Nephrol, 2016; 11(9); 1527-35
27. Tabel Y, Oncül M, Elmas AT, Evaluation of renal functions in preterm infants with respiratory distress syndrome: J Clin Lab Anal, 2014; 28(4); 310-14
28. Tsukahara H, Toyo-Oka M, Kanaya Y, Quantitation of glutathione S transferase-pi in the urine of preterm neonates: Pediatr Int, 2005; 47(5); 528-31
29. Unal ET, Ozer EA, Kahramaner Z, Value of urinary kidney injury molecule-1 levels in predicting acute kidney injury in very low birth weight preterm infants: J Int Med Res, 2020; 48(12); 300060520977442
30. Kamianowska M, Szczepański M, Kulikowska EE, Do serum and urinary concentrations of kidney injury molecule-1 in healthy newborns depend on birth weight, gestational age or gender?: J Perinatol, 2017; 37(1); 73-76
31. Bennett MR, Nehus E, Haffner C, Pediatric reference ranges for acute kidney injury biomarkers: Pediatr Nephrol, 2015; 30(4); 677-85
32. Lee CT, Ng HY, Lee YT, The role of calbindin-D28k on renal calcium and magnesium handling during treatment with loop and thiazide diuretics: Am J Physiol Renal Physiol, 2016; 310(3); F230-F36
33. George B, Szilagyi JT, Joy MS, Regulation of renal calbindin expression during cisplatin-induced kidney injury: J Biochem Mol Toxicol, 2022; 36(7); e23068
34. Hasegawa S, Kato K, Takashi M, Increased levels of calbindin-D in serum and urine from patients treated by extracorporeal shock wave lithotripsy: J Urol, 1993; 149(6); 1414-18
35. Da Y, Akalya K, Murali T, Serial quantification of urinary protein biomarkers to predict drug-induced acute kidney injury: Curr Drug Metab, 2019; 20(8); 656-64
36. Guo J, Guan Q, Liu X, Relationship of clusterin with renal inflammation and fibrosis after the recovery phase of ischemia-reperfusion injury: BMC Nephrol, 2016; 17(1); 133
37. Zhou W, Guan Q, Kwan CC, Loss of clusterin expression worsens renal ischemia-reperfusion injury: Am J Physiol Renal Physiol, 2010; 298(3); F568-78
38. Zhang YJ, Zhang AQ, Zhao XX, Nicorandil protects against ischaemia-reperfusion injury in newborn rat kidney: Pharmacology, 2013; 92(5–6); 245-56
39. Laborde E, Glutathione transferases as mediators of signaling pathways involved in cell proliferation and cell death: Cell Death Differ, 2010; 17(9); 1373-80
40. Harrison DJ, Kharbanda R, Cunningham DS, Distribution of glutathione S-transferase isoenzymes in human kidney: Basis for possible markers of renal injury: J Clin Pathol, 1989; 42(6); 624-28
41. Katou S, Globke B, Morgul MH, Urinary biomarkers α-GST and π-GST for evaluation and monitoring in living and deceased donor kidney grafts: J Clin Med, 2019; 8(11); 1899
42. Feinfeld DA, Fleischner GM, Arias IM, Urinary ligandin and glutathione-S-transferase in gentamicin-induced nephrotoxicity in the rat: Clin Sci (Lond), 1981; 61(1); 123-25
43. Vasieva O, The many faces of glutathione transferase pi: Curr Mol Med, 2011; 11(2); 129-39
44. Polak WP, Kosieradzki M, Kwiatkowski A, Activity of glutathione S-transferases in the urine of kidney transplant recipients during the first week after transplantation: Ann Transplant, 1999; 4(1); 42-45
45. Lembo C, Buonocore G, Perrone S, Oxidative stress in preterm newborns: Antioxidants (Basel), 2021; 10(11); 1672
46. Tain YL, Hsu CN, Perinatal oxidative stress and kidney health: Bridging the gap between animal models and clinical reality: Antioxidants (Basel), 2022; 12(1); 13
47. Ichimura T, Asseldonk EJ, Humphreys BD, Kidney injury molecule-1 is a phosphatidylserine receptor that confers a phagocytic phenotype on epithelial cells: J Clin Invest, 2008; 118(5); 1657-68
48. Bonventre JV, Kidney injury molecule-1 (KIM-1): A urinary biomarker and much more: Nephrol Dial Transplant, 2009; 24(11); 3265-68
49. Sharfuddin AA, Molitoris BA, Pathophysiology of ischemic acute kidney injury: Nat Rev Nephrol, 2011; 7(4); 189-200
50. Tam FWK, Ong ACM, Renal monocyte chemoattractant protein-1: An emerging universal biomarker and therapeutic target for kidney diseases?: Nephrol Dial Transplant, 2020; 35(2); 198-203
51. Haller H, Bertram A, Nadrowitz F, Monocyte chemoattractant protein-1 and the kidney: Curr Opin Nephrol Hypertens, 2016; 25(1); 42-49
52. Rabb H, Griffin MD, McKay DB, Inflammation in AKI: Current understanding, key questions, and knowledge gaps: J Am Soc Nephrol, 2016; 27(2); 371-79
53. Wibell L, The serum level and urinary excretion of beta2-microglobulin in health and renal disease: Pathol Biol (Paris), 1978; 26(6); 295-301
54. Puthiyottil D, Priyamvada PS, Kumar MN, Role of urinary beta 2 microglobulin and kidney injury molecule-1 in predicting kidney function at one year following acute kidney injury: Int J Nephrol Renovasc Dis, 2021; 14; 225-34
55. Hall AM, de Seigneux S, Metabolic mechanisms of acute proximal tubular injury: Pflugers Arch, 2022; 474(8); 813-27
56. Koyner JL, Vaidya VS, Bennett MR, Urinary biomarkers in the clinical prognosis and early detection of acute kidney injury: Clin J Am Soc Nephrol, 2010; 5(12); 2154-65
57. Waikar SS, Sabbisetti VS, Bonventre JV, Normalization of urinary biomarkers to creatinine during changes in glomerular filtration rate: Kidney Int, 2010; 78(5); 486-94
58. Mishra P, Pandey CM, Singh U, Descriptive statistics and normality tests for statistical data: Ann Card Anaesth, 2019; 22(1); 67-72
59. Hart A, Mann-Whitney test is not just a test of medians: differences in spread can be important: BMJ, 2001; 323(7309); 391-93
60. McHugh ML, The chi-square test of independence: Biochem Med (Zagreb), 2013; 23(2); 143-49
61. Mukaka MM, Statistics corner: A guide to appropriate use of correlation coefficient in medical research: Malawi Med J, 2012; 24(3); 69-71
62. Hazra A, Using the confidence interval confidently: J Thorac Dis, 2017; 9(10); 4125-30
63. Horn PS, Pesce AJ, Copeland BE, A robust approach to reference interval estimation and evaluation: Clin Chem, 1998; 44(3); 622-31
64. Nahm FS, Nonparametric statistical tests for the continuous data: The basic concept and the practical use: Korean J Anesthesiol, 2016; 69(1); 8-14
65. Takashi M, Zhu Y, Miyake K, Urinary 28-kD calbindin-D as a new marker for damage to distal renal tubules caused by cisplatin-based chemotherapy: Urol Int, 1996; 56(3); 174-79
66. Brott DA, Adler SH, Arani R, Characterization of renal biomarkers for use in clinical trials: biomarker evaluation in healthy volunteers: Drug Des Devel Ther, 2014; 8; 227-37
67. Liu L, Dunn ST, Christakos S, Calbindin-D28k gene expression in the developing mouse kidney: Kidney Int, 1993; 44(2); 322-30
68. Chen ML, Boltz M, Christakos S, Age-related alterations in calbindin-D28K induction by 1,25-dihydroxyvitamin D3 in primary cultures of rat renal tubule cells: Endocrinology, 1992; 130(6); 3295-300
69. Wang X, Bhutani G, Vaughan LE, Urinary monocyte chemoattractant protein 1 associated with calcium oxalate crystallization in patients with primary hyperoxaluria: BMC Nephrol, 2020; 21(1); 133
70. Dvergsten J, Manivel JC, Correa-Rotter R, Expression of clusterin in human renal diseases: Kidney Int, 1994; 45(3); 828-35
71. Baum M, Neonatal nephrology: Curr Opin Pediatr, 2016; 28(2); 170-72
72. von Scholten BJ, Theilade S, Lajer M, Urinary alpha- and pi-glutathione s-transferases in adult patients with type 1 diabetes: Nephron Extra, 2014; 4(2); 127-33
73. Wang L, Ahn YJ, Asmis R, Sexual dimorphism in glutathione metabolism and glutathione-dependent responses: Redox Biol, 2020; 31; 101410
74. Zwiers AJ, de Wildt SN, de Rijke YB, Reference intervals for renal injury biomarkers neutrophil gelatinase-associated lipocalin and kidney injury molecule-1 in young infants: Clin Chem Lab Med, 2015; 53(8); 1279-89
75. Wang J, Ying Q, Zhong S, Elevated urinary monocyte chemoattractant protein-1 levels in children with Henoch-Schonlein purpura nephritis: Pediatr Neonatol, 2018; 59(3); 238-43
76. Sadeghi-Bojd S, Alijani E, Mahdavian M, Mean urinary cytokine MCP-1 in children with urinary tract obstruction and healthy children: nephro-urology monthly, 2018; 10(2); e63607
77. Mirfeizi Z, Mahmoudi M, Naghibi M, Urine monocyte chemoattractant protein-1 (UMCP-1) as a biomarker of renal involvement in systemic lupus erythematosus: Iran J Basic Med Sci, 2012; 15(6); 1191-95
78. Yousefzadeh MJ, Schafer MJ, Noren Hooten N, Circulating levels of monocyte chemoattractant protein-1 as a potential measure of biological age in mice and frailty in humans: Aging Cell, 2018; 17(2); e12706
79. Zhu Y, Tchkonia T, Pirtskhalava T, The Achilles’ heel of senescent cells: From transcriptome to senolytic drugs: Aging Cell, 2015; 14(4); 644-58
80. Askenazi DJ, Ambalavanan N, Goldstein SL, Acute kidney injury in critically ill newborns: What do we know? What do we need to learn?: Pediatr Nephrol, 2009; 24(2); 265-74
Tables
Table 1. The characteristics of the immunoassays used to measure the concentrations of the biomarkers.Table 2. The characteristics of the newborns taking part in the research.Table 3. The concentrations of the assessed biomarkers and the values of the biomarker/Cr ratios.Table 4. The biomarkers’ concentrations and the values of the biomarker/Cr ratios in the cesarean- and vaginal-born neonates.Table 5. Mean and 95% confidence interval (CI) for the biomarkers’ concentrations and the values of the biomarker/Cr ratios.Table 6. The correlations between the biomarker/Cr ratios.Table 7. The 95% reference intervals for all biomarker/Cr ratios.Table 8. Studies concerning urinary calbindin, clusterin, glutathione-S-transferase-pi (GST-pi); kidney injury molecule-1 (KIM-1); monocyte chemoattractant protein-1 (MCP-1); beta-2-microglobulin (B2M).Table 1. The characteristics of the immunoassays used to measure the concentrations of the biomarkers.Table 2. The characteristics of the newborns taking part in the research.Table 3. The concentrations of the assessed biomarkers and the values of the biomarker/Cr ratios.Table 4. The biomarkers’ concentrations and the values of the biomarker/Cr ratios in the cesarean- and vaginal-born neonates.Table 5. Mean and 95% confidence interval (CI) for the biomarkers’ concentrations and the values of the biomarker/Cr ratios.Table 6. The correlations between the biomarker/Cr ratios.Table 7. The 95% reference intervals for all biomarker/Cr ratios.Table 8. Studies concerning urinary calbindin, clusterin, glutathione-S-transferase-pi (GST-pi); kidney injury molecule-1 (KIM-1); monocyte chemoattractant protein-1 (MCP-1); beta-2-microglobulin (B2M). In Press
12 Mar 2024 : Clinical Research
Comparing Neuromuscular Blockade Measurement Between Upper Arm (TOF Cuff®) and Eyelid (TOF Scan®) Using Miv...Med Sci Monit In Press; DOI: 10.12659/MSM.943630
11 Mar 2024 : Clinical Research
Enhancement of Frozen-Thawed Human Sperm Quality with Zinc as a Cryoprotective AdditiveMed Sci Monit In Press; DOI: 10.12659/MSM.942946
12 Mar 2024 : Database Analysis
Risk Factors of Age-Related Macular Degeneration in a Population-Based Study: Results from SHIP-TREND-1 (St...Med Sci Monit In Press; DOI: 10.12659/MSM.943140
12 Mar 2024 : Clinical Research
Preoperative Blood Transfusion Requirements for Hemorrhoidal Severe Anemia: A Retrospective Study of 128 Pa...Med Sci Monit In Press; DOI: 10.12659/MSM.943126
Most Viewed Current Articles
17 Jan 2024 : Review article
Vaccination Guidelines for Pregnant Women: Addressing COVID-19 and the Omicron VariantDOI :10.12659/MSM.942799
Med Sci Monit 2024; 30:e942799
14 Dec 2022 : Clinical Research
Prevalence and Variability of Allergen-Specific Immunoglobulin E in Patients with Elevated Tryptase LevelsDOI :10.12659/MSM.937990
Med Sci Monit 2022; 28:e937990
16 May 2023 : Clinical Research
Electrophysiological Testing for an Auditory Processing Disorder and Reading Performance in 54 School Stude...DOI :10.12659/MSM.940387
Med Sci Monit 2023; 29:e940387
01 Jan 2022 : Editorial
Editorial: Current Status of Oral Antiviral Drug Treatments for SARS-CoV-2 Infection in Non-Hospitalized Pa...DOI :10.12659/MSM.935952
Med Sci Monit 2022; 28:e935952