03 February 2024: Clinical Research
Impaired Capillary Recruitment Capacity in Obesity: A Subgroup Analysis of Prospective Observational Study on Anesthesia Effects
Soeun JeonDOI: 10.12659/MSM.943036
Med Sci Monit 2024; 30:e943036


Abstract
BACKGROUND: This subgroup analysis of prospective observational research, involving 71 participants, compared the effects of anesthesia on microvascular reactivity in obese vs lean individuals using near-infrared spectroscopy and vascular occlusion tests. The correlation between the body mass index (BMI) and microvascular reactivity under general anesthesia was also investigated.
MATERIAL AND METHODS: This study enrolled adult patients classified as American Society of Anesthesiologists physical status I or II, undergoing elective surgery under general anesthesia. The microcirculatory variables measured before (Tpre) and 30 min following the induction of anesthesia (Tpost) were as follows: baseline tissue oxygen saturation (StO₂), occlusion slope (∇occl), and recovery slope (∇recov). The patients were grouped according to their BMI (lean [BMI <25 kg/m²] vs obese [BMI ≥25 kg/m²]). Data are presented as medians and interquartile ranges.
RESULTS: There were 43 patients in the lean group and 28 in the obese group. At Tpre, baseline StO2, ∇occl, and ∇recov were not different between the 2 groups (P=0.860, 0.659, and 0.518, respectively). At Tpost, the baseline StO₂ and ∇occl were not different between the 2 groups (P=0.343 and 0.791); however, the ∇recov was lower in the obese group than in the lean group (3.245 [2.737, 3.977] vs 4.131 [3.491, 4.843], P=0.003). At Tpost, BMI showed a moderate correlation with ∇recov (correlation coefficient: -0.319, P=0.007).
CONCLUSIONS: In obese patients, capillary recruitment capacity during general anesthesia is compromised compared to lean patients.
Keywords: Anesthesia, General, Microcirculation, Microvessels, Obesity
Background
Obesity independently predicts surgical and anesthetic difficulties and perioperative morbidity and mortality [1,2]. In individuals with obesity, excess adipose tissue increases metabolic demands and alters macrohemodynamic parameters, including heightened adrenergic activity, high blood volume, increased cardiac output, and higher arterial pressure [3]. Moreover, obesity impairs microcirculation, potentially causing alterations in microvascular structure and function, along with hemorheological abnormalities [3].
To guarantee the sufficient delivery of nutrients to tissues – a determinant of cellular viability – both macro- and microcirculatory systems must function optimally [3,4]. Given the limited availability of monitoring tools for assessing microcirculation, the predominant focus of perioperative hemodynamic management has been the enhancement of microcirculatory parameters [4]. Macrohemodynamic parameters should be considered indicators of tissue perfusion, not measurements. Even when macrocirculatory indicators are within the standard range, the potential for undetected microcirculatory dysfunction remains [4].
Within the context of microcirculatory function analysis, parameters dynamically ascertained through alterations in tissue oxygen saturation (StO2), as derived from near-infrared spectroscopy (NIRS) during temporary occlusion of blood flow (vascular occlusion tests [VOTs]), are preferred because of their noninvasiveness, cost-effectiveness, and high reproducibility [4–6]. NIRS provides continuous StO2 measurements by exploiting the different absorption frequencies of oxygenated and deoxygenated hemoglobin [7]. NIRS specifically monitors blood vessels with a diameter smaller than 1 mm, such as arterioles, capillaries, and venules, as it is less likely for photons to emerge effectively in larger arteries and veins with high blood concentration [8]. During VOT, the downslope gradient of StO2 during blood occlusion (the occlusion slope) represents metabolic demand and oxygen extraction, whereas the upslope gradient of StO2 during reperfusion following deflation (recovery slope) reflects microvascular reactivity during reperfusion [6]. Numerous clinical studies have shown that critically ill patients and those undergoing major surgery typically experience both tissue hypoperfusion and a decline in microvascular reactivity [6,8–12]. Notably, previous clinical research has suggested that VOT-derived microcirculatory parameters may offer better insight into postoperative clinical outcomes compared to conventional macrohemodynamic parameters [12]. While there has been extensive research into the effects of obesity on perioperative macrohemodynamics and clinical outcomes, investigations into the impact of obesity on perioperative microhemodynamics remain limited.
Therefore, the primary aim of the present prospective observational subgroup analysis was to evaluate differences in the effects of general anesthesia on microvascular reactivity in obese vs lean individuals using NIRS with the VOT. The secondary aim was to investigate the correlation between body mass index (BMI) and microvascular reactivity under general anesthesia.
Material and Methods
ETHICS AND STUDY SUBJECTS:
The present study was conducted as a subgroup analysis of a prospective observational study (approved by the Institutional Review Board of Pusan National University Hospital [IRB no. 1804-025-066], on May 25, 2018); this subgroup analysis also received approval from the identical institution’s Institutional Review Board (IRB no. 2303-024-125, on April 3, 2023). Patients scheduled for elective surgery under general anesthesia between June 2018 and February 2021 at Pusan National University Hospital were screened. The exclusion criteria were as follows: age <18 years, American Society of Anesthesiologists (ASA) physical status of ≥III, presence of a neuraxial block, uncontrolled hypertension (defined as systolic blood pressure [SBP] >180 mmHg or diastolic blood pressure [DBP] >110 mmHg) immediately before anesthesia induction [13], major cardiovascular disease (defined as implanted pacemaker, left ventricle ejection fraction <40%, and history of coronary artery disease and cerebrovascular accident), diabetes, pregnancy, smoking history of >10 pack-years, chronic obstructive or restrictive pulmonary disease (defined as having a documented diagnosis in the medical records or being diagnosed through preoperative pulmonary function tests), and peripheral vascular disease or chronic venous insufficiency. To differentiate and rule out peripheral vascular disease, the ankle–brachial index (ABI) was measured on the day before surgery. In accordance with World Health Organization recommendations for Asian and South Asian populations [14–16], patient data were categorized into 2 groups based on BMI: lean (BMI <25 kg/m2) and obese (BMI ≥25 kg/m2).
ANESTHETIC MANAGEMENT:
All patients received standard operating room monitoring (electrocardiography, pulse oximetry [SpO2], noninvasive blood pressure [NIBP], esophageal stethoscope temperature, end-tidal carbon dioxide concentration [EtCO2], bispectral index [BIS], and train-of-four measurements). Anesthesia was induced with propofol bolus (1.5 mg/kg), remifentanil target-controlled infusion (3 ng/mL; effect–site concentration [Ce], based on the Minto model), and rocuronium bolus (0.8 mg/kg). After intubation, desflurane (5% vol) and remifentanil (0.5 ng/mL; Ce) were continuously infused until completion of the vascular occlusion tests. During mechanical ventilation, an inspired oxygen fraction of 0.4 and a tidal volume of 8 mL/kg were delivered, and the respiratory rate was regulated to maintain EtCO2 between 30 and 40 mmHg. Plasma Solution A (HK inno.N, Cheongju-si, Chungcheongbuk-do, Korea) was administered at a rate of 2 mL/kg/h throughout the study period.
MICROCIRCULATORY FUNCTION ASSESSMENT:
Microvascular reactivity was evaluated by assessing the changes in StO2, measured through NIRS during the VOTs [6]. VOT and StO2 measurements were conducted twice for each patient, once before (Tpre) and again 30 min after the induction of general anesthesia (Tpost). At Tpre, a dynamic NIRS (INVOS™ 5100C Regional Oximeter; Medtronic, Minneapolis, MN, USA) sensor was positioned on the thenar eminence, and the ipsilateral upper arm was wrapped in an automated tourniquet (Zimmer ATS 3000 Tourniquet System; Zimmer Inc., Warsaw, IL, USA).
Once a stable baseline StO2 was achieved, VOT was performed with continuous StO2 measurements: (1) the automated tourniquet was inflated to 50 mmHg over the patient’s baseline SBP (NIBP from the contralateral upper arm) and held for 3 min (the ischemic period), and (2) subsequently, the tourniquet was promptly deflated to 0 mmHg (the reperfusion period). At Tpre, 5 L/min of oxygen was delivered via a nasal cannula to maintain an inspired oxygen fraction (0.4) comparable to Tpost.
Figure 1 illustrates the parameters for assessing each microcirculatory function. Microcirculatory parameters derived from StO2 during VOT at Tpre and Tpost: baseline StO2, minimum StO2 during the ischemic period, maximum StO2 during the reperfusion period, time to reach baseline StO2 from deflation, occlusion slope (∇occl, slope of StO2 descent to the lowest value during tourniquet inflation), recovery slope (∇recov, slope from the minimum to baseline StO2 during tourniquet deflation), and percentage change from Tpre ([Tpost–Tpre]/Tpre [%]).
The specific calculation equations for ∇occl and ∇recov are detailed below:
A laser infrared thermometer (LaserGrip 800; Etekcity, Anaheim, CA, USA) was used to measure skin temperature at the thenar eminence applied with an NIRS sensor at Tpre and Tpost. The patient maintained a supine position throughout VOT. The dropout criteria were participants who were unable to complete the VOT because of (1) recording errors and (2) the use of rescue medications as a response to hemodynamic instability: ephedrine (5–10 mg) for hypotension (20% reduction in SBP from baseline), atropine (0.5 mg) for bradycardia (HR < 45 bpm), and esmolol (10 mg) for tachycardia (HR >130 bpm).
ASSESSMENT OF OUTCOMES:
The study collected the following variables: (1) baseline patient characteristics – age, sex, height, weight, ASA physical status classification, comorbidities, ABI, and type of surgery. Surgery was classified into 2 categories: abdominal surgery (by department of gastrointestinal surgery and gynecology) and head and neck surgery (by department of otorhinolaryngology, dental, and plastic surgery); no other surgical procedures were conducted; (2) preoperative laboratory findings (within 1 week before surgery) – hemoglobin, glucose, liver and renal function tests, and electrolyte; (3) vital-sign parameters – SpO2, NIBP, heart rate, and EtCO2; and (4) microcirculatory parameters derived from StO2 during VOT at Tpre and Tpost (Figure 1).
STATISTICAL ANALYSIS:
All analyses were performed using IBM SPSS Statistics version 25 (IBM Corporation, Armonk, NY, USA) and MedCalc version18.11.6 (MedCalc Software bvba, Ostend, Belgium). Continuous variables are presented as mean±standard deviation (SD) for parametric distributions, and as median with the first and third interquartiles (Q1 and Q3) or Hodges-Lehmann median difference (HLMD) with 95% confidence interval (95% CI) for nonparametric distributions. Categorical data are presented as a number and percentage. Following the normality test, parametric data were analyzed using an independent t test, whereas nonparametric data were analyzed using the Mann-Whitney U test. To analyze the interaction between time and group for the nonparametric, repeatedly measured StO2 values, an aligned rank-transformed repeated-measures analysis of variance (ART-RMANOVA) was conducted using ARTool (version 1.6.2; University of Washington; https://depts.washington.edu/acelab/proj/art/) [17]. To compare the parameters before (Tpre) and after (Tpost) anesthesia induction, a Wilcoxon signed-rank test was conducted. For categorical data, the chi-squared test with Yates continuity correction was used for 2×2 contingency tables. Spearman’s correlation coefficient (ρ) was computed to assess the correlation between BMI and microcirculatory parameters. A correlation was categorized as weak when |ρ| <0.3, moderate when 0.3< |ρ| <0.7, and strong when |ρ| >0.7. Two-sided P values <0.05 were considered statistically significant.
Results
BASELINE CLINICAL PROFILES:
Of the 128 patients who underwent eligibility assessment, 41 were excluded because of diabetes (n=14), smoking history of >10 pack-years (n=18), and uncontrolled hypertension before anesthesia induction (n=9). Subsequently, 16 patients were unable to complete the VOT and dropped out of the study because of recording errors (n=6) and hemodynamic instability (n=10). Of the 71 patients included in the final sample, 43 (60.6%) and 28 (39.4%) were in the lean and obese groups, respectively (Figure 2). The patient’s baseline characteristics and preoperative laboratory findings are presented in Table 1. The 2 groups had comparable preoperative patient characteristics, laboratory findings, and ABIs, except for BMI (mean [SD], lean, 22.3 [1.5] kg/m2; obese, 27.6 [1.7] kg/m2, P<0.001).
THE IMPACT OF OBESITY ON MICROCIRCULATION DURING GENERAL ANESTHESIA:
StO2 changes during the VOT at Tpre and Tpost for the lean and obese groups are displayed in Figure 3. ART-RMANOVA was performed on repeatedly measured StO2 values. At Tpre, StO2 during VOT showed significant differences over time (P<0.001); however, no differences were found between the lean and obese groups (P=0.165), and the interaction between time and group was not statistically significant (P=0.997). At Tpost, StO2 during VOT showed significant differences over time (P<0.001) and between the lean and obese groups (P=0.006); however, the interaction between time and group was not statistically significant (P=0.853).
Table 2 displays microcirculatory parameters obtained from StO2 during VOT at Tpre and Tpost. In both Tpre and Tpost, no significant differences were noted between the 2 groups in terms of vital-sign parameters (SpO2, MBP, heart rate, EtCO2, and skin temperature). At Tpost, the baseline StO2, minimum StO2, maximum StO2, and ∇occl were not different between the 2 groups; and HLMD (95% CI) were as follows: baseline StO2 – 3.0 (−3.0, 8.0)%, P=0.343; minimum StO2 – 1.0 (−5.0, 8.0)%, P=0.625; maximum StO2 – 0.0 (0.0, 0.0)%, P=0.441; ∇occl – −0.006 (−0.028, 0.022)%/s, P=0.791. However, the obesity group demonstrated a longer time to reach baseline StO2 from deflation (HLMD [95% CI]: 1.6 [0.4, 2.7] s, P=0.008) and lower ∇recov (HLMD [95% CI]: −0.800 [−1.308, −0.287]%/s, P=0.003) than the lean group.
Percentage changes from Tpre in baseline StO2 (HLMD [95% CI]: 2.5 [−4.5, 8.8]%,
At Tpost, both lean and obese groups demonstrated high levels of baseline StO2 (HLMD [95% CI], lean: 4.8 [2.0, 7.5]%, P=0.001; obese: 6.5 [4.0, 9.5]%, P<0.001), minimum StO2 (HLMD [95% CI], lean: 9.5 [6.5, 12.0]%, P<0.001; obese: 12.0 [8.0, 16.0]%, P<0.001), and maximum StO2 (HLMD [95% CI], lean: 0.5 [0.0, 3.0]%, P=0.001; obese: 0.5 [0.0, 1.5]%, P=0.021) compared with those at Tpre. A reduction in ∇occl was observed in both the lean and obese groups at Tpost in comparison to Tpre (HLMD [95% CI], lean: −0.025 [−0.039, −0.008]%/s, P=0.001; obese: −0.033 [−0.053, −0.011]%, P=0.003; Figure 4A). In the lean group, no significant difference in ∇recov values was found between Tpre and Tpost (HLMD [95% CI]: −0.017 [−0.520, 0.472]%/s, P=0.894), whereas in the obese group, ∇recov decreased at Tpost compared with that at Tpre (HLMD [95% CI]: −1.057 [−1.433, −0.602]%/s, P<0.001; Table 2 and Figure 4B).
In both groups, MBP, ETCO2, and skin temperature decreased, whereas the heart rate increased after anesthesia induction. However, no significant differences were found between the 2 groups in terms of MBP, heart rate, ETCO2, and skin temperature, and all of these parameters remained within the normal range (Table 2) [18,19].
BMI AND MICROCIRCULATION CORRELATION:
Table 3 demonstrates a correlation between BMI and microcirculatory parameters obtained from StO2 during VOT at Tpre and Tpost. At Tpre, no significant correlations were observed between BMI and baseline StO2, minimum StO2, maximum StO2, time to reach baseline StO2 from deflation, ∇occl, and ∇recov (P=0.291, 0.529, 0.182, 0.940, 0.522, and 0.667, respectively). At Tpost, BMI did not significantly correlate with baseline StO2, minimum StO2, maximum StO2, or ∇occl (P=0.075, 0.457, 0.166, and 0.590); however, BMI did exhibit a moderate correlation with the time required for the return to baseline StO2 from deflation and ∇recov (ρ=0.329 and −0.319; P=0.005 and 0.007, respectively). The BMI also demonstrated weak and moderate correlations with the percentage changes from Tpre in time to reach baseline StO2 and ∇recov (ρ=0.258 and −0.316; P=0.030 and 0.007, respectively). As BMI increases, the time needed for the return to baseline StO2 increases, while ∇recov decreases. This pattern is also reflected in the percentage changes from Tpre.
POST HOC POWER ANALYSIS:
The primary objective of this study was to assess the difference in ∇recov at Tpost between the lean and obese groups with the Mann-Whitney U test. This study, comprising 43 participants in the lean group (∇recov, mean [SD]: 4.4 [1.5]) and 28 participants in the obese group (∇recov, mean [SD]: 3.5 [1.1]), achieved a post hoc power of 0.774 with an alpha value of 0.05 when calculated using G*Power (ver. 3.1.9.6; University of Düsseldorf, Düsseldorf, Germany).
Discussion
Our research highlights the increased vulnerability of microvascular reactivity to anesthetic effects in obese patients. In this study, the effects of general anesthesia on microcirculation differed between the lean and obese groups. Metabolic demand, as determined by the decrease in StO2 during the ischemic period, did not differ between the lean and obese groups either before or after anesthesia induction. However, under general anesthesia, metabolic demand was notably reduced in both groups. Capillary recruitment capacity, as quantified by the increase in StO2 during reperfusion following vascular occlusion, showed no significant difference between the lean and obese groups before anesthesia induction. However, during anesthesia, the obese group exhibited a lower recovery slope than the lean group. Microvascular reactivity was reduced under general anesthesia only in the obese group, with no effect observed in the lean group. After anesthesia induction, a moderate negative correlation was observed between the BMI and recovery slope, whereas no correlation was found before anesthesia induction.
Although the obese subjects had a higher total energy expenditure than the lean subjects, no differences in minimum StO2 and occlusion slope related to metabolic demand were observed between the lean and obese groups, either before or after anesthesia induction [2]. Similarly, the percentage changes in minimum StO2 and occlusion slope from the preanesthetic state were not different between the 2 groups. However, when adjusted for the body surface area, the basal metabolic rate of the obese individuals was “normal” [2]. In essence, given that an increase in body weight corresponds to an increase in the body surface area, the basal metabolic rate and absolute oxygen consumption in the obese individuals could be elevated compared with their lean counterparts. However, the metabolic demand per unit of the surface area is consistent regardless of the obesity status [2].
In this study, the microcirculation indices were derived from StO2 measurements conducted within a consistent area via a NIRS sensor. Consequently, the metabolic demand derived through NIRS in conjunction with VOT can be considered to reflect the metabolic rate per unit surface area instead of the total metabolic rate of the patient. The results of this study also support this interpretation. Likewise, in their investigations employing NIRS coupled with VOT, Soares et al did not find a significant difference in the minimum StO2 levels and occlusion slope between the obese and lean groups [20,21]. In our previous research conducted on healthy adult patients, general anesthesia decreased metabolic demand and improved the occlusion slope across all age groups [6]. In line with our previous study, the administration of general anesthetics reduced metabolic demand, and this trend remained consistent in both the lean and obese groups in the current research.
During the reperfusion phase after a brief ischemic event, the recovery slope serves as a surrogate marker indicative of the recruitment potential of the microvascular network [6,22]. Approximately 70% of capillaries within the microcirculatory system remain nonperfused under normal conditions [6,23]. However, under physiological challenges, these nonperfused capillaries have the potential to be activated, providing reserve perfusion facilitated by the precapillary sphincter and arteriolar dilation [6,23].
Although the clinical applicability and utility of NIRS-derived microcirculatory parameters have not been fully established [11], previous clinical research using these parameters has demonstrated a tendency for patients with diminished physiological reserves and those undergoing major surgery to experience both tissue hypoperfusion and a reduction in microvascular reactivity [6,8–12]. These impairments in the microcirculatory system have been linked to unfavorable clinical outcomes [8,10–12]. In our previous study, the impact of general anesthesia on microvascular recruitment potential was found to be age-dependent [6]. Specifically, the younger age group (< 65 years) demonstrated enhanced recovery slope and microvascular reactivity following general anesthesia, whereas these responses were not observed in the older age group (≥65 years). In an intensive care unit-based study, patients with septic conditions exhibited low StO2 levels and reduced recovery slope [8]. The extent of sepsis-induced microvascular alterations was found to be correlated with the severity of the septic disease, and these alterations were also associated with mortality rates. In trauma patients following initial resuscitation, Campos-Serra et al suggested that NIRS with a VOT could be helpful in identifying occult shock [10]. Trauma patients with occult shock had lower minimum StO2 levels compared to those who were hemodynamically stable. In pediatric cardiac surgery, a lower intraoperative minimum StO2 measured during VOT was associated with an increased risk of major perioperative adverse events [11]. In adult cardiac surgery, Kim et al found that postoperative morbidity was associated with a significantly lower recovery slope on postoperative day 1, despite no significant differences in conventional macrohemodynamic parameters between the groups with and without postoperative morbidity [12]. Additionally, a lower recovery slope on postoperative day 1 was an independent risk factor for prolonged hospital length-of-stay [12].
Anesthesia and perioperative complications are independently associated with obesity, which disrupts the macrohemodynamic system and leads to an increased risk of major cardiovascular events, surgical infections, and postoperative mortality, with these risks escalating as obesity rates rise [1–3,24]. Moreover, obesity renders microvascular reactivity vulnerable to stressful conditions beyond normal physiological states [20,25]. In this study, recovery slope reduction under general anesthesia was evident only in the obese group, with no effect observed in the lean group. The obese group had a reduced recovery slope compared with the lean group during general anesthesia. A moderate negative correlation was found between the BMI and recovery slope following general anesthesia induction. Similarly, Ohno et al serially measured the reactive hyperemia index in patients undergoing surgery under general anesthesia [25]. This index represents the ratio of reactive hyperemia-stimulated vasodilation at the finger following brachial artery clamp release to that of the unclamped contralateral finger. Although the reduction in reactive hyperemia index was comparable between the lean and obese groups immediately after surgery, the recovery of the reduced reactive hyperemia index was slower in the obese group than in the lean group. Soares et al conducted an investigation comparing microvascular reactivity in response to an acute hyperglycemic challenge between obese and lean individuals [20]. Microvascular reactivity was assessed using NIRS during VOT, and the area under the curve (AUC) of reactive hyperemia was quantified. The authors reported that lean subjects returned to baseline AUC levels during hyperemia 120 min after the hyperglycemic challenge, while obese individuals continued to exhibit inhibited recovery of AUC during hyperemia.
Numerous factors could contribute to the pathophysiological mechanism behind the association between obesity and microvascular dysfunction. Obesity leads to microvascular dysfunction by impairing endothelium-dependent nitric oxide (NO)-mediated arteriolar dilation [3,26]. NO assumes a pivotal role in 2 critical facets of the cardiovascular system: the preservation of vascular homeostasis and facilitation of proper arterial dilation [26]. After prolonged ischemic events, the cardiovascular response is modulated by prostaglandins or nervous system control [3]. However, the reactive hyperemia response following short-term ischemia is primarily regulated by NO [3]. In the obese group, the activation of endothelial oxidases (nicotinamide adenine dinucleotide phosphate [NADPH] oxidases and xanthine-oxidase) and adipokines (leptin, resistin, interleukin-6, and tumor necrosis factor-α) exacerbates the vascular production of reactive oxygen species [26]. Consequently, this cascade inhibits both NO synthesis and activity [26]. Obesity also promotes structural impairment of the microvasculature, resulting in capillary rarefaction characterized by a reduced density of capillaries [3]. In a clinical study involving human skeletal muscle biopsies, despite the absolute number of capillaries in skeletal muscles remaining consistent, a significant reduction in capillary density was observed in the skeletal muscle of the obese group compared with the lean group [27]. In obese patients, hemorheological abnormalities are an additional factor that restricts microcirculation [3]. In obesity, red blood cell deformability is reduced, which can impede blood flow through capillaries, and triglycerides can clump red blood cells, causing uneven flow within the capillary network [3].
This study has a few limitations. First, because of the inclusion criteria, only patients classified as ASA I or II were included, necessitating the exclusion of individuals with morbid obesity (BMI ≥40 kg/m2), who had ASA physical status ≥III [28]. This study independently evaluated the effect of BMI on microvascular reactivity under general anesthesia, excluding the influence of other obesity-associated comorbidities. Inevitably, patients who were morbidly obese had markedly increased risk of having concomitant comorbidities, such as type 2 diabetes (52.5%), hypertension (92.5%), cardiovascular disease (8.4%), asthma (20.9%), nonalcoholic fatty liver disease (1%), and others [29,30]. A study conducted through the National Health Register reported that patients who are morbidly obese have a 71.2% higher risk of experiencing 1 or more obesity-related comorbidities [30]. While our secondary outcome analysis revealed a moderate negative correlation between BMI and the recovery slope during general anesthesia, larger-scale studies are needed to evaluate microvascular reactivity under anesthesia in patients who are morbidly obese while adjusting for the effect of obesity-related comorbidities. Second, during general anesthesia, concomitant changes in vital signs can affect microcirculation parameters. However, in this study, all patients were in a maintained state of normothermia and normocapnia both before and after anesthesia induction [6,18,19]. Furthermore, post-anesthesia MBP was consistently maintained ≥60 mmHg for all patients, which likely provided sufficient perfusion pressure to facilitate peripheral autoregulation [6]. Moreover, the lean and obese groups had comparable vital-sign parameters (MBP, heart rate, ETCO2, and skin temperature) both before and after anesthesia induction. Third, given the nature of this study as a subgroup analysis of a prospective observational study, it has inherent limitations, and implementing appropriate blinding measures was not feasible. Thus, despite a calculated power of 0.774 from post hoc analysis, it highlights the further need for more conclusive prospective studies specifically dedicated to exploring the impact of obesity on the microvascular system during general anesthesia. Fourth, this study, which examined the influence of obesity on microvascular reactivity under general anesthesia, did not elucidate its physiological mechanisms or determine its effects on postoperative outcomes.
Conclusions
In conclusion, our research accentuates the heightened vulnerability of capillary recruitment capacity to anesthetic effects in the presence of obesity. During general anesthesia, microvascular reactivity, reflecting capillary recruitment, was notably compromised in the obese group, while the lean group exhibited no such impairment. Furthermore, a moderate negative correlation was found between BMI and microvascular reactivity after anesthesia induction, in contrast to the absence of correlation before anesthesia induction. More studies are needed to improve our understanding of the underlying mechanisms and establish the connection with postoperative outcomes.
Figures
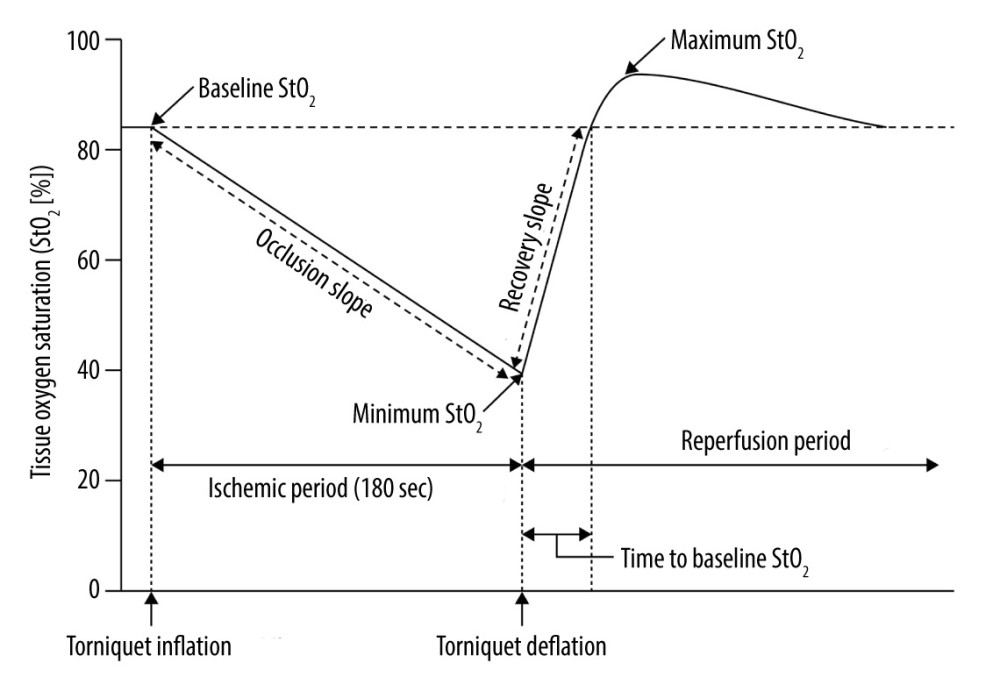 Figure 1. Changes in tissue oxygen saturation derived from near-infrared spectroscopy during vascular occlusion testsMicrocirculatory parameters derived from StO2 during vascular occlusion tests: baseline StO2, minimum StO2 during the ischemic period, maximum StO2 during the reperfusion period, time to reach baseline StO2 from deflation, occlusion slope (∇occl, slope of StO2 descent to the lowest value during tourniquet inflation), and recovery slope (∇recov, slope from the minimum to baseline StO2 during tourniquet deflation).
  Figure 2. Study flow chartBMI – body mass index; VOT – vascular occlusion tests.
 ![Vascular occlusion test-induced alterations in tissue oxygen saturationLean, body mass index [BMI] <25 kg/m2; obese, BMI ≥25 kg/m2; Tpre, before the induction of general anesthesia; Tpost, 30 min after the induction of general anesthesia; ART-RMANOVA, aligned rank-transformed repeated-measures analysis of variance. The graphs in this figure were produced using MedCalc version18.11.6 (MedCalc Software bvba, Ostend, Belgium).](https://jours.isi-science.com/imageXml.php?i=medscimonit-30-e943036-g003.jpg&idArt=943036&w=1000) Figure 3. Vascular occlusion test-induced alterations in tissue oxygen saturationLean, body mass index [BMI] <25 kg/m2; obese, BMI ≥25 kg/m2; Tpre, before the induction of general anesthesia; Tpost, 30 min after the induction of general anesthesia; ART-RMANOVA, aligned rank-transformed repeated-measures analysis of variance. The graphs in this figure were produced using MedCalc version18.11.6 (MedCalc Software bvba, Ostend, Belgium).
Figure 3. Vascular occlusion test-induced alterations in tissue oxygen saturationLean, body mass index [BMI] <25 kg/m2; obese, BMI ≥25 kg/m2; Tpre, before the induction of general anesthesia; Tpost, 30 min after the induction of general anesthesia; ART-RMANOVA, aligned rank-transformed repeated-measures analysis of variance. The graphs in this figure were produced using MedCalc version18.11.6 (MedCalc Software bvba, Ostend, Belgium). ![Occlusion and recovery slopes in the lean and obese groups before and after anesthesia induction(A) Slope of StO2 descent to the lowest value during tourniquet inflation (∇occl) and (B) slope from the minimum to baseline StO2 during tourniquet deflation (∇recov). Lean, body mass index [BMI] <25 kg/m2; obese, BMI ≥25 kg/m2; Tpre, before the induction of general anesthesia; Tpost, 30 min after the induction of general anesthesia. The graphs in this figure were produced with the assistance of MedCalc version18.11.6 (MedCalc Software bvba, Ostend, Belgium).](https://jours.isi-science.com/imageXml.php?i=medscimonit-30-e943036-g004.jpg&idArt=943036&w=1000) Figure 4. Occlusion and recovery slopes in the lean and obese groups before and after anesthesia induction(A) Slope of StO2 descent to the lowest value during tourniquet inflation (∇occl) and (B) slope from the minimum to baseline StO2 during tourniquet deflation (∇recov). Lean, body mass index [BMI] <25 kg/m2; obese, BMI ≥25 kg/m2; Tpre, before the induction of general anesthesia; Tpost, 30 min after the induction of general anesthesia. The graphs in this figure were produced with the assistance of MedCalc version18.11.6 (MedCalc Software bvba, Ostend, Belgium).
Figure 4. Occlusion and recovery slopes in the lean and obese groups before and after anesthesia induction(A) Slope of StO2 descent to the lowest value during tourniquet inflation (∇occl) and (B) slope from the minimum to baseline StO2 during tourniquet deflation (∇recov). Lean, body mass index [BMI] <25 kg/m2; obese, BMI ≥25 kg/m2; Tpre, before the induction of general anesthesia; Tpost, 30 min after the induction of general anesthesia. The graphs in this figure were produced with the assistance of MedCalc version18.11.6 (MedCalc Software bvba, Ostend, Belgium). References
1. Seyni-Boureima R, Zhang Z, Antoine MMLK, A review on the anesthetic management of obese patients undergoing surgery: BMC Anesthesiol, 2022; 22(1); 98
2. Lotia S, Bellamy MC, Anaesthesia and morbid obesity: Continuing Education in Anaesthesia, Critical Care and Pain, 2008; 8; 151-56 Available from: https://www.e-safe-anaesthesia.org/e_library/11/Anaesthesia_and_morbid_obesity.pdf
3. Wiernsperger N, Nivoit P, Bouskela E, Microcirculation in obesity: An unexplored domain: An Acad Bras Cienc, 2007; 79(4); 617-38
4. Nam K, Jeon Y, Microcirculation during surgery: Anesth Pain Med, 2022; 17(1); 24-34
5. McLay KM, Nederveen JP, Pogliaghi S, Repeatability of vascular responsiveness measures derived from near-infrared spectroscopy: Physiol Rep, 2016; 4(9); e12772
6. Cho AR, Lee HJ, Kim HJ, Microvascular reactivity measured by dynamic near-infrared spectroscopy following induction of general anesthesia in healthy patients: Observation of age-related change: Int J Med Sci, 2021; 18(5); 1096-103
7. Scholkmann F, Kleiser S, Metz AJ, A review on continuous wave functional near-infrared spectroscopy and imaging instrumentation and methodology: Neuroimage, 2014; 85(Pt 1); 6-27
8. Creteur J, Carollo T, Soldati G: Intensive Care Med, 2007; 33(9); 1549-56
9. Cho YJ, Lee SY, Kim TK, Effect of prewarming during induction of anesthesia on microvascular reactivity in patients undergoing off-pump coronary artery bypass surgery: A randomized clinical trial: PLoS One, 2016; 11(7); e0159772
10. Campos-Serra A, Mesquida J, Montmany-Vioque S, Alterations in tissue oxygen saturation measured by near-infrared spectroscopy in trauma patients after initial resuscitation are associated with occult shock: Eur J Trauma Emerg Surg, 2023; 49(1); 307-15
11. Lee JH, Jang YE, Song IK, Near-infrared spectroscopy and vascular occlusion test for predicting clinical outcome in pediatric cardiac patients: A prospective observational study: Pediatr Crit Care Med, 2018; 19(1); 32-39
12. Kim TK, Cho YJ, Min JJ, Microvascular reactivity and clinical outcomes in cardiac surgery: Crit Care, 2015; 19(1); 316
13. Soni S, Shah S, Chaggar R, Surgical cancellation rates due to peri-operative hypertension: Implementation of multidisciplinary guidelines across primary and secondary care: Anaesthesia, 2020; 75(10); 1314-20
14. Lim JU, Lee JH, Kim JS, Comparison of World Health Organization and Asia-Pacific body mass index classifications in COPD patients: Int J Chron Obstruct Pulmon Dis, 2017; 12; 2465-75
15. Pan WH, Yeh WT, How to define obesity? Evidence-based multiple action points for public awareness, screening, and treatment: an extension of Asian-Pacific recommendations: Asia Pac J Clin Nutr, 2008; 17(3); 370-74
16. World Health Organization: The Asia-Pacific perspective: Redefining obesity and its treatment, 2000, Sydney, Health Communications Australia Available from: https://iris.who.int/bitstream/handle/10665/206936/0957708211_eng.pdf
17. Wobbrock JO, Findlater L, Gergle D, The aligned rank transform for nonparametric factorial analyses using only ANOVA procedures, 2011, New York, ACM Press Available from: https://faculty.washington.edu/wobbrock/pubs/chi-11.06.pdf
18. Salomé A, Stoclin A, Motamed C, End-tidal carbon dioxide pressure measurement after prolonged inspiratory time gives a good estimation of the arterial carbon dioxide pressure in mechanically ventilated patients: Diagnostics, 2021; 11(12); 2219
19. Te Lindert BHW, Van Someren EJW, Skin temperature, sleep, and vigilance: Handb Clin Neurol, 2018; 156; 353-65
20. Soares RN, Reimer RA, Alenezi Z, Near-infrared spectroscopy can detect differences in vascular responsiveness to a hyperglycaemic challenge in individuals with obesity compared to normal-weight individuals: Diab Vasc Dis Res, 2018; 15(1); 55-63
21. Soares RN, Reimer RA, Doyle-Baker PK, Mild obesity does not affect the forearm muscle microvascular responses to hyperglycemia: Microcirculation, 2021; 28(2); e12669
22. Moens AL, Goovaerts I, Claeys MJ, Flow-mediated vasodilation: A diagnostic instrument, or an experimental tool?: Chest, 2005; 127(6); 2254-63
23. Chade AR, Renal vascular structure and rarefaction: Compr Physiol, 2013; 3(2); 817-31
24. Bamgbade OA, Rutter TW, Nafiu OO, Postoperative complications in obese and nonobese patients: World J Surg, 2007; 31(3); 556-60
25. Ohno S, Kohjitani A, Miyata M, Recovery of endothelial function after minor-to-moderate surgery is impaired by diabetes mellitus, obesity, hyperuricemia and sevoflurane-based anesthesia: Int Heart J, 2018; 59; 559-65
26. Bagi Z, Feher A, Cassuto J, Microvascular responsiveness in obesity: Implications for therapeutic intervention: Br J Pharmacol, 2012; 165; 544-60
27. Gavin TP, Stallings HW, Zwetsloot KA, Lower capillary density but no difference in VEGF expression in obese vs. lean young skeletal muscle in humans: J Appl Physiol, 2005; 98; 315-21
28. Hurwitz EE, Simon M, Vinta SR, Adding examples to the ASA-Physical Status Classification improves correct assignment to patients: Anesthesiology, 2017; 126; 614-22
29. Yamada T, Kimura-Koyanagi M, Sakaguchi K, Obesity and risk for its comorbidities diabetes, hypertension, and dyslipidemia in Japanese individuals aged 65 years: Sci Rep, 2023; 13(1); 2346
30. Pedersen MH, Bøgelund M, Dirksen C, The prevalence of comorbidities in Danish patients with obesity – a Danish register-based study based on data from 2002 to 2018: Clin Obes, 2022; 12; e12542
Figures
Figure 1. Changes in tissue oxygen saturation derived from near-infrared spectroscopy during vascular occlusion testsMicrocirculatory parameters derived from StO2 during vascular occlusion tests: baseline StO2, minimum StO2 during the ischemic period, maximum StO2 during the reperfusion period, time to reach baseline StO2 from deflation, occlusion slope (∇occl, slope of StO2 descent to the lowest value during tourniquet inflation), and recovery slope (∇recov, slope from the minimum to baseline StO2 during tourniquet deflation).Figure 2. Study flow chartBMI – body mass index; VOT – vascular occlusion tests.Figure 3. Vascular occlusion test-induced alterations in tissue oxygen saturationLean, body mass index [BMI] <25 kg/m2; obese, BMI ≥25 kg/m2; Tpre, before the induction of general anesthesia; Tpost, 30 min after the induction of general anesthesia; ART-RMANOVA, aligned rank-transformed repeated-measures analysis of variance. The graphs in this figure were produced using MedCalc version18.11.6 (MedCalc Software bvba, Ostend, Belgium).Figure 4. Occlusion and recovery slopes in the lean and obese groups before and after anesthesia induction(A) Slope of StO2 descent to the lowest value during tourniquet inflation (∇occl) and (B) slope from the minimum to baseline StO2 during tourniquet deflation (∇recov). Lean, body mass index [BMI] <25 kg/m2; obese, BMI ≥25 kg/m2; Tpre, before the induction of general anesthesia; Tpost, 30 min after the induction of general anesthesia. The graphs in this figure were produced with the assistance of MedCalc version18.11.6 (MedCalc Software bvba, Ostend, Belgium). Tables
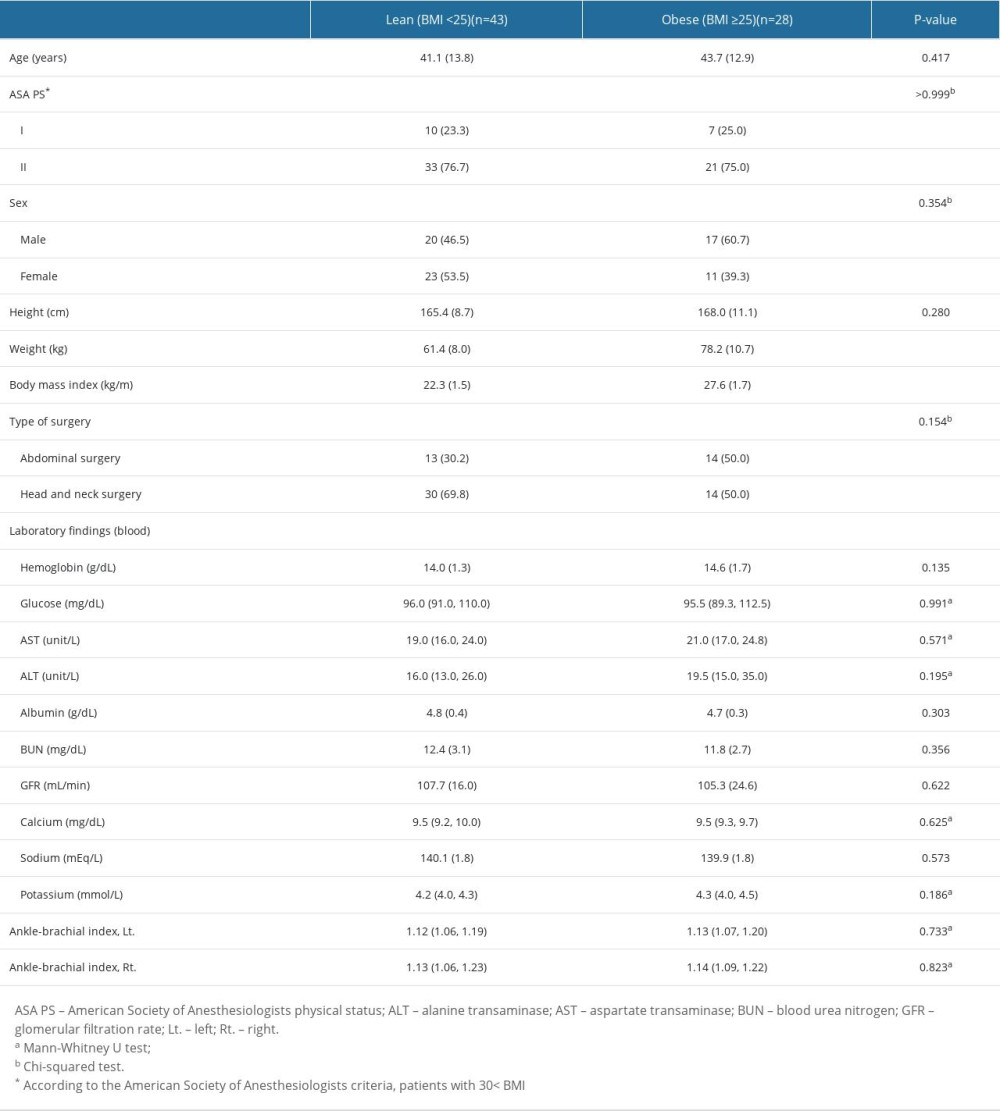 Table 1. Patient baseline characteristics and preoperative laboratory findings.
 Table 2. Vital signs and microcirculatory parameters.
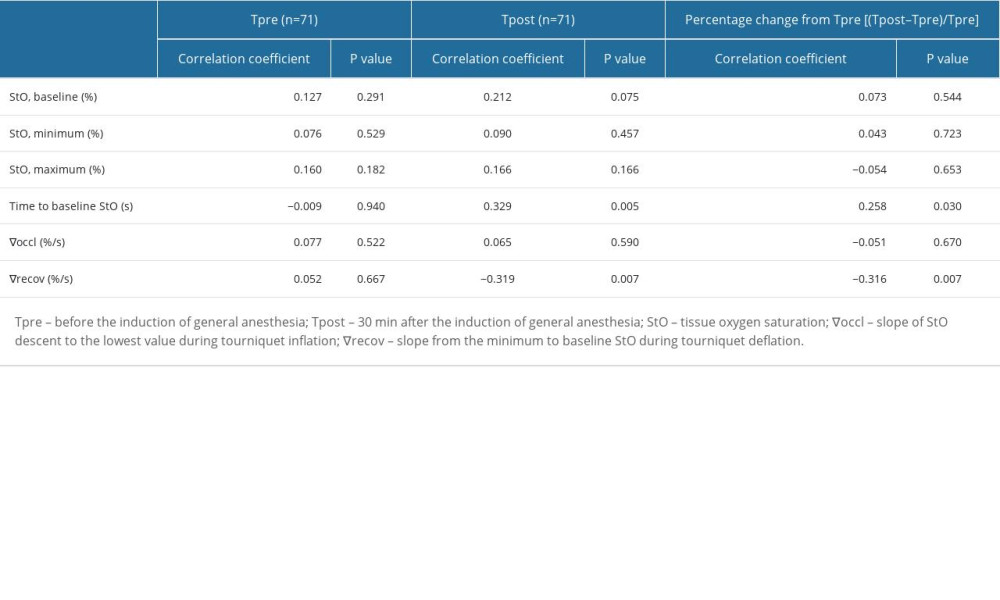 Table 3. Correlation between BMI and microcirculatory variables.Table 1. Patient baseline characteristics and preoperative laboratory findings.Table 2. Vital signs and microcirculatory parameters.Table 3. Correlation between BMI and microcirculatory variables.
 In Press
12 Mar 2024 : Database Analysis
Risk Factors of Age-Related Macular Degeneration in a Population-Based Study: Results from SHIP-TREND-1 (St...Med Sci Monit In Press; DOI: 10.12659/MSM.943140
12 Mar 2024 : Clinical Research
Preoperative Blood Transfusion Requirements for Hemorrhoidal Severe Anemia: A Retrospective Study of 128 Pa...Med Sci Monit In Press; DOI: 10.12659/MSM.943126
12 Mar 2024 : Clinical Research
Tissue Inhibitors of Metalloproteinase 1 (TIMP-1) and 3 (TIMP-3) as New Markers of Acute Kidney Injury Afte...Med Sci Monit In Press; DOI: 10.12659/MSM.943500
12 Mar 2024 : Review article
Optimizing Behçet Uveitis Management: A Review of Personalized Immunosuppressive StrategiesMed Sci Monit In Press; DOI: 10.12659/MSM.943240
Most Viewed Current Articles
17 Jan 2024 : Review article
Vaccination Guidelines for Pregnant Women: Addressing COVID-19 and the Omicron VariantDOI :10.12659/MSM.942799
Med Sci Monit 2024; 30:e942799
14 Dec 2022 : Clinical Research
Prevalence and Variability of Allergen-Specific Immunoglobulin E in Patients with Elevated Tryptase LevelsDOI :10.12659/MSM.937990
Med Sci Monit 2022; 28:e937990
16 May 2023 : Clinical Research
Electrophysiological Testing for an Auditory Processing Disorder and Reading Performance in 54 School Stude...DOI :10.12659/MSM.940387
Med Sci Monit 2023; 29:e940387
01 Jan 2022 : Editorial
Editorial: Current Status of Oral Antiviral Drug Treatments for SARS-CoV-2 Infection in Non-Hospitalized Pa...DOI :10.12659/MSM.935952
Med Sci Monit 2022; 28:e935952