08 June 2024: Clinical Research
Machine Learning-Based Prediction of Infection Study in Adults
Min Liu1ACE, Shiyu Liu2ABDG, Zhaolin Lu3DEF, Hu Chen4CD, Yuling Xu1BF, Xue Gong1CF, Guangxia Chen2AEG*DOI: 10.12659/MSM.943666
Med Sci Monit 2024; 30:e943666


Abstract
BACKGROUND: Helicobacter pylori has a high infection rate worldwide, and epidemiological study of H. pylori is important. Artificial intelligence has been widely used in the field of medical research and has become a hotspot in recent years. This paper proposed a prediction model for H. pylori infection based on machine learning in adults.
MATERIAL AND METHODS: Adult patients were selected as research participants, and information on 30 factors was collected. The chi-square test, mutual information, ReliefF, and information gain were used to screen the feature factors and establish 2 subsets. We constructed an H. pylori infection prediction model based on XGBoost and optimized the model using a grid search by analyzing the correlation between features. The performance of the model was assessed by comparing its accuracy, recall, precision, F1 score, and AUC with those of 4 other classical machine learning methods.
RESULTS: The model performed better on the part B subset than on the part A subset. Compared with the other 4 machine learning methods, the model had the highest accuracy, recall, F1 score, and AUC. SHAP was used to evaluate the importance of features in the model. It was found that H. pylori infection of family members, living in rural areas, poor washing hands before meals and after using the toilet were risk factors for H. pylori infection.
CONCLUSIONS: The model proposed in this paper is superior to other models in predicting H. pylori infection and can provide a scientific basis for identifying the population susceptible to H. pylori and preventing H. pylori infection.
Keywords: machine learning, Helicobacter pylori, Clinical Decision Rules, Humans, Helicobacter Infections, adult, Male, Female, Middle Aged, Risk Factors
Introduction
Most of the existing research on disease risk factors in China and abroad [14–16] adopts the methods of univariate analysis and logistic regression. Single factor analysis cannot consider all the factors of the disease at the same time and ignores the internal relationship between factors. Logistic regression is more suitable for dealing with linear variables, considering that all factors included in the model have a linear relationship to the disease [17]; however, there may actually be a nonlinear relationship in clinical practice. Therefore, it is not rigorous or accurate to use only univariate analysis and logistic regression in the analysis of disease risk factors and the construction of disease prediction models. In addition, most of the existing studies on the risk factors for
At present, a large number of clinical prediction models have adopted machine learning methods [18] and have a wide range of applications [19,20]. By analyzing the clinical data of patients, such as medical records and biomarkers, they can predict the risk, diagnosis, or treatment effect of diseases. Compared with traditional logistic regression analysis, the advantages of machine learning methods [21] are efficient learning ability, strong plasticity and flexibility, and strong processing ability of nonlinear relationships [22]. Maleki et al [23] developed a machine learning method based on gradient-enhanced decision trees, which achieved the best performance, showed high discriminative ability, and can be used to personalize the prediction of gastric cancer incidence using initial endoscopy results, histological results, and patient baseline conditions. Forrest et al [24] developed a coronary artery disease prediction model based on random forest and established a quantitative marker of coronary artery disease from probabilities of a machine learning model. Nyssen et al [25] identified important treatment strategies and analyzed compliance and treatment effects of different treatment regimens by random forest and clustering on multi-correspondence components on the European Registry on
The different machine learning methods used in the above studies can be related to the number and characteristics of the datasets. In conclusion, the performance of machine learning clinical prediction models was non-inferior to that of logistic regression in many disease domains, and the application of the field of machine learning and deep learning in
To the best of our knowledge, there is no clinical prediction model for
Material and Methods
STUDY PARTICIPANTS:
Patients who were admitted to Xuzhou First People’s Hospital from July 2022 to July 2023 and underwent 13C breath tests were included in the study. This study met medical ethics standards and was approved by the ethics committee of our hospital (approval number: xyyl1[2023]053). The inclusion criteria were as follows: age between 18 and 80 years; sex, male and female; 13C breath test was performed; and informed consent was obtained. Exclusion criteria were as follows: pregnant and lactating women; patients with psychiatric diagnoses; patients taking antacids, antibiotics, bismuth and other drugs affecting 13C breath detection in the past 2 weeks; and patients with heart, lung, kidney, and other underlying endocrine diseases. This study included 30 factors, and in calculating the sample size, the number of patients should be 5 to 10 times the number of factors included, with a 10% loss to follow-up rate, and a 50% estimated infection rate of
RISK FACTOR DATA AND METHODS OF COLLECTION:
CiteSpace, a software tool for visualizing and analyzing scientific literature, was used to identify co-occurring keywords in studies related to the risk factors for
After ethical review by our hospital, the paper questionnaire of risk factors or the WeChat mini program of risk factor survey was used to collect data. The WeChat platform was designed and developed by authors ML and GC to investigate patients’ clinical information. The purpose of the study was explained to the research participants, and informed consent was signed before the investigation.
The 13C breath test was used to detect
DATA PREPROCESSING AND FEATURE OPTIMIZATION:
Excluding the data with missing values, 30 characteristics of 677 samples were preprocessed. Continuous variables, such as age and BMI, were stratified and converted into 4 categorical variables, the variables were coded into numerical form, and the binary variables were coded with 0 and 1. The 4 categorical variables were coded with 1, 2, 3, and 4, and each code was expressed as a category.
To improve the performance of the prediction models, reduce overfitting, and reduce computational costs, feature selection was first performed on the dataset to reduce the number of redundant features. However, models based on a certain feature selection algorithm may not have been representative; therefore, we selected multiple commonly used feature selection algorithms to screen the common features of these algorithms for subsequent modeling and prediction. In this study, the data in which the dependent variable (
The chi-square test is a commonly used feature selection method in classification problems that measures the correlation between features and target variables by calculating the chi-square statistic between them. A higher chi-square value indicates a higher correlation between the features and the target variable, and the magnitude of the chi-square value of the features was used to rank the important features. Mutual information can be used to assess the correlation between features and target variables, with higher mutual information values indicating higher correlation between features and target variables. ReliefF is a feature selection algorithm based on the filtering method, and the goal is to select the most discriminative K features. However, to screen features together with the other 3 methods, the number of features is not specified, and the importance scores of all features are output to measure the contribution to the classification task. High scores indicate a greater contribution to the classification task. Information gain is a method to screen features based on the concept of information theory. The information gain of features is obtained by calculating the entropy of the overall dataset and the entropy difference of each feature, and the contribution degree of features to the target variable is measured by comparing the value of the information gain of each feature.
According to the evaluation index of the 4 algorithms, ranking and importance assignment were performed (for example, the maximum chi-square value of the feature assignment was 1, and the minimum chi-square value of the feature assignment was 30). The sum of the importance assignment of the 4 algorithms for each feature was calculated and ranked from small to large, and the top 10 and top 15 subsets were selected.
BALANCED DATA AND PARTITIONED DATASETS:
Considering that there were 422
Five-fold cross-validation is a method of dividing the training set and the test set. The feature-filtered dataset was divided into 5 mutually exclusive subsets, 4 of which were used for training, and the remaining subset was used for testing, and the results were repeated 5 times. The average of the 5 calculation results was used as the evaluation index to evaluate the performance of the model more stably and reduce the influence on the specific dataset.
MODEL TRAINING AND EVALUATION:
Xgboost and several classical machine learning models – support vector machine, logistic regression, random forest training, and naive Bayes – were used to establish clinical prediction models of
The evaluation indicators accuracy, recall, precision, F1 score, and AUC were used to evaluate the training effect of the model. Accuracy can judge the total accuracy and is the simplest and most intuitive evaluation index. Recall, also known as sensitivity, measures the ability of the model to find positive samples. Precision, also known as the positive prediction rate, measures how well the model predicts positive samples. The F1 score can comprehensively consider 2 indicators of recall and precision, which can better measure the overall performance of the binary classification model. The AUC value is an indicator to evaluate the classification effect of the model. It can measure the ability of the model to distinguish between positive and negative samples. The higher the AUC value is, the better the model performance.
FEATURE IMPORTANCE EVALUATION:
SHapley Additive exPlanations (SHAP), which is based on game theory, is widely used in explanatory machine learning technology. Compared with the feature importance evaluation method of the model, SHAP not only shows the contribution of each factor to the prediction result but also shows the contribution direction of the prediction result. A positive SHAP value indicates the contribution degree of the feature value to the positive prediction result, and a negative SHAP value indicates the contribution degree of the feature value to the reverse prediction result; therefore, it can be determined whether the feature value belongs to a protective factor or a risk factor.
STATISTICAL ANALYSIS:
Measurement data, such as age and BMI, were stratified, and all characteristic data were expressed as numbers and ratios. SPSS 22.0 software was used for the chi-square test and
Results
STUDY PROCEDURE AND PATIENT DATA:
The flow chart of this study is shown in Figure 1. After excluding 27 pieces of data with missing values, 677 valid information points were included. Table 1 shows the investigation results of H. pylori-positive patients and H. pylori-negative patients in different eigenvalues of 30 features in 667 samples and shows them by the number of cases and percentage. Among them, 422 patients (62.33%) were positive for H. pylori, and 255 patients (37.67%) were negative for H. pylori. Among 319 male patients, 214 (67.08%) were positive for H. pylori, and among 358 female patients, 208 (58.10%) were positive for H. pylori. The age of H. pylori-positive patients was concentrated between 30 and 60 years old. H. pylori infection seemed to be more concentrated in people with higher education levels (30.57%). The proportions of non-atrophic gastritis, atrophic gastritis, and peptic ulcer in H. pylori-positive patients were higher than those in H. pylori-negative patients. The proportions of hyperlipidemia, hypertension, diabetes, and polyps were similar between H. pylori-positive patients and H. pylori-negative patients.
MODEL FEATURE SELECTION:
To eliminate some irrelevant or redundant variables in the database to improve the prediction performance of the model, 4 commonly used feature selection methods were integrated for feature optimization: chi-square test, mutual information, ReliefF, and information gain for assignment importance ranking of 30 features by heatmap (Figure 2). The X-axis represents each feature, and the Y-axis represents the 4 model feature selection methods. The color of the heatmap represents the chi-square value, mutual information value, ReliefF eigenvalue, and information gain value (red represents the high value, and blue represents the low value), the number on the color block is the value size, and the ranking of the importance of comprehensive assignment is arranged from high to low on the heatmap from left to right. The top 10 features of the sum of the assigned importance of the 4 algorithms are H. pylori infection in family, region, education (edu), non-atrophic gastritis, family cutlery, age, salt, bean, pickled food, and handwashing. The dataset of these 10 features is defined as part A. The top 15 features are H. pylori infection in family, region, edu, non-atrophic gastritis, family cutlery, age, salt, bean, pickled food, handwashing, alcohol, spicy, garlic, pickled food, and tea. The dataset defining these 15 features is part B.
MODEL CONSTRUCTION AND PERFORMANCE ANALYSIS:
The comparison between the proposed model and the other 4 models after parameter tuning, the Xgboost model, support vector machine model, logistic regression model, random forest model, and naive Bayes model, were trained and parameters were tuned on the part A and part B datasets (Table 2). The performance evaluation is shown in Table 3 and Figure 3. By comparing accuracy, recall, precision, F1 score, and AUC, we found that most of the performance indicators of the 5 models were better on the part B dataset than on the part A dataset. It may be that part A included fewer key features, resulting in information loss and making the model unable to make accurate predictions. The Xgboost model trained on the part A dataset was higher than the other 4 models in terms of other performance indicators, except precision. On the part B dataset, our proposed model and the random forest model both showed high performance, with AUC values of 0.861 and 0.848, respectively. Comparing the performance indicators of 5 training models of the 2 datasets, it was found that in addition to precision, the accuracy, recall, F1 score, and AUC value of this model on the part B dataset were the highest, and the model performed best. In addition, we used t tests to compare the mean value of the performance indexes of other models with the Xgboost model. However, Xgboost did not show significant differences in either dataset, part A or part B.
FEATURE IMPORTANCE EVALUATION:
SHAP was used to evaluate the feature importance. Figures 4 and 5 show the results of the feature importance evaluation of the model proposed in this study on the H. pylori infection situation prediction task. The bar chart in Figure 4 shows the average influence of each characteristic factor on the output magnitude of the model (the degree of influence of characteristic factors is in order of high and low). It can be seen from the figure that the most important characteristic factor is H. pylori infection in family members, and living area, washing hands before meals and after using the toilet, non-atrophic gastritis, and family sharing of tableware also have certain importance. The scatter plot in Figure 5 shows the distribution of the impact of each feature on the model output. On the abscissa, negative SHAP values indicate a decreased risk of infection, positive SHAP values indicate an increased risk of infection, and the color represents the magnitude of the feature value (red for larger feature values, blue for smaller feature values). According to the scatter distribution in the figure, it can be seen that the larger eigenvalue, H. pylori infection in family members, is the risk factor for H. pylori infection. Non-atrophic gastritis is also a risk factor for H. pylori infection.
Since scatter plots are usually used to visualize dichotomous variables, violin plots were drawn for the 4 categorical variables of living area, hand washing before meals and after toilet, and household sharing of utensils to show the influence of different characteristic values on the model, and the positive and negative SHAP values were used to mark risk factors and protective factors, as shown in Figure 6. Living area characteristic value 1 (urban residence) was a protective factor for H. pylori infection, and characteristic value 4 (rural residence) was a risk factor for H. pylori infection. The characteristic value of washing hands before meals and after using toilet 1 (rarely) was a risk factor for H. pylori infection. The violin plot showed that the 4 characteristic values of shared household cutlery were distributed in both the positive and negative directions of SHAP values and thus did not show protective or risk factors.
Discussion
The results of our proposed
This study was a prospective study that accurately and comprehensively conducted inclusion and exclusion and collected risk factor data. Moreover, Xuzhou is at the border of 4 provinces, and some patients came from surrounding provinces and cities. The results of this study can represent the risk factors for
Conclusions
Most epidemiological studies of
There are still many challenges for machine learning methods in the field of clinical prediction. The first is model validation, which considers whether the machine learning model is reliable and valid in the real clinical environment, to avoid inappropriate treatments and overuse of antibiotics. The second is model interpretability, which is how to interpret the prediction results of machine learning models to increase the trust of the results and promote clinical application. Finally, there is the practical application of the model, such as the use of mobile devices and apps to provide personalized
Figures
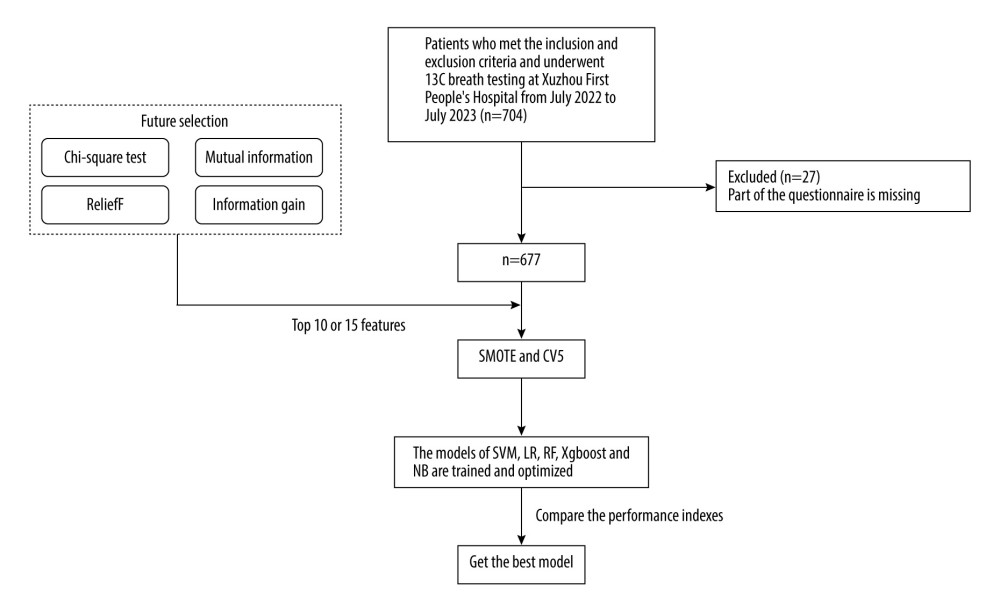 Figure 1. Patient inclusion and model training process.
 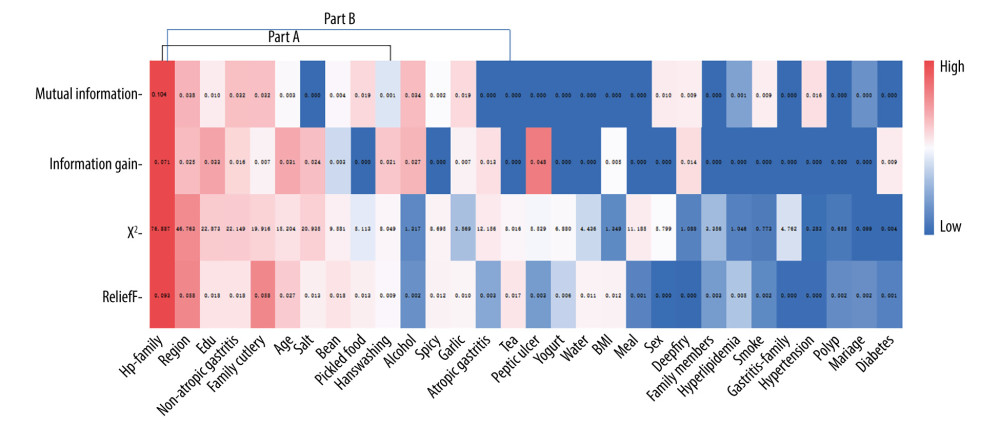 Figure 2. Feature assignment importance ranking by heatmap. Part A: the sum of the importance of the 4 algorithms ranked the top 10 features. Part B: The sum of the importance of the 4 algorithms ranked the top 15 features.
 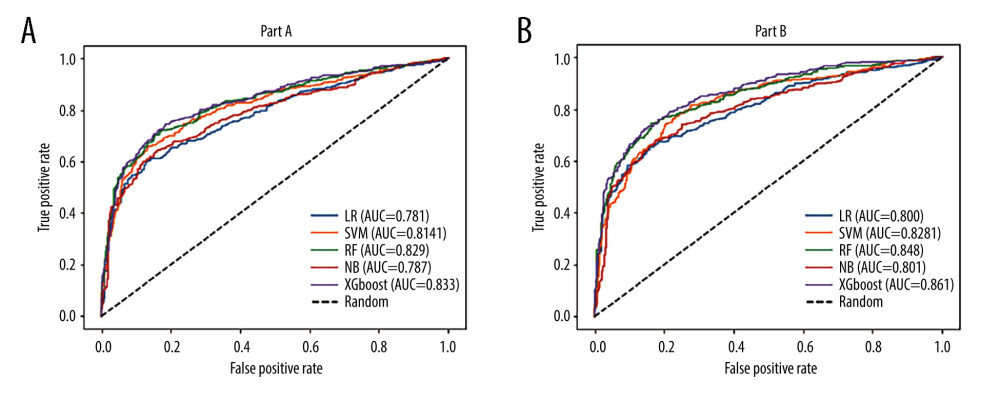 Figure 3. AUC curve of the prediction model: (A) part A; (B) part B.
 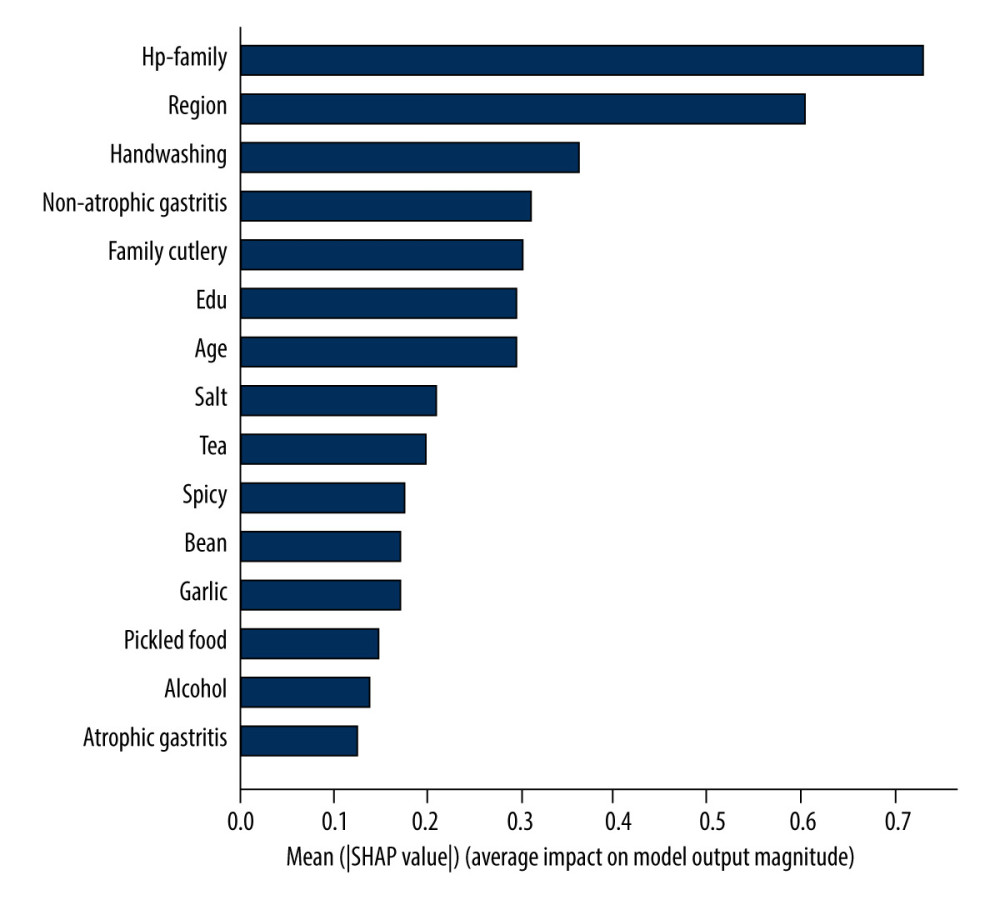 Figure 4. Feature importance histogram.
 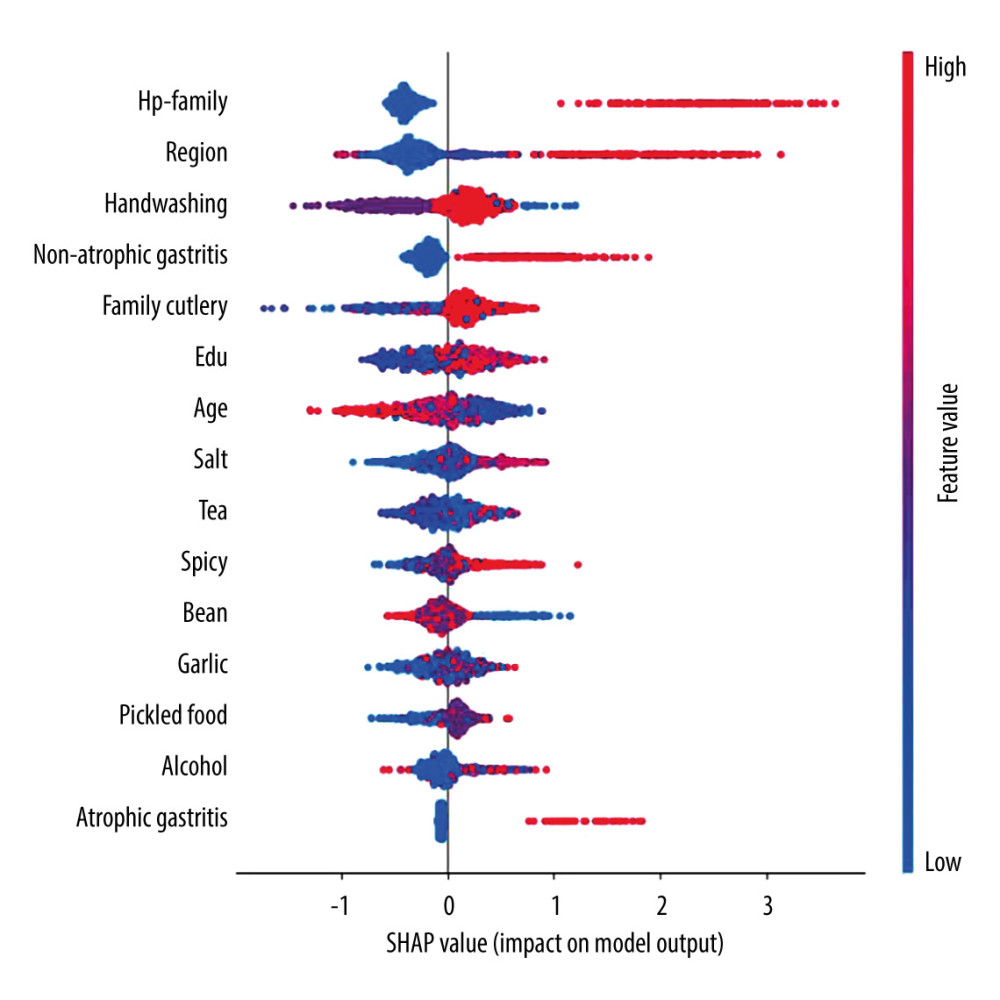 Figure 5. Feature importance scatter plot. SHAP value: negative SHAP values indicate a decreased risk of infection, positive SHAP values indicate an increased risk of infection, and the color represents the magnitude of the feature value.
 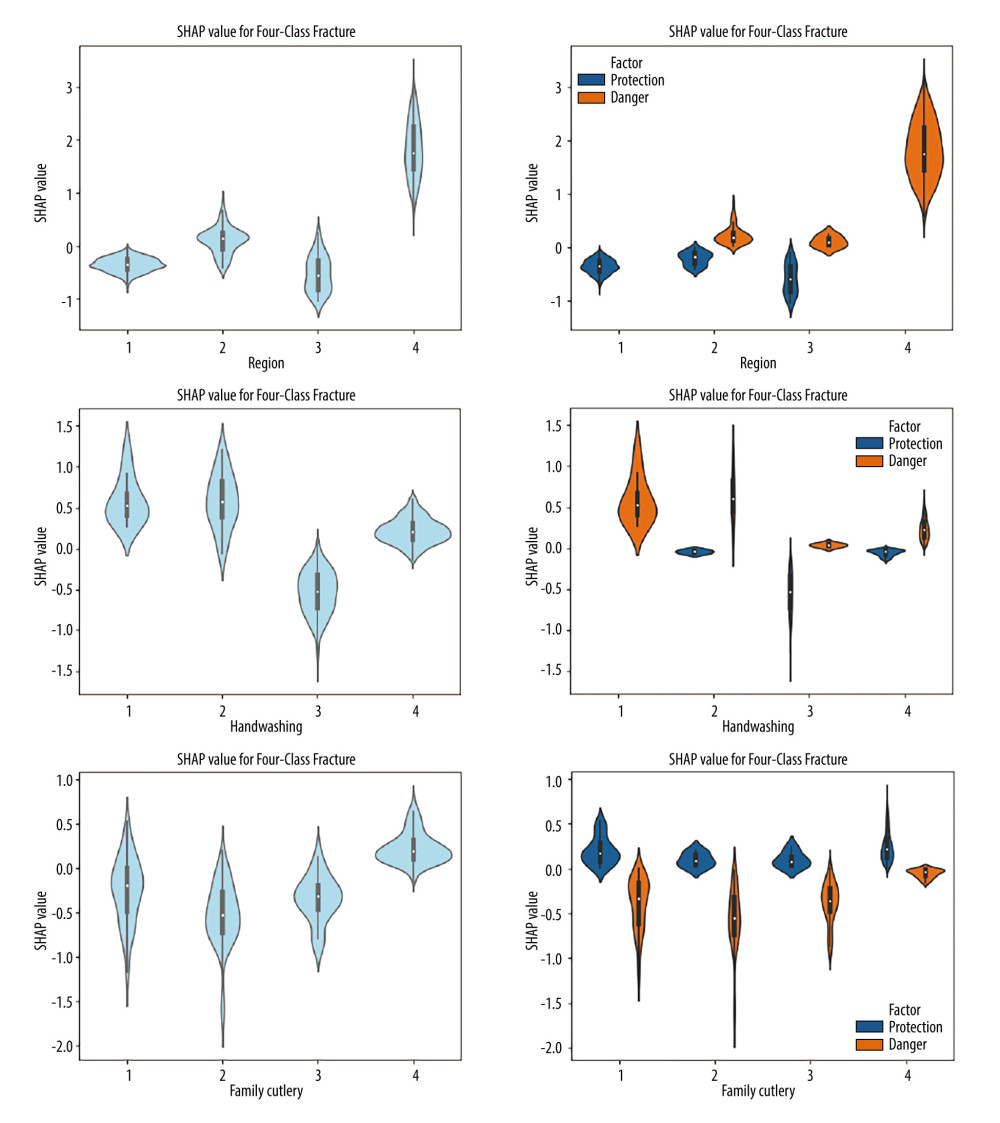 Figure 6. Violin plots of feature importance for living area, hand-washing before meals and after using the toilet, and sharing utensils (SHAP values >0: danger; SHAP values <0: protection).
 References
1. Diaconu S, Predescu A, Moldoveanu A, Infection: Old and new: J Med Life, 2017; 10(2); 112-17
2. Hooi J, Lai WY, Ng WK: Gastroenterology, 2017; 153(2); 420-29
3. Ren S, Cai P, Liu Y: J Gastroenterol Hepatol, 2022; 37(3); 464-70
4. Yuan G, Chen Y, He S: N Engl J Med, 2020; 382(22); 2171
5. Al-Khalidy HSH: J Coloproctol, 2020; 40(2); 168-71
6. Jiang Y, Huang L, Zhou L: Nutrition Clinique et Métabolisme, 2022; 36(3); 210-16
7. Asgeirsdottir GA, Kjartansdottir I, Olafsdottir AS: Scand J Gastroenterol, 2017; 52(6–7); 686-90
8. Abdallah TM, Mohammed HB, Mohammed MH, Ali AAA: Asian Pac J Trop Dis, 2014; 4(2); 115-19
9. Burucoa C, Axon A: Helicobacter, 2017; 22(Suppl 1); hel.12403
10. Vesga F, Moreno Y, Ferrús MA: Int J Hyg Environ Health, 2018; 221(4); 595-601
11. Hussain Shah SR, Almugadam BS, Hussain A: Clin Epidemiol Glob Health, 2021; 12; 100909
12. Lee YY, Ismail AW, Mustaffa N: Helicobacter, 2012; 17(1); 54-61
13. Mamishi S, Eshaghi H, Mahmoudi S: Br J Biomed Sci, 2016; 73(1); 38-43
14. Fu Y, Yang L, Du J, Establishment of HIV-negative neurosyphilis risk score model based on logistic regression: Eur J Med Res, 2023; 28(1); 200
15. Peng Q, Zeng P, Jiang X, Guan F, Establishment of relapse risk model and multivariate logistic regression analysis on risk factors of relapse in children with primary nephrotic syndrome: Medicine (Baltimore), 2022; 101(29); e29866
16. Bhowmik KR, Das S, On selection of an appropriate logistic model to determine the risk factors of childhood stunting in Bangladesh: Matern Child Nutr, 2019; 15(1); e12636
17. Domínguez-Almendros S, Benítez-Parejo N, Gonzalez-Ramirez AR, Logistic regression models: Allergol Immunopathol (Madr), 2011; 39(5); 295-305
18. Shehab M, Abualigah L, Shambour Q, Machine learning in medical applications: A review of state-of-the-art methods: Comput Biol Med, 2022; 145; 105458
19. Zhang Z, Yang L, Han W, Machine learning prediction models for gestational diabetes mellitus: Meta-analysis: J Med Internet Res, 2022; 24(3); e26634
20. Joshi RD, Dhakal CK, Predicting type 2 diabetes using logistic regression and machine learning approaches: Int J Environ Res Public Health, 2021; 18(14); 7346
21. Song X, Liu X, Liu F, Wang C, Comparison of machine learning and logistic regression models in predicting acute kidney injury: A systematic review and meta-analysis: Int J Med Inform, 2021; 151; 104484
22. Liew BXW, Kovacs FM, Rügamer D, Royuela A, Machine learning versus logistic regression for prognostic modelling in individuals with non-specific neck pain: Eur Spine J, 2022; 31(8); 2082-91
23. Arai J, Aoki T, Sato M, Machine learning-based personalized prediction of gastric cancer incidence using the endoscopic and histologic findings at the initial endoscopy: Gastrointest Endosc, 2022; 95(5); 864-72
24. Forrest IS, Petrazzini BO, Duffy Á, Machine learning-based marker for coronary artery disease: Derivation and validation in two longitudinal cohorts: Lancet, 2023; 401(10372); 215-25
25. Nyssen OP, Pratesi P, Spínola MA: Antibiotics, 2023; 12(9); 1427
26. Leung WK, Cheung KS, Li B: Aliment Pharmacol Ther, 2021; 53(8); 864-72
27. Yasuda T, Hiroyasu T, Hiwa S: Dig Endosc, 2020; 32(3); 373-81
28. Shen Y, Chen A, Zhang X: Clin Transl Gastroenterol, 2023; 14(10); e00643
29. Luo J, Cao S, Ding N, A deep learning method to assist with chronic atrophic gastritis diagnosis using white light images: Dig Liver Dis, 2022; 54(11); 1513-19
30. Tran V, Saad T, Tesfaye M: BMC Infect Dis, 2022; 22(1); 655
31. Ito M, Sugiyama A, Mino M: J Gastroenterol, 2022; 57(8); 540-46
32. Maleki I, Mohammadpour M, Zarrinpour N: Gastroenterol Hepatol Bed Bench, 2019; 12(1); 31-37
33. Lupu A, Miron IC, Cernomaz AT: Diagnostics (Basel), 2023; 13(3); 408
34. Galal YS, Ghobrial CM, Labib JR, Abou-Zekri ME: J Egypt Public Health Assoc, 2019; 94(1); 17
35. Abebaw W, Kibret M, Abera B: Asian Pac J Cancer Prev, 2014; 15(11); 4459-63
36. Gu H: Curr Microbiol, 2017; 74(7); 863-69
37. Wang YC: World J Gastroenterol, 2014; 20(30); 10368-82
Figures
Figure 1. Patient inclusion and model training process.Figure 2. Feature assignment importance ranking by heatmap. Part A: the sum of the importance of the 4 algorithms ranked the top 10 features. Part B: The sum of the importance of the 4 algorithms ranked the top 15 features.Figure 3. AUC curve of the prediction model: (A) part A; (B) part B.Figure 4. Feature importance histogram.Figure 5. Feature importance scatter plot. SHAP value: negative SHAP values indicate a decreased risk of infection, positive SHAP values indicate an increased risk of infection, and the color represents the magnitude of the feature value.Figure 6. Violin plots of feature importance for living area, hand-washing before meals and after using the toilet, and sharing utensils (SHAP values >0: danger; SHAP values <0: protection). Tables
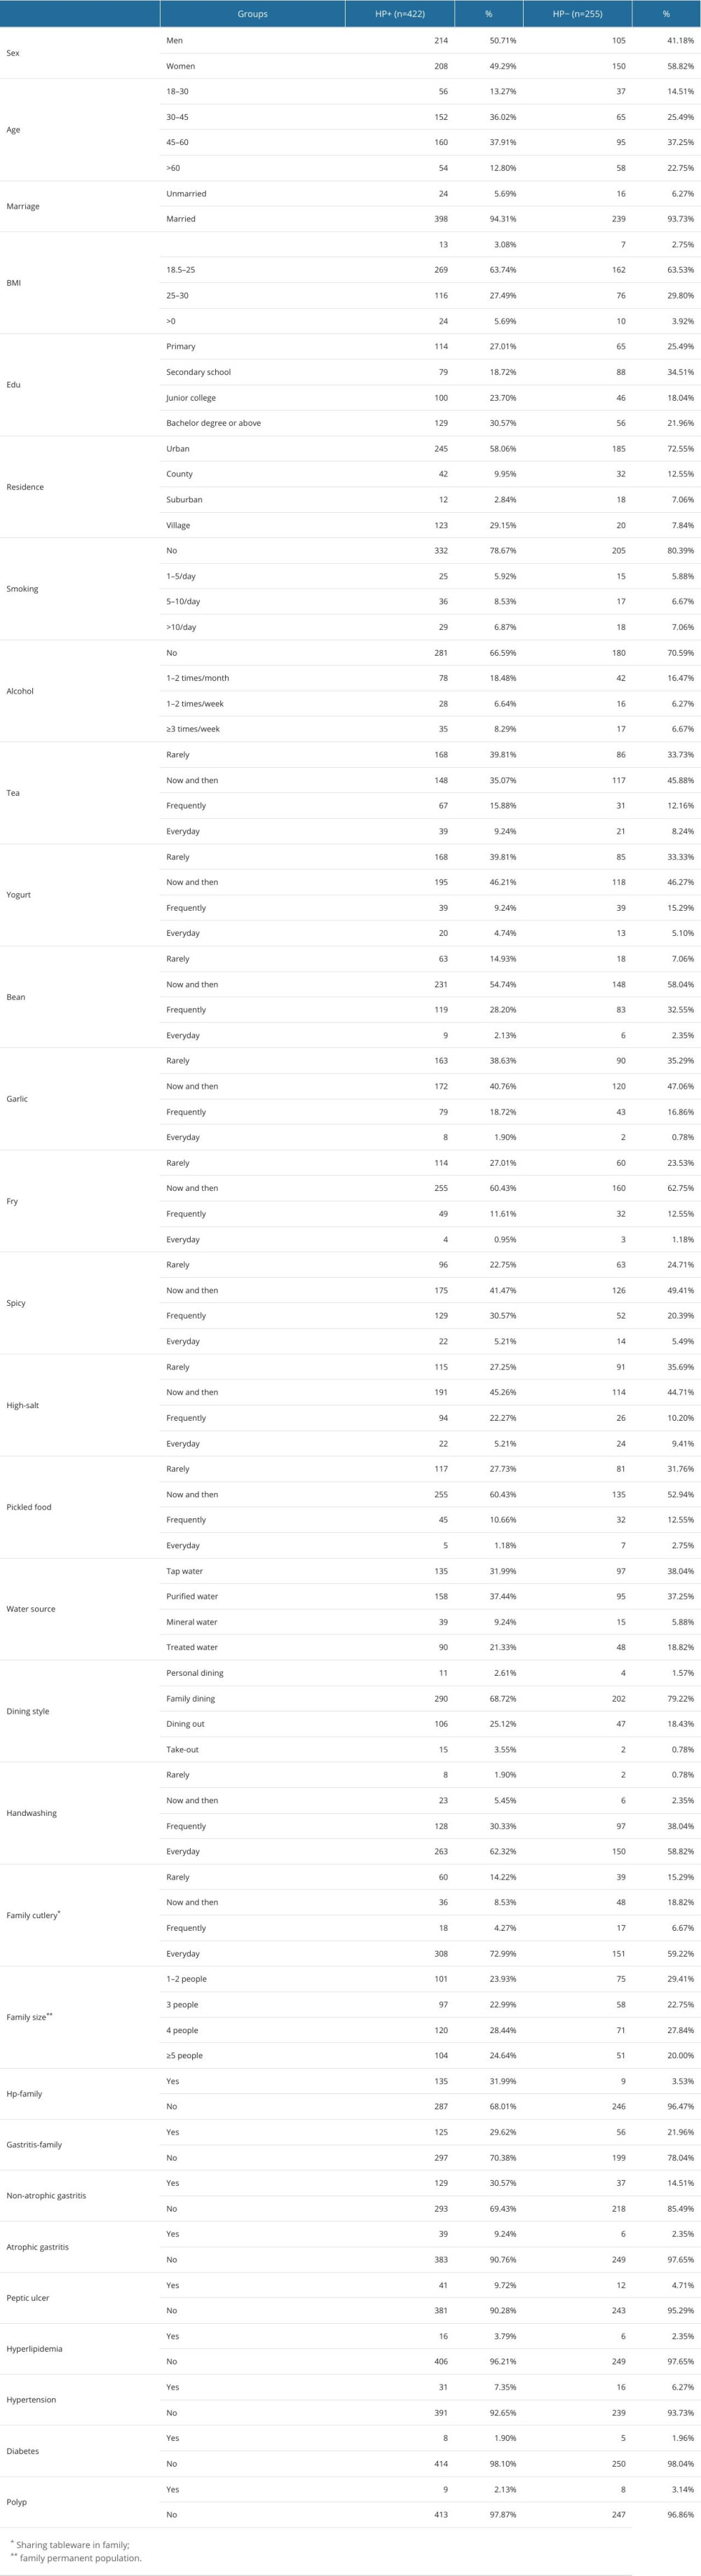 Table 1. Characteristics and survey results.
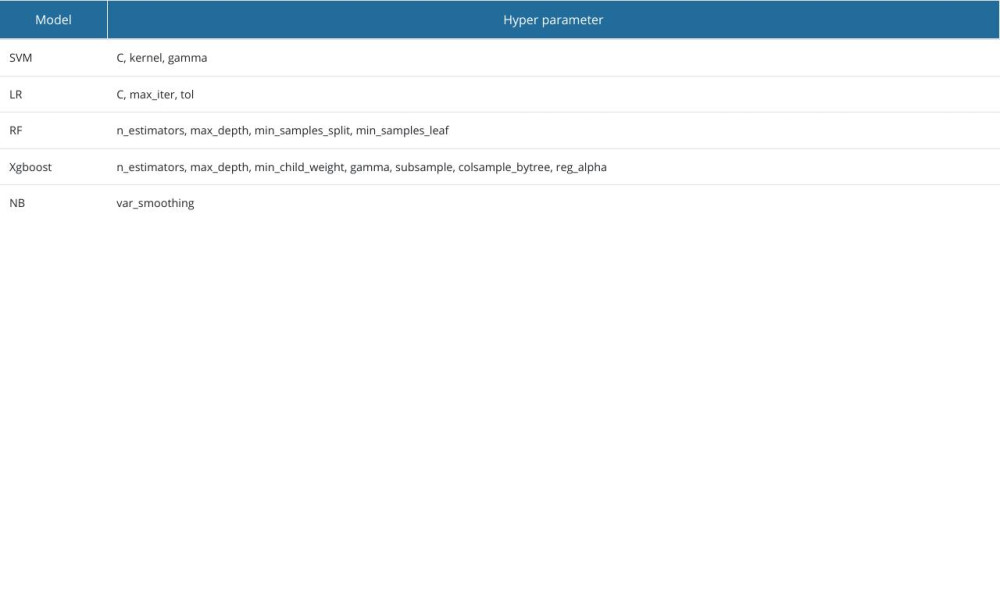 Table 2. Each model and tuned hyperparameters.
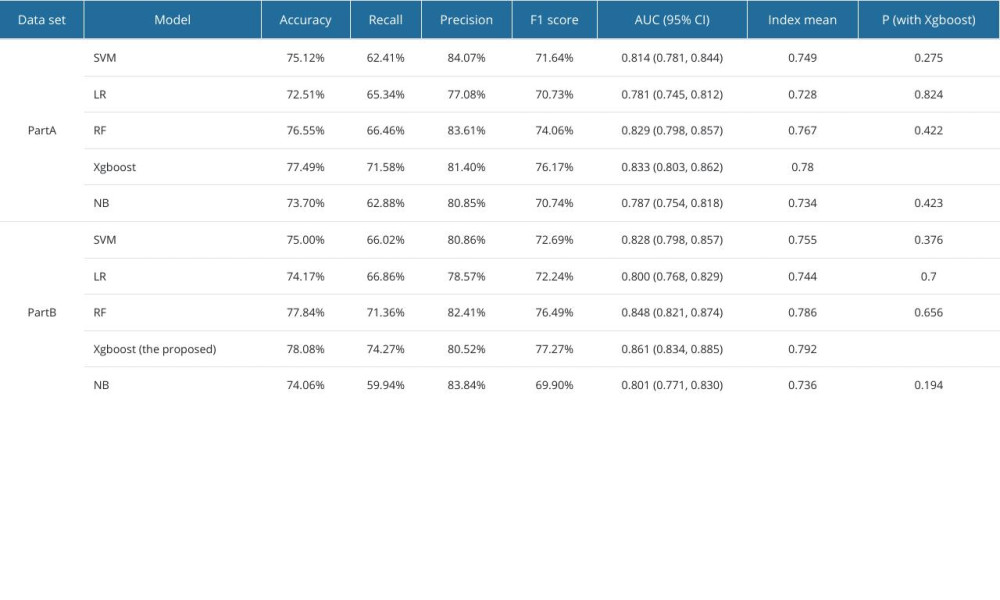 Table 3. Performance evaluation metrics of the prediction model on the part A and part B datasets.Table 1. Characteristics and survey results.Table 2. Each model and tuned hyperparameters.Table 3. Performance evaluation metrics of the prediction model on the part A and part B datasets.
 In Press
Clinical Research
Effects of Single-Bout Endurance Exercise Intensity on Peripheral Neurotrophic Factors in Patients With Isc...Med Sci Monit In Press; DOI: 10.12659/MSM.952089
Review article
Anisodus tanguticus in Cancer Research: A Review of Traditional Use, Phytochemistry, Extraction Methods, an...Med Sci Monit In Press; DOI: 10.12659/MSM.952999
Clinical Research
Nasal Mucociliary Clearance and Its Relationship With Disease Severity in Patients With Multiple SclerosisMed Sci Monit In Press; DOI: 10.12659/MSM.952850
Clinical Research
Modified Thoracoabdominal Nerves Block Through the Perichondrial Approach vs Subcostal Transversus Abdomini...Med Sci Monit In Press; DOI: 10.12659/MSM.953976
Most Viewed Current Articles
17 Jan 2024 : Review article 14,176,570
Vaccination Guidelines for Pregnant Women: Addressing COVID-19 and the Omicron VariantDOI :10.12659/MSM.942799
Med Sci Monit 2024; 30:e942799
13 Nov 2021 : Clinical Research 3,762,188
Acceptance of COVID-19 Vaccination and Its Associated Factors Among Cancer Patients Attending the Oncology ...DOI :10.12659/MSM.932788
Med Sci Monit 2021; 27:e932788
14 Dec 2022 : Clinical Research 2,466,310
Prevalence and Variability of Allergen-Specific Immunoglobulin E in Patients with Elevated Tryptase LevelsDOI :10.12659/MSM.937990
Med Sci Monit 2022; 28:e937990
16 May 2023 : Clinical Research 708,927
Electrophysiological Testing for an Auditory Processing Disorder and Reading Performance in 54 School Stude...DOI :10.12659/MSM.940387
Med Sci Monit 2023; 29:e940387