31 March 2024: Review Articles
Differentiation of Native Vertebral Osteomyelitis: A Comprehensive Review of Imaging Techniques and Future Applications
Weijian Zhu12BCEF, Sirui Zhou3D, Jinming Zhang1D, Li Li4B, Pin Liu2A*, Wei Xiong1ADOI: 10.12659/MSM.943168
Med Sci Monit 2024; 30:e943168


Abstract
ABSTRACT: Native vertebral osteomyelitis, also termed spondylodiscitis, is an antibiotic-resistant disease that requires long-term treatment. Without proper treatment, NVO can lead to severe nerve damage or even death. Therefore, it is important to accurately diagnose the cause of NVO, especially in spontaneous cases. Infectious NVO is characterized by the involvement of 2 adjacent vertebrae and intervertebral discs, and common infectious agents include Staphylococcus aureus, Mycobacterium tuberculosis, Brucella abortus, and fungi. Clinical symptoms are generally nonspecific, and early diagnosis and appropriate treatment can prevent irreversible sequelae. Advances in pathologic histologic imaging have led physicians to look more forward to being able to differentiate between tuberculous and septic spinal discitis. Therefore, research in identifying and differentiating the imaging features of these 4 common NVOs is essential. Due to the diagnostic difficulties, clinical and radiologic diagnosis is the mainstay of provisional diagnosis. With the advent of the big data era and the emergence of convolutional neural network algorithms for deep learning, the application of artificial intelligence (AI) technology in orthopedic imaging diagnosis has gradually increased. AI can assist physicians in imaging review, effectively reduce the workload of physicians, and improve diagnostic accuracy. Therefore, it is necessary to present the latest clinical research on NVO and the outlook for future AI applications.
Keywords: Artificial Intelligence, Diagnostic Imaging
Introduction
Native vertebral osteomyelitis (NVO), also known as spondylodiscitis, with varying lengths of incubation period, is an easily misdiagnosed and overlooked disease [1]. NVO is usually caused by hematogenous dissemination of a distant lesion, and
This paper summarizes all imaging studies related to pyogenic spondylitis (PS), tuberculous spondylitis (TS), brucellar spondylitis (BS), and fungal spondylitis (FS) in the last decade. This review aims to summarize the imaging manifestations of the major common spondylitis, explore the points of differentiation and mechanisms of difference based on the available studies, and provide an outlook on future diagnostic approaches to NVO.
Segmental Structure of the Spine
The process of ossification of the spine unfolds from the center to the peripheral endplates, and in late adolescence, the peripheral ossified fragments eventually fuse with the vertebral body and form the well-defined anterior corners of the vertebral body. However, deep within the margins, the remaining unossified cartilage then forms the cartilaginous endplate and attaches to the inner disc annulus, while the thinner portion lies centrally overlying the nucleus pulposus [7,8]. The blood supply to the vertebral body emanates mainly from the abdominal aorta (Figure 1) and passes through the lumbar segmental arteries into the vertebral body, where it eventually branches out and terminates near the cartilaginous endplates [8,9]. In addition, the blood supply to the intervertebral disc is mainly from the peripheral periosteal arteries and the internal intraosseous arteries. The peripheral periosteal arteries originate from the upper and lower margins of the vertebral body, run along the margins of the disc, and interconnect with the periosteal arteries of neighboring vertebrae. The internal intraosseous arteries, on the other hand, originate from downstream branches of the spinal arteries within the spinal canal. These arteries connect to the surrounding periosteal arteries through the intervertebral foramina [10]. The overall anterolateral blood supply of the vertebral body is rich, and this particular structure determines that the anterior margin of the vertebral body will be involved by bacteria in the early stages of NVO. When the infection develops further, bacteria will infiltrate deeper into the cartilaginous endplates, enter the annulus of the disc, and then spread to the nucleus pulposus [11].
Diagnostic Value of Plain Radiographs and Computed Tomography for NVO
Spinal plain radiographs are not sensitive to the early diagnosis of NVO; therefore, most plain radiographs appear normal in the early stages of NVO onset. After 2 to 3 weeks of disease onset, there is a discontinuity in the contour of the vertebral endplates, or even porosity, which often occurs on the anterior side of the vertebral endplates. After 3 weeks of disease onset, with the spread of the disease toward the vertebrae and discs and the loss of bone mass, dissolution of the vertebral endplates and narrowing or even collapse of the intervertebral space occur. Loss of intervertebral space height is greater in PS than in TS, intervertebral space destruction is greater in TS than in PS, and confined gas can be present around the lamina in BS. Complications such as scoliosis, kyphosis, and spondylolisthesis can be diagnosed radiographically after 3 months of disease onset due to the destruction of the physiologic structure of the vertebral body as a result of the loss of bone mass and secondary disc infections, as well as the regeneration of new sclerotic bone or even disc collapse of the severely damaged endplate bony surfaces [12,13]. Although radiographs are of little diagnostic value for negative findings in the weeks following NVO, we still use radiographs as an initial examination because patients can rely on them to rule out other diseases that cause back pain [14].
Computed tomography (CT) can provide a complete anatomical view of the vertebrae and can show the morphology of the vertebral body and bone sclerosis, which is of great significance in the late stages of NVO when the bone marrow edema has subsided; however, the sensitivity and specificity of CT for NVO is much lower than that of MRI (Table 1). CT can be negative in the early stages of NVO, which is not very useful for the diagnosis. When the disease progresses, CT typically shows partial loss of the endplates, hypodense discs with inflammatory changes, and significant bone destruction and defects in the vertebral body [12]. Although CT is not listed as the first choice for the diagnosis of NVO, CT examination is still usually performed before MRI examination due to its ability to visualize the original lesion. In the study by Liu et al, respective CT comparisons of PS and BS were done, as well as CT comparisons of PS and TS. In the CT images of PS vs BS, it was found that PS was more likely to involve the anterior, middle, and even posterior parts of the vertebral body than was BS, while BS was more likely to involve the periphery of the vertebral body as well as the anterior and posterior parts of the vertebral body; perivertebral sclerosis was less frequent in BS than in PS, and that PS was more likely to cause extensive vertebral body lesions than BS; and isolated anterior or posterior vertebral body wall disruption was more favorable for the diagnosis of BS. Comparison of CT images between PS and TS revealed that PS often involved lumbar vertebral segments, whereas TS often involved thoracolumbar vertebral segments, the degree of destruction of the vertebral body was often deeper and more extensive in TS than in PS, and the extent of regenerative sclerotic bone around the TS lesion was often more extensive than in PS [15,16].
Diagnostic Value of MRI in NVO
MRI is the diagnostic choice for NVO, with a sensitivity of up to 100% and a specificity of up to 91.7% [17–19]. In the early stages of NVO, MRI can show inflammation-induced vertebral and disc edema, which is usually characterized by a low signal on T1-weighted (T1WI) and a high signal on T2-weighted imaging (T2WI) (the upper part of the inferior horn can also be affected by inflammation), as well as a short Tau inversion recovery (STIR) of the infected vertebrae and discs that is slightly higher than the surrounding vertebral body’s signal. The next stage of NVO is the progression of vertebral destruction with the extension of the infection into the intravertebral canal and paravertebral soft tissues, with the possible formation of epidural and paravertebral abscesses. Lesions appear as homogeneous or nonhomogeneous hyperintense on T2WI, and T1 fat suppression removes the fat signal and avoids its interference. In addition, appropriate use of intravenous contrast can show the extent of infection spread in the paraspinal as well as epidural areas. Finally, the vertebral lesions appear ossified and show low signal on T1 and T2, with localized residual high signal.
Pyogenic Spondylitis
PS is an inflammatory disease of the vertebral body, the intervertebral disc, and even the peripheral tissues of the vertebrae caused by bacterial infection. Due to the nonspecific radiological findings in the early stage of PS, it is more difficult to distinguish PS from Modic type I [14]. Modic type I shows a low signal in T1WI and a high signal in T2WI, which is almost the same as the signal intensity in the early stage of NVO. Modic type I is composed of vascularized granulation tissues, which have high water content, so it is difficult to distinguish it from early NVO in images. In NVO, the large infiltration of inflammatory cells in the bone marrow inflammatory tissue results in a small extracellular volume, and the diffusion of water molecules is not very strong. Whereas in Modic I, on the contrary, the vascular fibrous tissues replace the bone marrow tissues completely, resulting in the diffusion of water molecules with high strength. As a result, Modic I have a higher gray scale rating in diffusion-weighted imaging (DWI) than NVO [20,21]. In the study of Patel et al, 73 patients with MR imaging features similar to Modic type 1 degeneration were studied and examined by DWI, and the presence of a well-defined linear high-signal region at the junction of normal and abnormal bone marrow was an identification of degenerative lesions, whereas the absence of this sign was strongly suggestive of NVO [22].
It is well known that the differences between PS and TS depend on the virulence of the pathogen, invasive protein hydrolysis, and the host immune response. Variable host interactions with low-virulence bacteria or weaker protein hydrolysis will result in atypical forms of spondylitis that can mimic tuberculosis or even metastatic masses. The common pathogen of PS is
In the further course of the disease, there is a loss of disc height, progressive osteolysis, and further destruction of the subchondral endplates [26]. In the study by Frel et al, the vast majority of vertebrae involved in PS showed diffuse enhancement on T2WI imaging, compared with TS, an observation that has been confirmed in other studies [27,28]. However, comparative studies of intervertebral disc destruction and the extent of its destruction have not reached uniform conclusions. In the study by Frel et al, the extent of destruction of the involved discs did not differ between the PS and TS groups, while Gupta et al [29] concluded that the extent of intervertebral disc destruction was significantly higher in TS than in PS, and Galhotra et al [27] concluded that the PS was more severe than TS in terms of intervertebral disc destruction, which was more severe. From the statistical data (Table 2), Gupta et al [29] and Galhotra et al [27] reached opposite conclusions despite the small difference in the delayed diagnosis values of their study populations. The study group of Frel et al [24] had a long delayed diagnosis, and a long delayed diagnosis resulted in sufficient time for
With the further spread of pathogenic bacteria, involvement of paravertebral soft tissues also becomes characteristic of PS, and there is a high probability that paravertebral abscesses will not appear as well-defined areas in contrast enhancement with lumbar muscle abscesses [27,28,31]. In the study by Galhotra et al [27], the cervical spine became the most common site of involvement in PS due to the consecutive involvement of the cervical spine by retropharyngeal abscesses, skull base osteomyelitis, or dorsal cervical carbuncles, which is contrary to the finding that PS tends to involve the lumbar spine [26,32,33]. However, Lee et al [31] and Frel et al [24] found a greater tendency to involve the thoracolumbar spine in PS, and these findings suggest that the uncertainty of the lesion adds to the difficulty of distinguishing PS from TS. For the relatively rare jump lesions of PS, Shroyer et al [32] suggested that the possibility of epidural infection occurring in more than just 1 segment of the spine should be considered and argued for the importance of whole-spine imaging. The findings of Galhotra et al [27] and Lee et al [19] showed that PS involved 2 and more vertebrae at a staggering rate of 83.4% and 98%, which directly validates the importance of whole-spine imaging.
Tuberculous Spondylitis
Differential diagnosis of TS is important for clinical management, especially in those with spinal bone destruction. Atypical spinal tuberculosis, including skip multifocal spinal tuberculosis, can be misdiagnosed as a neoplastic lesion or other infectious spondylitis, leading to delayed treatment [31,34]. Spinal tumors tend to involve vertebral bodies and posterior elements, which cannot be strongly differentiated from the variable imaging features of TS. Due to the edema of the lesion in the early stage of TS vs the primary tumor in the vertebral body, the metastatic tumor restricts the diffusion of water molecules and has a low apparent diffusion coefficient, whereas the destruction of the vertebral body as well as the intervertebral discs occurs after the further development of TS, and the apparent diffusion increases, and the grayscale signals are weaker than those of the spinal tumors on the DWI images. The presence of one or more signals in the vertebral body with a subcutaneous-fat-like brightness on the T1WI imaging implies the lesion may be a non-metastatic tumor. The presence of a high-signal rim around a low-signal lesion in the vertebral body on T2WI imaging suggests that the lesion may be a metastatic tumor [35,36]. When the metastatic tumor involves the spinal canal, it is difficult to distinguish it from intraspinal tuberculosis. In adults, tuberculosis balls and metastatic tumors show equal signals on T1WI and slightly higher signals on T2WI, and both involve the entire spinal column and are prone to meningitis and hydrocephalus; however, there is a significant difference between the two, and the well-defined and limited thickened portion of the meninges in extramedullary lesions is suggestive of metastatic carcinoma [37]. Recent studies have shown that the QuantiFERON-TB Gold In-Tube (QFT-GIT) test exhibits good sensitivity and specificity for the diagnosis of spinal tuberculosis, making it an important tool for preoperative differential diagnosis. A new threshold of 1.58 IU/mL for the QFT-GIT test has been found to improve diagnostic efficacy. A multidisciplinary diagnostic approach including histopathologic examination and mycobacterial culture is necessary for accurate diagnosis and early treatment of spinal tuberculosis. In conclusion, MRI is still the method of choice in the diagnosis of spinal tuberculosis [38], and it is meaningful to study and summarize the MRI imaging features of TS.
In advanced TS lesions, the subligamentous spread of tuberculous abscesses under the anterior longitudinal ligament appears to be a characteristic feature of spinal tuberculosis with high diagnostic accuracy. Massive cold abscess formation and the presence of protein hydrolases lead to gradual elevation of the longitudinal ligament away from the vertebral body, resulting in a kind of sublimated spread of the TS [31,39]. In the study by Gupta et al [29], thoracic spine involvement, posterior component involvement, and spinal deformity were considered independent predictors for the diagnosis of tuberculous spondylitis, and paravertebral abscesses were greater with lumbar abscesses than with PS. However, Batirel et al [42] analyzed data from a large sample of TS and found that the lumbar spine was involved in a greater proportion than the thoracic spine, which does not seem to support the notion that thoracic spine involvement is an independent diagnostic factor for TS, while other results confirm the findings of Gupta et al. As the inflammation caused by
Brucellar Spondylitis
Brucella colonizes the vertebral body through the paravertebral plexus of the Bastard vein and the nutrient arteries, which results in a rapid spread of the infection throughout the vertebral body, which displays a diffuse high signal on T2WI. In addition, Brucella destroys the vertebral endplates at an early stage and relies on phagocytosis and osteoclasts for replication, evading the host’s immune response, inhibiting apoptosis of infected monocytes, suppressing the activation of T cells, blocking dendritic cell activation, and preventing the activation of dendritic cells. Activation, impeding dendritic cell maturation, and impairing the resorptive capacity of osteoclasts provide the conditions for Brucella to maintain chronic infection, which determine the relative preservation of the vertebral body in the acute and chronic phases of BS. Divergent bacilli deficient in protein hydrolases severely erode the endplate, and the formation of caseous dead bone obliterates the possibility of new bone production, presenting a heterogeneous high signal near the uneven endplate on T2WI [44–48]. Li et al [33] found that acute PS infection was more likely to show diffuse and endplate inflammatory reaction lines than was chronic BS, and the use of DWI can differentiate acute PS from chronic BS. Meanwhile, several papers pointed out that most of the affected areas of PS and TS were consistent with water signal intensity on T2WI, due to inflammation, and a few TS and PS might show mixed signals on T2WI, due to therapeutic interventions [26,27,39]. While
Fungal Spondylitis
FS is often associated with immunocompromised patient status and has a long course, which needs to be differentiated from other types of NVO [53]. FS has a low incidence of subligamentous spread of infection, which also results in a low incidence of jump-diffusion, in contrast to TS, which is favored by jump metastases [53]. Because patients are immunocompromised and the virulence of the causative organisms is generally low, the inflammatory response caused by FS is not very strong, resulting in high signal loss in T2WI of abscesses and infected vertebrae. Two studies indicated that FS can present with no disc destruction, which is easily confused with TS [44,53]. However, FS is prone to complications such as extensive soft meningitis, spinal cord edema, and spinal cord cavitation [44], which may be related to the water hammer effect proposed in Gardner’s hydrodynamic theory [54]. Frel et al [24] pointed out that TS has the possibility of segmental meningeal enhancement, which should be distinguished. In addition, the inherent paramagnetic and ferromagnetic elements of the fungus can result in the appearance of a subendplate low-signal band shadowing on T2WI, which is characteristic of FS and not present in other types of NVO [53].
Diagnostic Value of Positron Emission Tomography for NVO
Some patients who have certain implants or foreign bodies, often ferromagnetic items, are usually unable to undergo MRI, which is one of the main reasons for limiting the use of MRI for NVO. In 2000, positron emission tomography (PET) combined with fluorodeoxyglucose (FDG) was first applied in the examination of TS and was found to be able to differentiate between bone and soft tissue infections [55]. In 2002, when the combination of PET and FDG was widely used in the diagnosis of various infectious diseases, Stumpe et al used this technique for the first time in the diagnosis of spinal infections and measured its specificity and sensitivity to be 100%; however, the small sample size of this study was not sufficient to draw definitive conclusions [56]. In the same year, in a study by Gratz et al, the combined use of FDG and PET for the diagnosis of NVO had a higher sensitivity, specificity, and accuracy than other imaging findings, especially the 67-Ga combined bone scan, which had been used for the evaluation of discitis but was not as effective as 18F-FDG-PET/CT, due to interference from tumors and non-inflammatory diseases. The authors recommended that once NVO is detected, it should be detected immediately by combined FDG and PET/CT to better visualize the area of infection (Table 3) [57–59]. In 2015, Fuster et al found that SUVmax quantification should be used to correct for background SUVmean, a move that significantly improved the discrimination between infected and noninfected areas [60]. However, these studies did not address the time of symptom onset vs the time of imaging, and all patients in the study by Kouijzer et al were taken for MRI vs 18F-FDG-PET/CT within 48 h. The results showed that the sensitivity, specificity, positive predictive value, and negative predictive value of the 2 examinations were 100%, 83.3%, 90.9%, 100%, and 100%, respectively, and 91.7%, 95.2%, and 100%, respectively, with no significant difference, which also suggests that both MRI and 18F-FDG-PET/CT examinations have high value for NVO examination, and the uptake of 18F-FDG at the lesion is higher than that at the periphery of the lesion. The results demonstrated that 18F-FDG-PET/CT could also be used to differentiate infection from degeneration. A study by Smids et al confirmed that MRI should be preferred for epidural and spinal abscesses and that 18F-FDG-PET/CT is more sensitive for the detection of paravertebral abscesses, lumbar muscle abscesses, and metastatic abscesses, which is the same as the findings of Kouijzer et al. This also suggests that 18F-FDG-PET/CT in combination with MRI, as a new imaging technique, can be used as a good combination, thus providing a high diagnostic value [18,19]. Gallium-67 combined with MRI or PET/CT has been increasingly studied in the diagnosis of NVO, and the old technique of technetium-99m in combination with MRI or PET/CT has been used relatively less often because gallium radiography is more reliable than technetium-99m. However, recent studies have confirmed that gallium-67 in combination with technetium-99m is more specific than gallium-67 alone [61].
Artificial Intelligence Applications and the Future
Machine learning is a branch of artificial intelligence (AI). There are numerous classifications of machine learning, and those applied in the field of spine surgery include classification and regression trees, linear models, support vector machine, and deep learning (Figure 2). Deep Learning in turn includes artificial neural networks, convolutional neural networks (CNNs), deep neural networks, recurrent neural networks, and the latest transformer model [62,63]. Among the many classifications in AI, CNNs can automatically learn representative features from images to perform classification tasks [64]. The developed automatic spine segmentation system and fracture detection software are examples of practical applications of CNNs [65].
In 2018, Kim et al [66] used the deep convolutional neural network (DCNN) technique for the first time to classify PS vs TS, and through this study initially demonstrated that the DCNN classifier has comparable performance with skilled imaging physicians in distinguishing PS vs TS using MRI images. However, the study had many drawbacks, such as using only cross-sectional images and not sagittal images, which are commonly used in clinical work, using a pre-trained DCNN model, insufficient number of cases, and uneven image quality. Several factors led to the model not being successfully applied in the clinic, and the DCNN model was not trained from scratch, which suggests that the potential of DCNN in the diagnosis of NVO has not been fully exploited. Unfortunately, this is the only study involving the use of CNNs for NVO classification. In 2023, Mukaihata et al used CNNs to differentiate between PS and spinal Modic alterations in MRI images, and a total of 50 patients’ MRI images were included in the modeling. The final results were also satisfactory, with the diagnostic accuracies of T1WI and STIR images being significantly higher than those of clinical physicians [67].
Conclusions
In this paper, we describe the imaging manifestations of different NVOs based on the respective characteristics of different pathogens and the physiological structure of the spine. PS, TS, BS, and FS present unique features on images according to their different periods, infection ranges, and degrees of destruction (Table 4). Kim et al [66] applied CNN for the first time to differentiate between PS and TS in 2018, and achieved good predictive results, which demonstrates the ability of AI to handle complex NVO images; however, the study did not fully stimulate the potential capabilities of CNNs. The great potential of CNNs to assist in the diagnosis of NVOs remains to be further exploited, which will also improve the efficiency of clinical decision making.
Figures
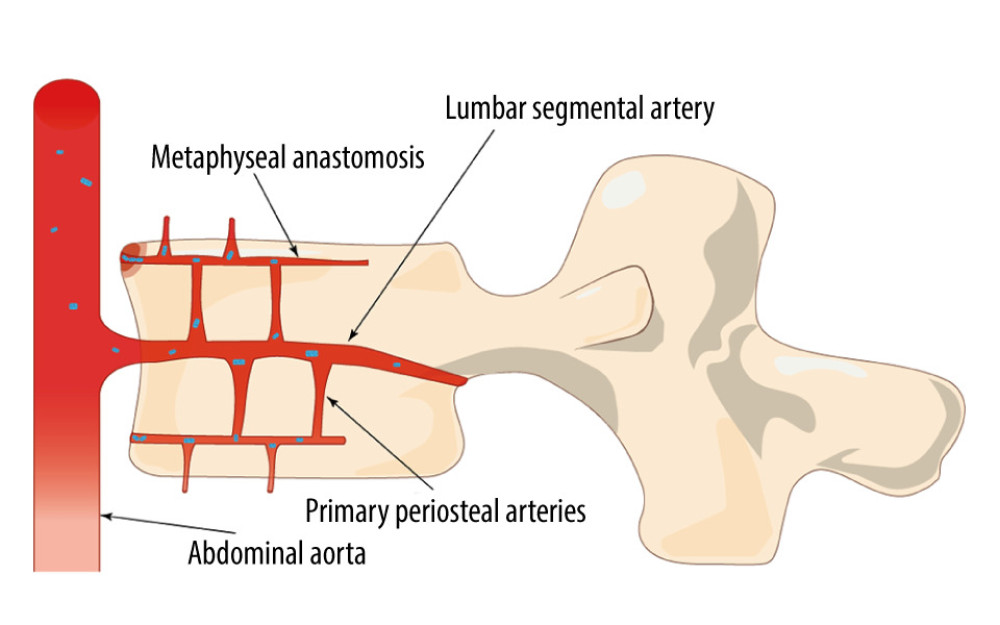 Figure 1. Bacteria colonize the anterior edge of the upper vertebral plate, which has a rich blood supply, in the direction of blood flow (Adobe Illustrator 2022. 26.5. Adobe Inc.).
 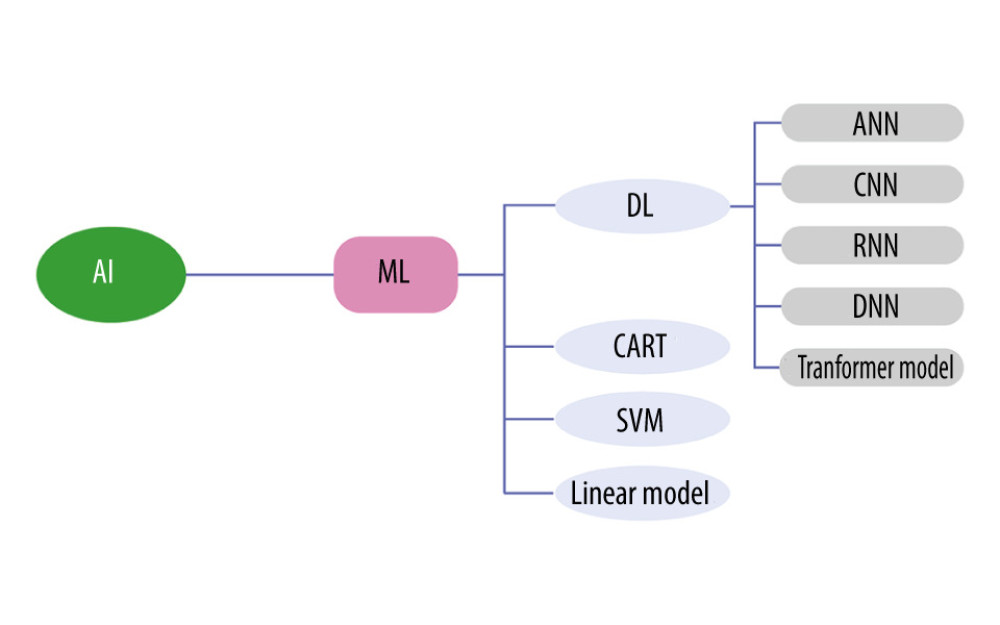 Figure 2. Artificial intelligence technology already used in spine surgery (Adobe Illustrator 2022. 26.5. Adobe Inc.).
 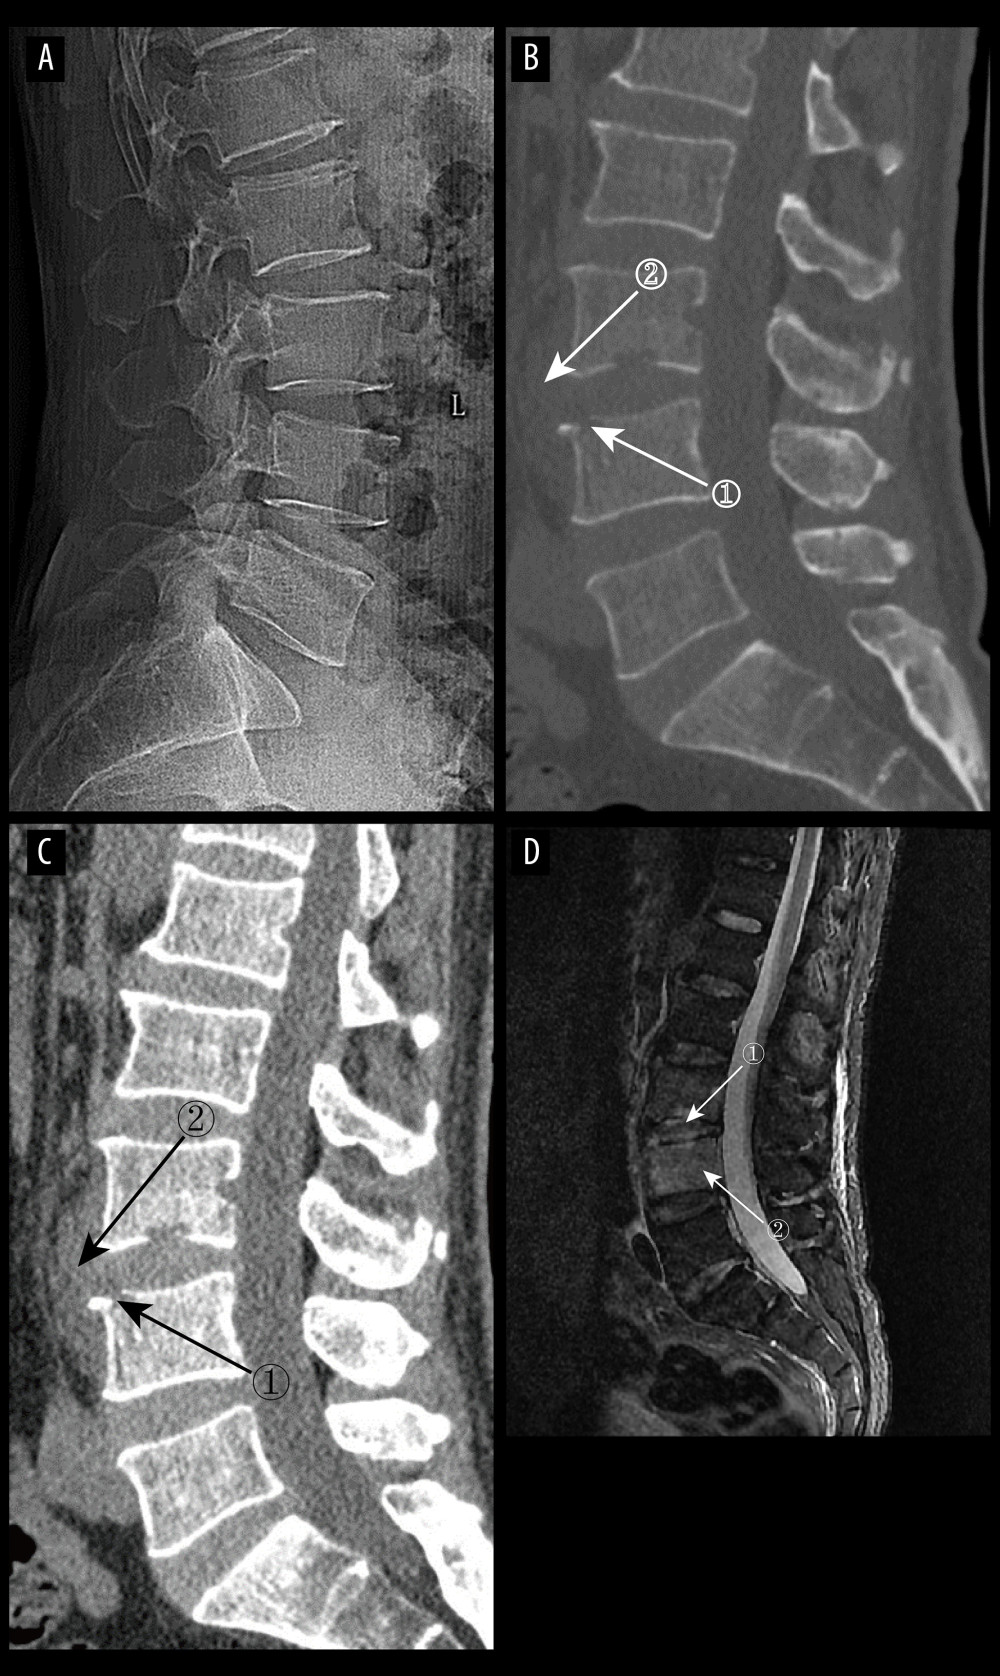 Figure 3. (A) pyogenic spondylitis (PS) early plain radiograph. No significant narrowing of the lumbar spinal space was seen. (A–D) Images of the same patient, who presented with 9 days of low back pain. (B, C) Plain and enhanced computed tomography in early PS. Marker 1 in both images shows poorly defined bony margins on the anterosuperior margin of the L4 vertebral body, and marker 2 shows swelling of the surrounding soft tissues (D) Magnetic resonance imaging in early stages of PS. Marker 1 shows disc erosion, and marker 2 shows diffuse infection of the L4 vertebral body (Adobe Illustrator 2022. 26.5. Adobe Inc.).
 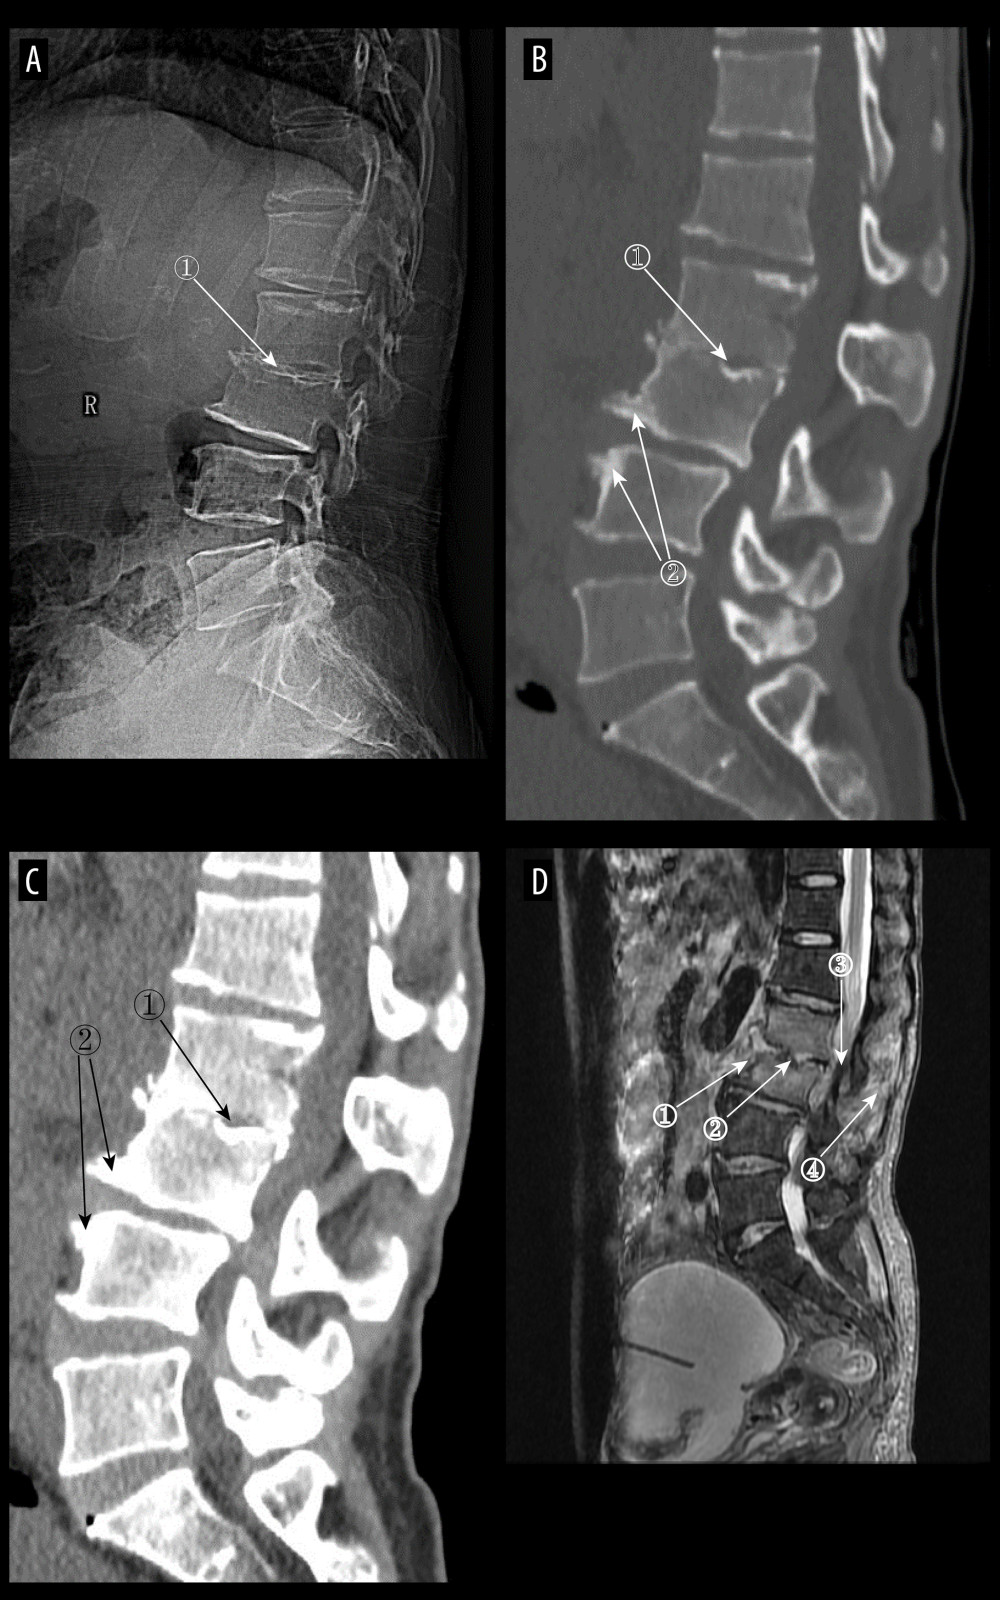 Figure 4. (A) Plain radiographs of late pyogenic spondylitis (PS). Marker 1 shows severe narrowing of the L2–3 intervertebral space, with bony hyperplasia and sharpening of the vertebral margins. (A–D) Images of the same patient, with 42 days between onset of symptoms and the time of the radiograph. (B, C) Plain and enhanced computed tomography in late-stage PS. Marker 1 shows marked narrowing of the L2–3 intervertebral space, and marker 2 shows rough and blurred edges of the L3–L4 vertebral body with osteolytic changes. (D) Magnetic resonance imaging of late PS. Osteolysis of the anterior margin of L3 is shown at marker 1, severe narrowing of the L2–3 intervertebral space is shown at marker 2, osteophytes of the small joints are shown at marker 3, and high signal of the lumbar attachments is shown at marker 4 (Adobe Illustrator 2022. 26.5. Adobe Inc.).
 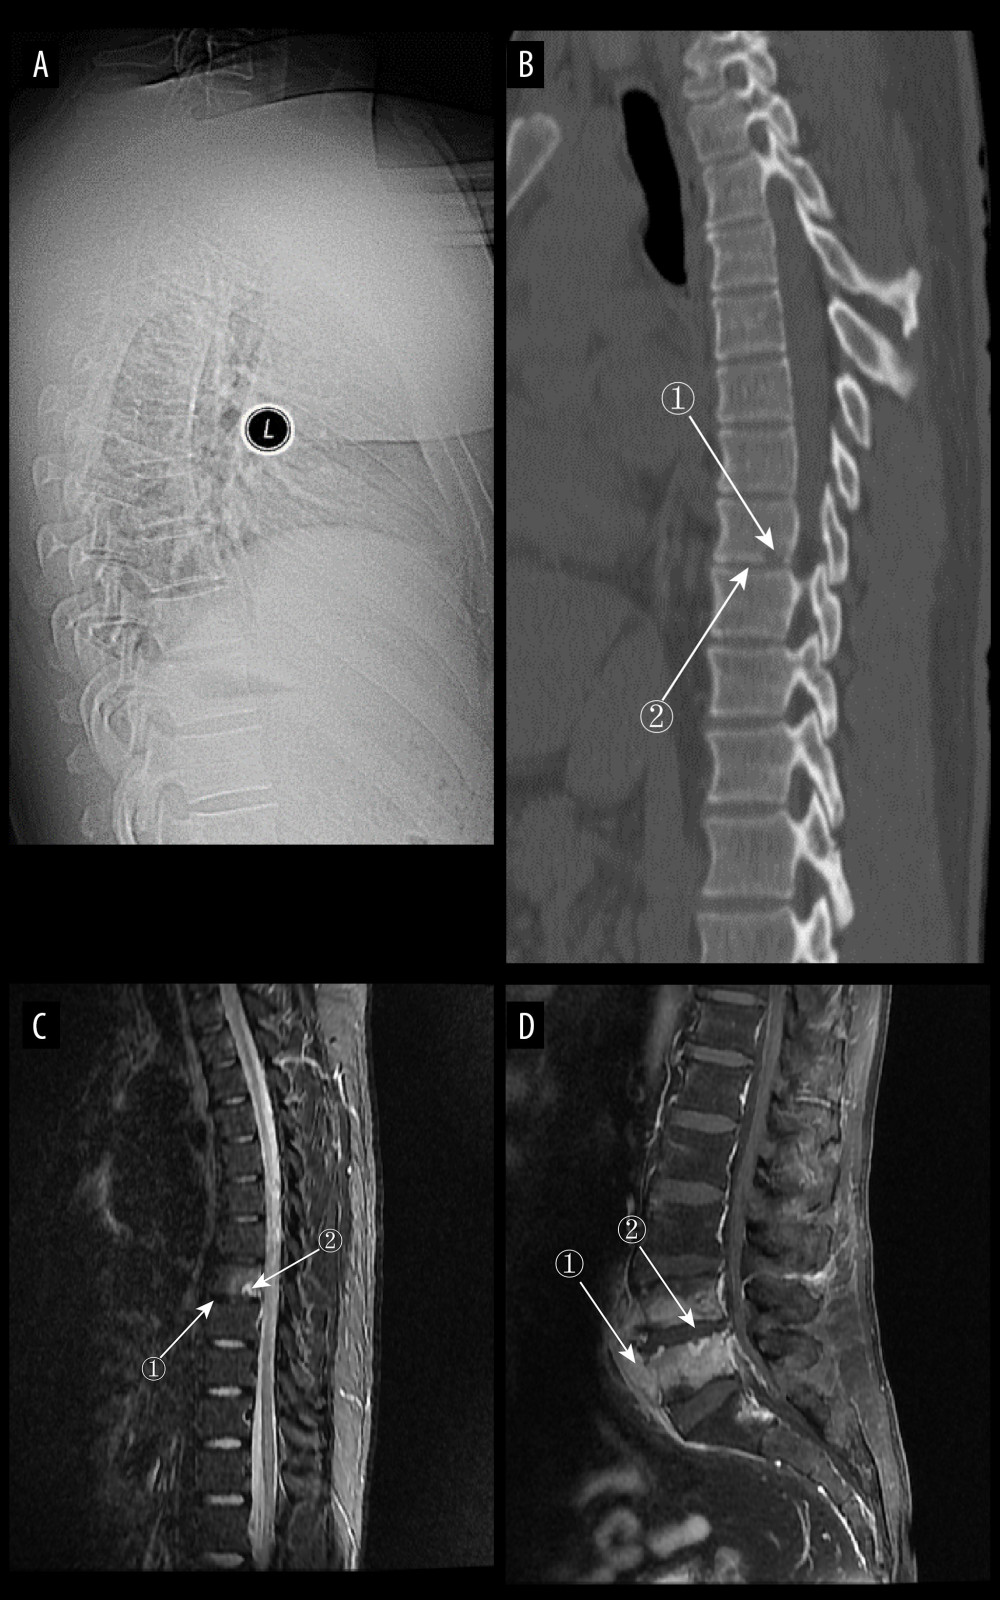 Figure 5. (A) Plain radiograph of early tuberculous spondylitis (TS). No abnormal vertebral changes. (A–C) Images of the same patient, with an interval of 120 days between onset of symptoms and the first radiograph. (B) Plain computed tomography in early TS. There is a less dense lesion with poorly defined borders and no obvious sclerotic bands at marker 1, and an uneroded disc is visible at marker 2. (C) Magnetic resonance imaging (MRI) in early stages of TS. Marker 1 shows that the disc has not received erosion and marker 2 shows an abnormal high signal lesion in the T8 vertebral body. (D) MRI in early stages of TS. Marker 1 shows an abnormally reinforcing shadow in the paravertebral soft tissue, and marker 2 shows relative preservation of the disc, at 120 days between symptom onset and radiograph in this patient (Adobe Illustrator 2022. 26.5. Adobe Inc.).
 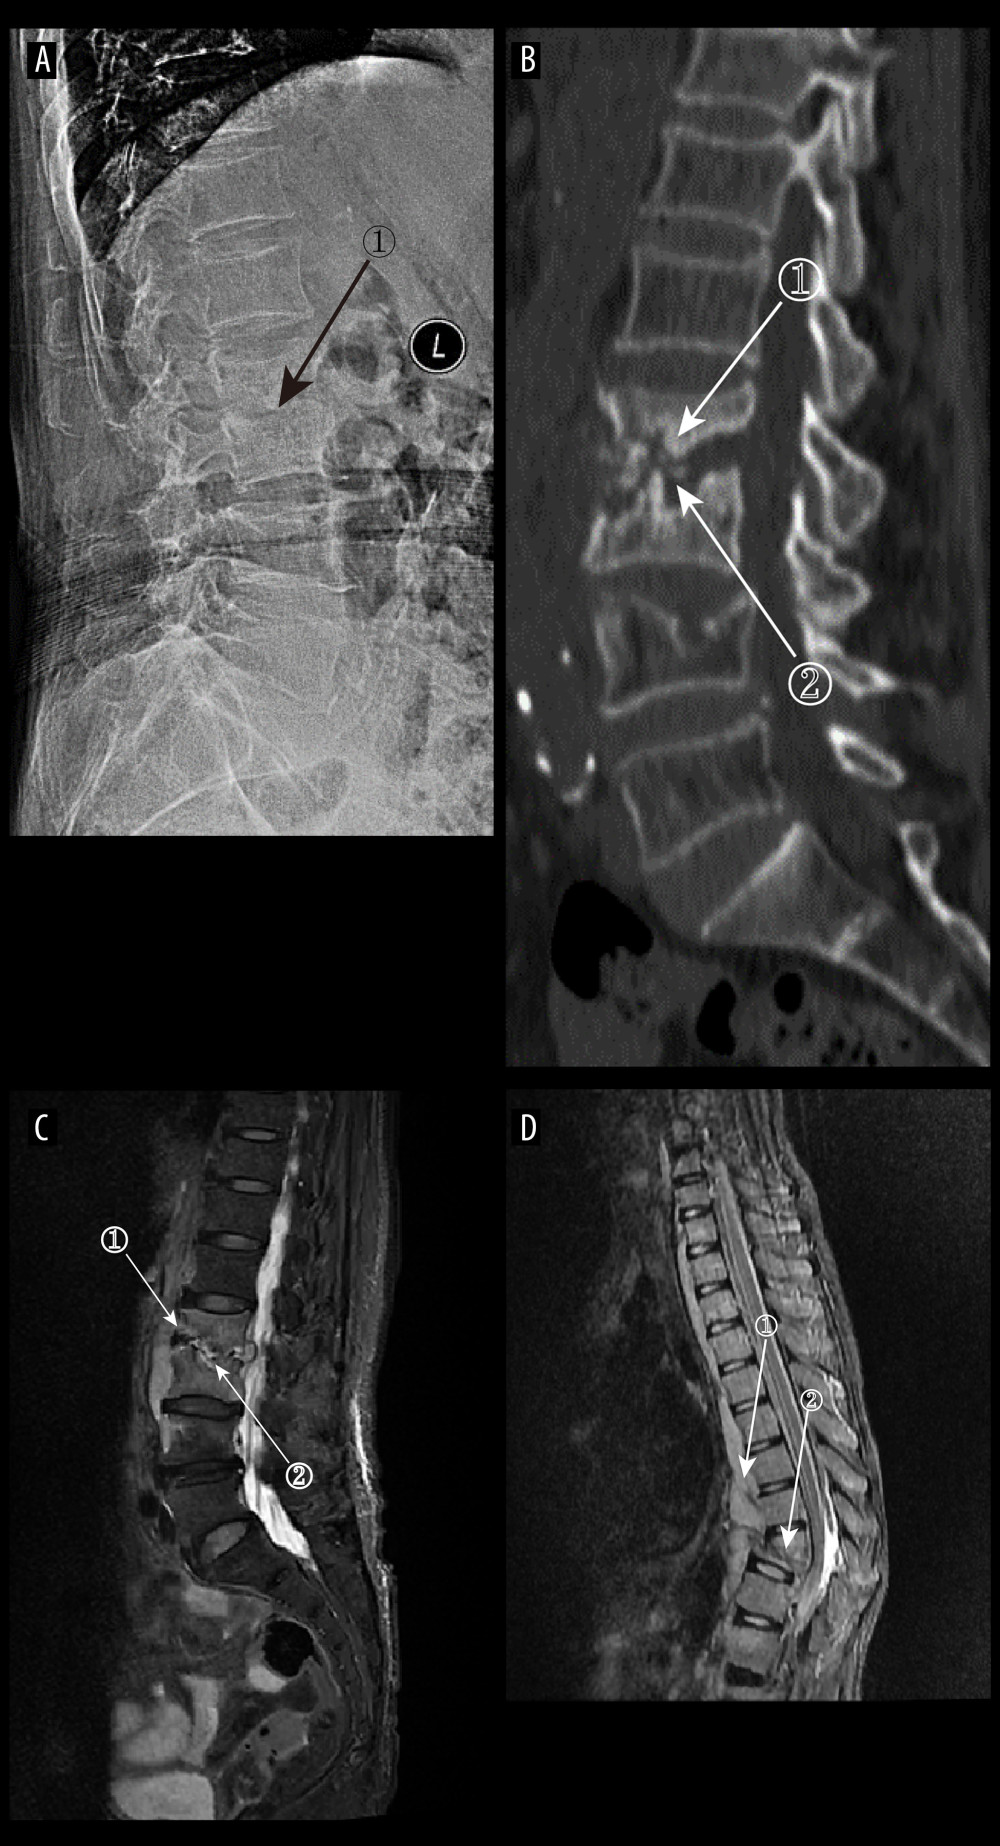 Figure 6. (A) Plain radiographs of late tuberculous spondylitis (TS). Marker 1 shows narrowing of the L2–3 intervertebral space, dysmorphism of the L2 vertebral body, and osteophytes on the margins. (A–C) Images of the same patient, with an interval of 210 days between the onset of the disease and the radiographs. (B) Plain computed tomography in late-stage TS. Markers 1 and 2 show severe bone destruction at the lower edge of the L2 vertebral body and the upper edge of the L3 vertebral body, narrowing of the L2–3 intervertebral space, and free osteolysis. (C) Magnetic resonance imaging (MRI) of late TS. Marker 1 shows abnormal signal in the paravertebral region, and marker 2 shows bone destruction at the opposite edges of the L2 and L3 vertebrae. (D) MRI of late TS. Marker 1 shows sublimated spreading of an abscess under the anterior longitudinal ligament, and marker 2 shows thoracic vertebral deformity. This is an image of a patient who was approximately 130 days from the onset of symptoms to radiography (Adobe Illustrator 2022. 26.5. Adobe Inc.).
 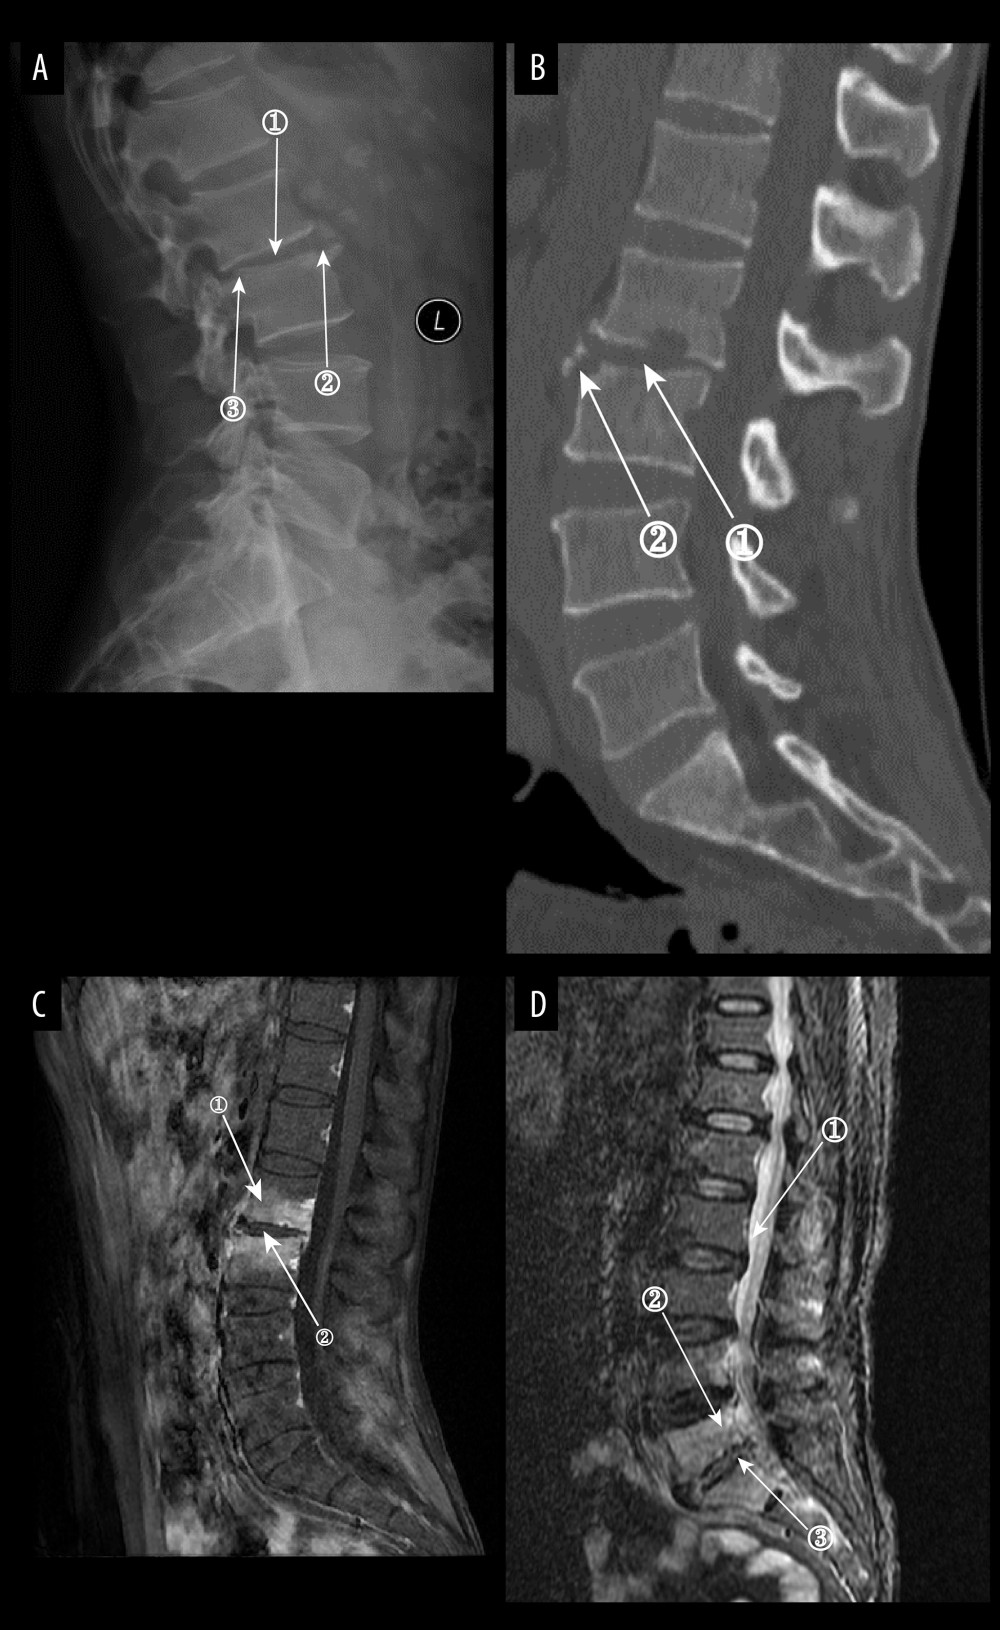 Figure 7. (A) Plain radiographs of late Borrelia burgdorferi spondylitis (BS). Marker 1 shows a decrease in the height of the intervertebral space, marker 2 shows osteophytes on the margins of the vertebral body, and marker 3 shows a slight forward displacement of the L3 vertebral body. (A–D) Images of the same patient, with an interval of approximately 120 days between the onset of symptoms and the time of the radiograph. (B) Plain computed tomography in late BS. In both figures, Marker 1 shows a decrease in the height of the intervertebral space, and marker 2 shows hyperplasia of the anterior margin of the vertebrae. (C) Magnetic resonance imaging (MRI) of late BS. This image is a T1-enhanced image showing abnormal signal in the vertebral body at marker 1 and reduced intervertebral space height in the vertebral body at marker. (D) MRI of late BS. Density at marker 1 is 54, marker 2 shows diffuse infection of the vertebral body with a density of 37, and marker 3 shows an infected disc. The time between the onset of this patient’s disease and the radiograph is about 2 years. (ITK-SNAP. Version 4.0.2. Paul Yushkevich, Jilei Hao, Alison Pouch, Sadhana Ravikumar et al at the Penn Image Computing and Science Laboratory; Adobe Illustrator 2022. 26.5. Adobe Inc.).
 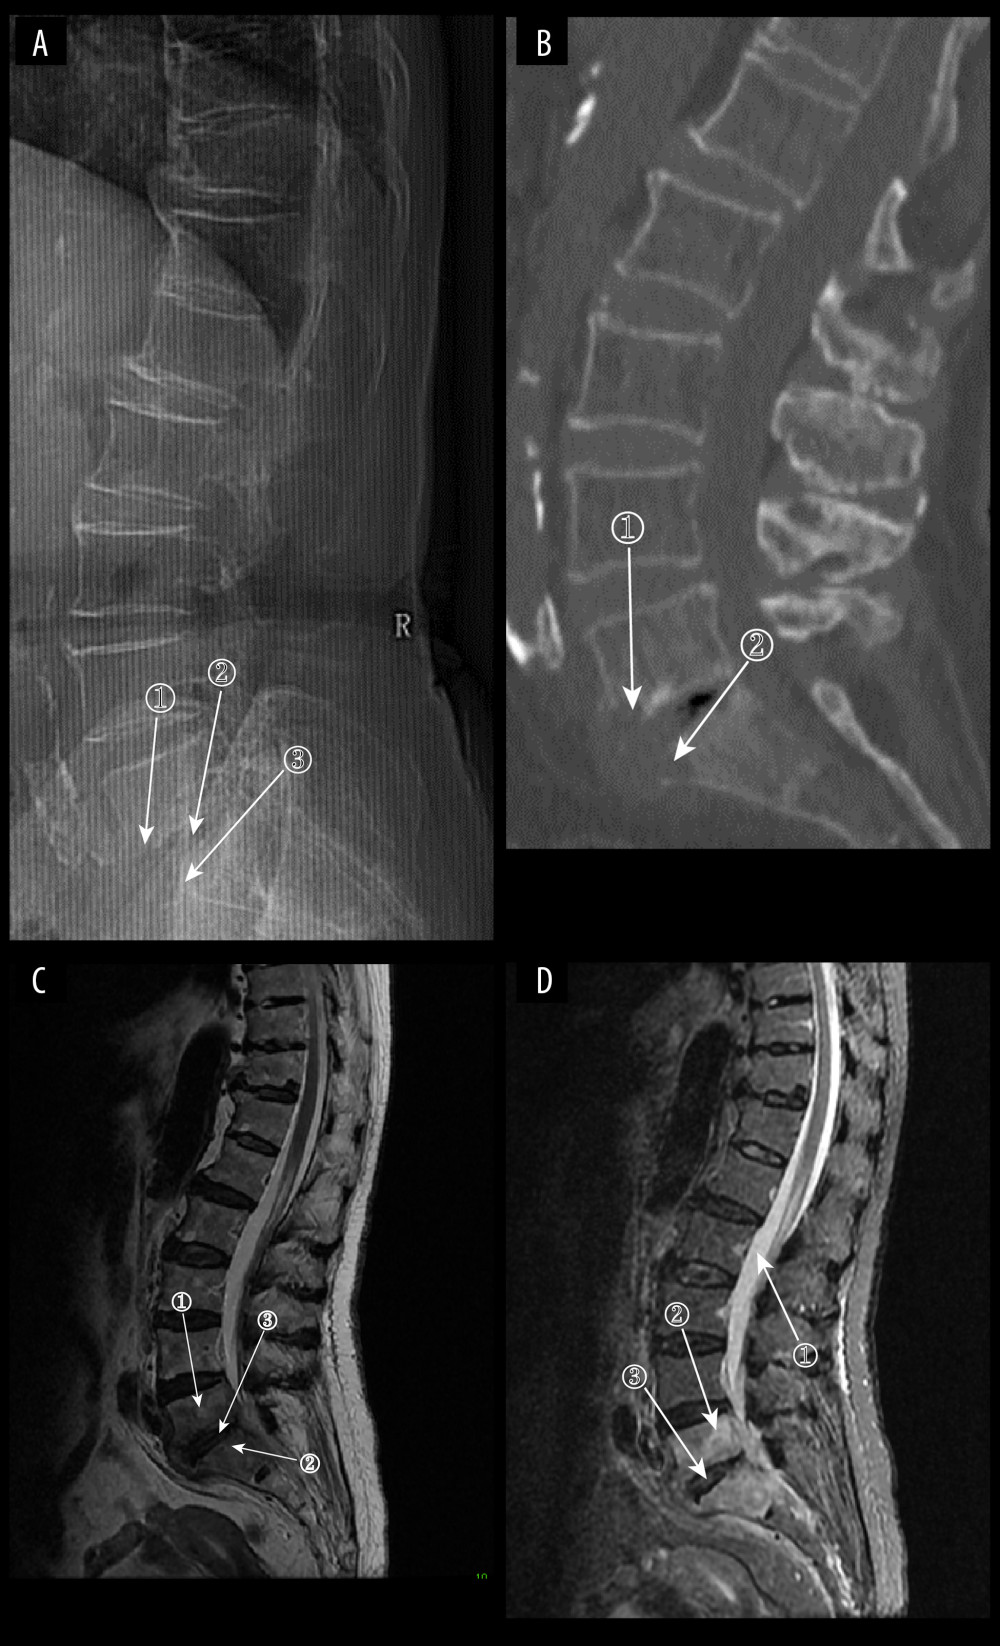 Figure 8. (A) Plain radiograph of early fungal spondylitis (FS). Markers 1 and 3 show localized bone destruction at L5–S1, and marker 2 shows no significant narrowing of the intervertebral space. (A–C) Images of the same patient, who had an interval of approximately 30 days between the onset of symptoms and the time of the radiographs. (B) Plain computed tomography in early FS. Bone destruction is seen in the margins of the L5–S1 vertebrae at markers 1 and. (C) Magnetic resonance imaging (MRI) in early stages of FS. This image is a T2WI sequence. A small intraosseous abscess is shown at marker 1, a striated shadow under the vertebral endplate is shown at marker 2, and an infected disc is shown at marker. (D) MRI in early stages of FS. This image is a short Tau inversion recovery (STIR) sequence. Density at marker 1 is 376, marker 2 shows diffuse high signal in the vertebral body with a density of 312, which is lower than the cerebrospinal fluid density value, and marker 3 shows a relatively preserved intervertebral space height (ITK-SNAP. Version 4.0.2. Paul Yushkevich, Jilei Hao, Alison Pouch, Sadhana Ravikumar et al at the Penn Image Computing and Science Laboratory; Adobe Illustrator 2022. 26.5. Adobe Inc.).
 Tables
Table 1. Plain radiograph and computed tomography imaging characteristics of native vertebral osteomyelitis.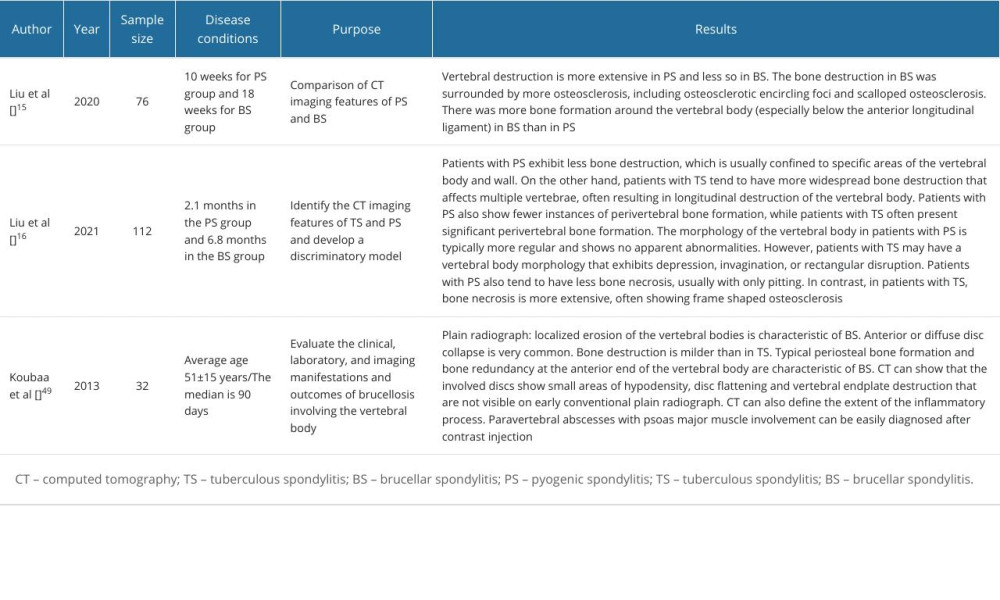 Table 2. Application of magnetic resonance imaging in native vertebral osteomyelitis.
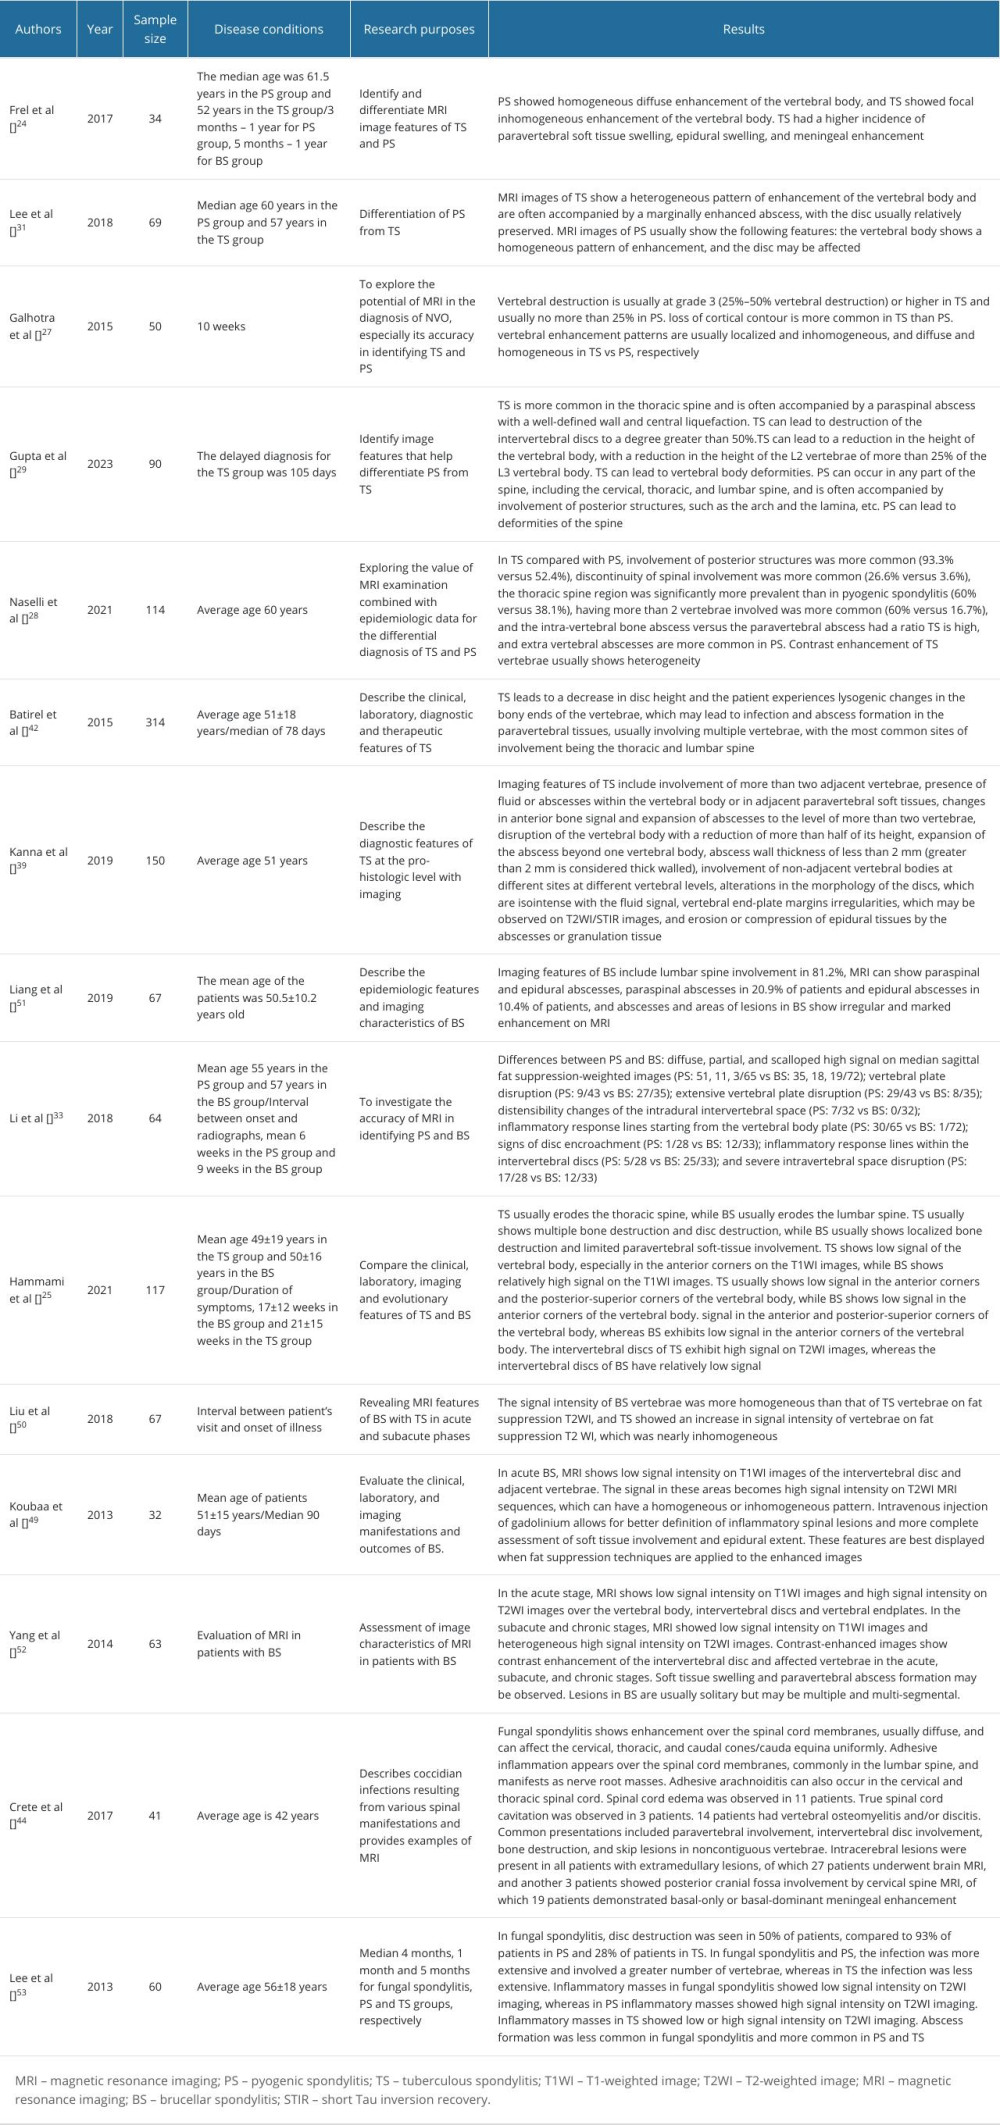 Table 3. The application of PET-CT and artificial intelligence in the diagnosis of native vertebral osteomyelitis.
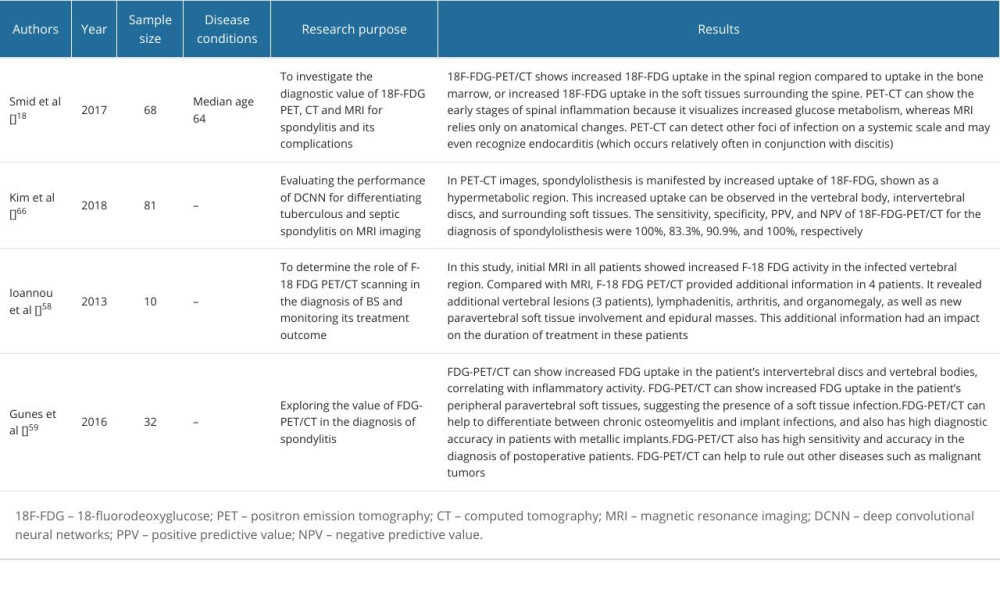 Table 4. Characterization of common NVO types.
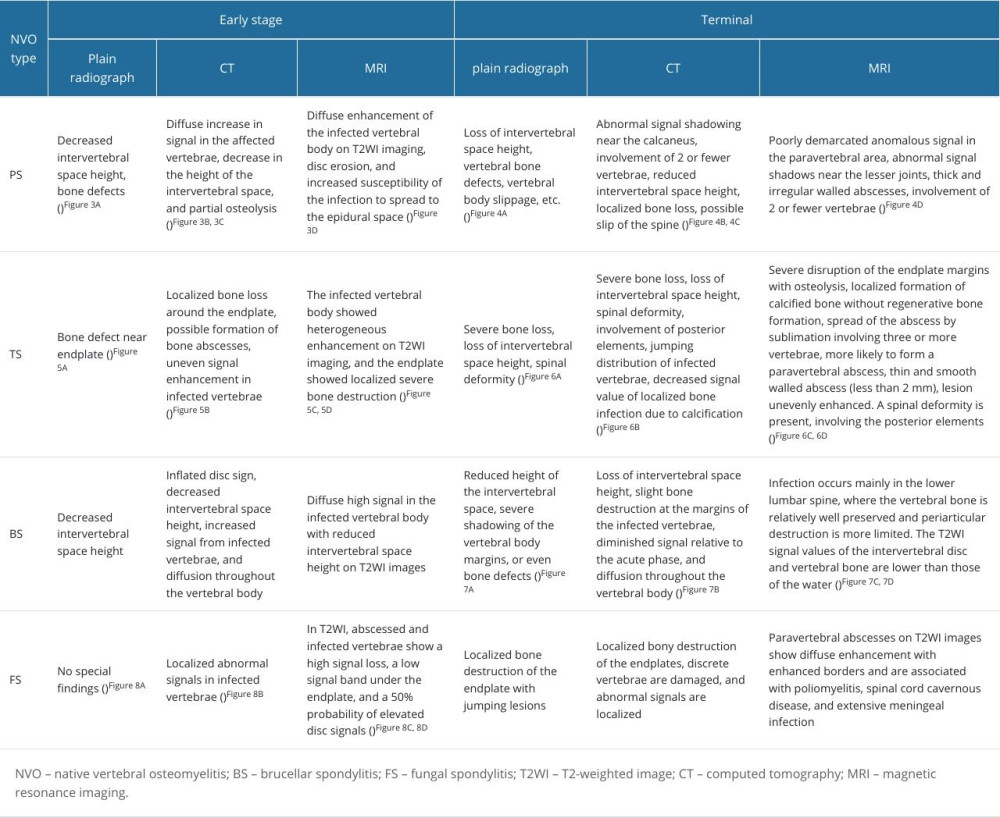
References
1. Zimmerli W, Clinical practice. Vertebral osteomyelitis: N Engl J Med, 2010; 362; 1022-29
2. Colmenero JD, Jimenez-Mejias ME, Sanchez-Lora FJ, Pyogenic, tuberculous, and brucellar vertebral osteomyelitis: A descriptive and comparative study of 219 cases: Ann Rheum Dis, 1997; 56; 709-15
3. Segreto FA, Beyer GA, Grieco P, Vertebral osteomyelitis: A comparison of associated outcomes in early versus delayed surgical treatment: Int J Spine Surg, 2018; 12; 703-12
4. Waheed G, Soliman MAR, Ali AM, Aly MH, Spontaneous spondylodiscitis: Review, incidence, management, and clinical outcome in 44 patients: Neurosurg Focus, 2019; 46; E10
5. Maamari J, Tande AJ, Diehn F, Diagnosis of vertebral osteomyelitis: J Bone Jt Infect, 2022; 7; 23-32
6. Berbari EF, Kanj SS, Kowalski TJ, 2015 Infectious Diseases Society of America (IDSA) clinical practice guidelines for the diagnosis and treatment of native vertebral osteomyelitis in adults: Clin Infect Dis, 2015; 61; e26-46
7. Berg-Johansen B, Han M, Fields AJ, Cartilage endplate thickness variation measured by ultrashort echo-time MRI is associated with adjacent disc degeneration: Spine (Phila Pa 1976), 2018; 43; E592-E600
8. Lotz JC, Fields AJ, Liebenberg EC, The role of the vertebral end plate in low back pain: Global Spine J, 2013; 3; 153-64
9. Crock HV, Yoshizawa H, The blood supply of the lumbar vertebral column: Clin Orthop Relat Res, 1976(115); 6-21
10. Ratcliffe JF, The arterial anatomy of the developing human dorsal and lumbar vertebral body. A microarteriographic study: J Anat, 1981; 133(Pt 4); 625-38
11. Morales H, Infectious spondylitis mimics: Mechanisms of disease and imaging findings: Semin Ultrasound CT MR, 2018; 39; 587-604
12. Prodi E, Grassi R, Iacobellis F, Cianfoni A, Imaging in spondylodiskitis: Magn Reson Imaging Clin N Am, 2016; 24; 581-600
13. Sharif HS, Aideyan OA, Clark DC, Brucellar and tuberculous spondylitis: Comparative imaging features: Radiology, 1989; 171; 419-25
14. Diehn FE, Imaging of spine infection: Radiol Clin North Am, 2012; 50; 777-98
15. Liu X, Zheng M, Jiang Z, Computed tomography imaging characteristics help to differentiate pyogenic spondylitis from brucellar spondylitis: Eur Spine J, 2020; 29; 1490-98
16. Liu X, Zheng M, Sun J, Cui X, A diagnostic model for differentiating tuberculous spondylitis from pyogenic spondylitis on computed tomography images: Eur Radiol, 2021; 31; 7626-36
17. Fahnert J, Purz S, Jarvers JS, Use of simultaneous 18F-FDG PET/MRI for the detection of spondylodiskitis: J Nucl Med, 2016; 57; 1396-401
18. Smids C, Kouijzer IJE, Vos FJ, A comparison of the diagnostic value of MRI and 18F-FDG-PET/CT in suspected spondylodiscitis: Infection, 2017; 45; 41-49
19. Kouijzer IJE, Scheper H, de Rooy JWJ, The diagnostic value of (18)F-FDG-PET/CT and MRI in suspected vertebral osteomyelitis – a prospective study: Eur J Nucl Med Mol Imaging, 2018; 45; 798-805
20. Modic MT, Steinberg PM, Ross JS, Degenerative disk disease: Assessment of changes in vertebral body marrow with MR imaging: Radiology, 1988; 166; 193-99
21. Oztekin O, Calli C, Kitis O, Reliability of diffusion weighted MR imaging in differentiating degenerative and infectious end plate changes: Radiol Oncol, 2010; 44; 97-102
22. Patel KB, Poplawski MM, Pawha PS, Diffusion-weighted MRI “claw sign” improves differentiation of infectious from degenerative modic type 1 signal changes of the spine: AJNR Am J Neuroradiol, 2014; 35; 1647-52
23. Ahmad-Mansour N, Loubet P, Pouget C: Toxins (Basel), 2021; 13(10); 677
24. Frel M, Białecki J, Wieczorek J: Pol J Radiol, 2017; 82; 71-87
25. Hammami F, Koubaa M, Feki W: Asian Spine J, 2021; 15; 739-46
26. Bohdan I, Plakhtyr Z, Bohdan A, Early imaging and course-of-disease control markers of pyogenic vertebral osteomyelitis; 64; 124-37
27. Galhotra RD, Jain T, Sandhu P, Galhotra V, Utility of magnetic resonance imaging in the differential diagnosis of tubercular and pyogenic spondylodiscitis: J Nat Sci Biol Med, 2015; 6; 388-93
28. Naselli N, Facchini G, Lima GM, MRI in differential diagnosis between tuberculous and pyogenic spondylodiscitis: Eur Spine J, 2022; 31; 431-41
29. Gupta N, Kadavigere R, Malla S, Differentiating tubercular from pyogenic causes of spine involvement on Magnetic Resonance Imaging: Infez Med, 2023; 31; 62-69
30. Kerro Dego O, van Dijk JE, Nederbragt H: Vet Q, 2002; 24; 181-98
31. Lee Y, Kim BJ, Kim SH, Comparative analysis of spontaneous infectious spondylitis: Pyogenic versus tuberculous: J Korean Neurosurg Soc, 2018; 61(1); 81-88
32. Shroyer S, Boys G, April MD, Imaging characteristics and CT sensitivity for pyogenic spinal infections: Am J Emerg Med, 2022; 58; 148-53
33. Li T, Li W, Du Y, Discrimination of pyogenic spondylitis from brucellar spondylitis on MRI: Medicine (Baltimore), 2018; 97; e11195
34. Na S, Lyu Z, Zhang S, Diagnosis and treatment of skipped multifocal spinal tuberculosis lesions: Orthop Surg, 2023; 15; 1454-67
35. Schweitzer ME, Levine C, Mitchell DG, Bull’s-eyes and halos: Useful MR discriminators of osseous metastases: Radiology, 1993; 188; 249-52
36. Compagnone D, Cecchinato R, Pezzi A, Diagnostic approach and differences between spinal infections and tumors: Diagnostics (Basel), 2023; 13(17); 2737
37. Li Q, Song J, Li X, Differentiation of intraspinal tuberculosis and metastatic cancer using magnetic resonance imaging: Infect Drug Resist, 2020; 13; 341-49
38. Hu X, Zhang H, Li Y, Analysis of the diagnostic efficacy of the QuantiFERON-TB Gold In-Tube assay for preoperative differential diagnosis of spinal tuberculosis: Front Cell Infect Microbiol, 2022; 12; 983579
39. Kanna RM, Babu N, Kannan M, Diagnostic accuracy of whole spine magnetic resonance imaging in spinal tuberculosis validated through tissue studies: Eur Spine J, 2019; 28; 3003-10
40. Ma W, Jin W, He X: Front Cell Infect Microbiol, 2022; 12; 780272
41. Kaur K, Sharma S, Abhishek S: J Infect, 2023; 86; 134-46
42. Batirel A, Erdem H, Sengoz G, The course of spinal tuberculosis (Pott disease): Results of the multinational, multicentre Backbone-2 study: Clin Microbiol Infect, 2015; 21(11); 1008.e9-e18
43. Souza CGd, Gasparetto EL, Marchiori E, Bahia PRV, Pyogenic and tuberculous discitis: Magnetic resonance imaging findings for differential diagnosis: Radiologia Brasileira, 2013; 46; 173-77
44. Crete RN, Gallmann W, Karis JP, Ross J, Spinal coccidioidomycosis: MR imaging findings in 41 patients: Am J Neuroradiol, 2018; 39(11); 2148-53
45. Hong SH, Choi JY, Lee JW, MR imaging assessment of the spine: Infection or an imitation?: Radiographics, 2009; 29; 599-612
46. de Figueiredo P, Ficht TA, Rice-Ficht A, Pathogenesis and immunobiology of brucellosis: Review of Brucella-host interactions: Am J Pathol, 2015; 185; 1505-17
47. Huy TXN, Nguyen TT, Kim H: Microorganisms, 2022; 10(10); 2003
48. Khalaf OH, Chaki SP, Garcia-Gonzalez DG: Infect Immun, 2020; 88(4); e00822-19
49. Koubaa M, Maaloul I, Marrakchi C, Spinal brucellosis in South of Tunisia: Review of 32 cases: Spine J, 2014; 14; 1538-44
50. Liu X, Li H, Jin C, Differentiation between brucellar and tuberculous spondylodiscitis in the acute and subacute stages by MRI: A retrospective observational study: Academic Radiology, 2018; 25; 1183-89
51. Liang C, Wei W, Liang X, Spinal brucellosis in Hulunbuir, China, 2011–2016: Infect Drug Resist, 2019; 12; 1565-71
52. Yang X, Zhang Q, Guo X, Value of magnetic resonance imaging in brucellar spondylodiscitis: Radiologia Medica, 2014; 119; 928-33
53. Lee SW, Lee SH, Chung HW: Am J Roentgenol, 2013; 201; 872-77
54. Lammering JC, Iv M, Gupta N, Imaging spectrum of CNS coccidioidomycosis: Prevalence and significance of concurrent brain and spinal disease: Am J Roentgenol, 2013; 200; 1334-46
55. Schmitz A, Kalicke T, Willkomm P, Use of fluorine-18 fluoro-2-deoxy-D-glucose positron emission tomography in assessing the process of tuberculous spondylitis: J Spinal Disord, 2000; 13; 541-44
56. Stumpe KD, Zanetti M, Weishaupt D, FDG positron emission tomography for differentiation of degenerative and infectious endplate abnormalities in the lumbar spine detected on MR imaging: Am J Roentgenol, 2002; 179; 1151-57
57. Gratz S, Dorner J, Fischer U, 18F-FDG hybrid PET in patients with suspected spondylitis: Eur J Nucl Med Mol Imaging, 2002; 29; 516-24
58. Ioannou S, Chatziioannou S, Pneumaticos SG, Fluorine-18 fluoro-2-deoxy-D-glucose positron emission tomography/computed tomography scan contributes to the diagnosis and management of brucellar spondylodiskitis: BMC Infect Dis, 2013; 13; 73
59. Gunes BY, Onsel C, Sonmezoglu K, Diagnostic value of F-18 FDG PET/CT in patients with spondylodiscitis: Is dual time point imaging time worthy?: Diagn Microbiol Infect Dis, 2016; 85(3); 381-85
60. Fuster D, Tomas X, Mayoral M, Prospective comparison of whole-body (18)F-FDG PET/CT and MRI of the spine in the diagnosis of haematogenous spondylodiscitis: Eur J Nucl Med Mol Imaging, 2015; 42; 264-71
61. Maamari J, Grach SL, Passerini M, The use of MRI, PET/CT, and nuclear scintigraphy in the imaging of pyogenic native vertebral osteomyelitis: A systematic review and meta-analysis: Spine J, 2023; 23; 868-76
62. Chang M, Canseco JA, Nicholson KJ, The role of machine learning in spine surgery: The future is now: Front Surg, 2020; 7; 54
63. Charles YP, Lamas V, Ntilikina Y, Artificial intelligence and treatment algorithms in spine surgery: Orthop Traumatol Surg Res, 2023; 109; 103456
64. Hallinan J, Zhu L, Yang K, Deep learning model for automated detection and classification of central canal, lateral recess, and neural foraminal stenosis at lumbar spine MRI: Radiology, 2021; 300; 130-38
65. Burns JE, Yao J, Summers RM, Vertebral body compression fractures and bone density: Automated detection and classification on CT images: Radiology, 2017; 284; 788-97
66. Kim K, Kim S, Lee YH, Performance of the deep convolutional neural network based magnetic resonance image scoring algorithm for differentiating between tuberculous and pyogenic spondylitis: Sci Rep, 2018; 8; 13124
67. Mukaihata T, Maki S, Eguchi Y, Differentiating magnetic resonance images of pyogenic spondylitis and spinal modic change using a convolutional neural network: Spine (Phila Pa 1976), 2023; 48; 288-94
Figures
Figure 1. Bacteria colonize the anterior edge of the upper vertebral plate, which has a rich blood supply, in the direction of blood flow (Adobe Illustrator 2022. 26.5. Adobe Inc.).Figure 2. Artificial intelligence technology already used in spine surgery (Adobe Illustrator 2022. 26.5. Adobe Inc.).Figure 3. (A) pyogenic spondylitis (PS) early plain radiograph. No significant narrowing of the lumbar spinal space was seen. (A–D) Images of the same patient, who presented with 9 days of low back pain. (B, C) Plain and enhanced computed tomography in early PS. Marker 1 in both images shows poorly defined bony margins on the anterosuperior margin of the L4 vertebral body, and marker 2 shows swelling of the surrounding soft tissues (D) Magnetic resonance imaging in early stages of PS. Marker 1 shows disc erosion, and marker 2 shows diffuse infection of the L4 vertebral body (Adobe Illustrator 2022. 26.5. Adobe Inc.).Figure 4. (A) Plain radiographs of late pyogenic spondylitis (PS). Marker 1 shows severe narrowing of the L2–3 intervertebral space, with bony hyperplasia and sharpening of the vertebral margins. (A–D) Images of the same patient, with 42 days between onset of symptoms and the time of the radiograph. (B, C) Plain and enhanced computed tomography in late-stage PS. Marker 1 shows marked narrowing of the L2–3 intervertebral space, and marker 2 shows rough and blurred edges of the L3–L4 vertebral body with osteolytic changes. (D) Magnetic resonance imaging of late PS. Osteolysis of the anterior margin of L3 is shown at marker 1, severe narrowing of the L2–3 intervertebral space is shown at marker 2, osteophytes of the small joints are shown at marker 3, and high signal of the lumbar attachments is shown at marker 4 (Adobe Illustrator 2022. 26.5. Adobe Inc.).Figure 5. (A) Plain radiograph of early tuberculous spondylitis (TS). No abnormal vertebral changes. (A–C) Images of the same patient, with an interval of 120 days between onset of symptoms and the first radiograph. (B) Plain computed tomography in early TS. There is a less dense lesion with poorly defined borders and no obvious sclerotic bands at marker 1, and an uneroded disc is visible at marker 2. (C) Magnetic resonance imaging (MRI) in early stages of TS. Marker 1 shows that the disc has not received erosion and marker 2 shows an abnormal high signal lesion in the T8 vertebral body. (D) MRI in early stages of TS. Marker 1 shows an abnormally reinforcing shadow in the paravertebral soft tissue, and marker 2 shows relative preservation of the disc, at 120 days between symptom onset and radiograph in this patient (Adobe Illustrator 2022. 26.5. Adobe Inc.).Figure 6. (A) Plain radiographs of late tuberculous spondylitis (TS). Marker 1 shows narrowing of the L2–3 intervertebral space, dysmorphism of the L2 vertebral body, and osteophytes on the margins. (A–C) Images of the same patient, with an interval of 210 days between the onset of the disease and the radiographs. (B) Plain computed tomography in late-stage TS. Markers 1 and 2 show severe bone destruction at the lower edge of the L2 vertebral body and the upper edge of the L3 vertebral body, narrowing of the L2–3 intervertebral space, and free osteolysis. (C) Magnetic resonance imaging (MRI) of late TS. Marker 1 shows abnormal signal in the paravertebral region, and marker 2 shows bone destruction at the opposite edges of the L2 and L3 vertebrae. (D) MRI of late TS. Marker 1 shows sublimated spreading of an abscess under the anterior longitudinal ligament, and marker 2 shows thoracic vertebral deformity. This is an image of a patient who was approximately 130 days from the onset of symptoms to radiography (Adobe Illustrator 2022. 26.5. Adobe Inc.).Figure 7. (A) Plain radiographs of late Borrelia burgdorferi spondylitis (BS). Marker 1 shows a decrease in the height of the intervertebral space, marker 2 shows osteophytes on the margins of the vertebral body, and marker 3 shows a slight forward displacement of the L3 vertebral body. (A–D) Images of the same patient, with an interval of approximately 120 days between the onset of symptoms and the time of the radiograph. (B) Plain computed tomography in late BS. In both figures, Marker 1 shows a decrease in the height of the intervertebral space, and marker 2 shows hyperplasia of the anterior margin of the vertebrae. (C) Magnetic resonance imaging (MRI) of late BS. This image is a T1-enhanced image showing abnormal signal in the vertebral body at marker 1 and reduced intervertebral space height in the vertebral body at marker. (D) MRI of late BS. Density at marker 1 is 54, marker 2 shows diffuse infection of the vertebral body with a density of 37, and marker 3 shows an infected disc. The time between the onset of this patient’s disease and the radiograph is about 2 years. (ITK-SNAP. Version 4.0.2. Paul Yushkevich, Jilei Hao, Alison Pouch, Sadhana Ravikumar et al at the Penn Image Computing and Science Laboratory; Adobe Illustrator 2022. 26.5. Adobe Inc.).Figure 8. (A) Plain radiograph of early fungal spondylitis (FS). Markers 1 and 3 show localized bone destruction at L5–S1, and marker 2 shows no significant narrowing of the intervertebral space. (A–C) Images of the same patient, who had an interval of approximately 30 days between the onset of symptoms and the time of the radiographs. (B) Plain computed tomography in early FS. Bone destruction is seen in the margins of the L5–S1 vertebrae at markers 1 and. (C) Magnetic resonance imaging (MRI) in early stages of FS. This image is a T2WI sequence. A small intraosseous abscess is shown at marker 1, a striated shadow under the vertebral endplate is shown at marker 2, and an infected disc is shown at marker. (D) MRI in early stages of FS. This image is a short Tau inversion recovery (STIR) sequence. Density at marker 1 is 376, marker 2 shows diffuse high signal in the vertebral body with a density of 312, which is lower than the cerebrospinal fluid density value, and marker 3 shows a relatively preserved intervertebral space height (ITK-SNAP. Version 4.0.2. Paul Yushkevich, Jilei Hao, Alison Pouch, Sadhana Ravikumar et al at the Penn Image Computing and Science Laboratory; Adobe Illustrator 2022. 26.5. Adobe Inc.). Tables
Table 1. Plain radiograph and computed tomography imaging characteristics of native vertebral osteomyelitis.Table 2. Application of magnetic resonance imaging in native vertebral osteomyelitis.Table 3. The application of PET-CT and artificial intelligence in the diagnosis of native vertebral osteomyelitis.Table 4. Characterization of common NVO types.Table 1. Plain radiograph and computed tomography imaging characteristics of native vertebral osteomyelitis.Table 2. Application of magnetic resonance imaging in native vertebral osteomyelitis.Table 3. The application of PET-CT and artificial intelligence in the diagnosis of native vertebral osteomyelitis.Table 4. Characterization of common NVO types. In Press
08 Mar 2024 : Animal Research
Modification of Experimental Model of Necrotizing Enterocolitis (NEC) in Rat Pups by Single Exposure to Hyp...Med Sci Monit In Press; DOI: 10.12659/MSM.943443
18 Apr 2024 : Clinical Research
Comparative Analysis of Open and Closed Sphincterotomy for the Treatment of Chronic Anal Fissure: Safety an...Med Sci Monit In Press; DOI: 10.12659/MSM.944127
08 Mar 2024 : Laboratory Research
Evaluation of Retentive Strength of 50 Endodontically-Treated Single-Rooted Mandibular Second Premolars Res...Med Sci Monit In Press; DOI: 10.12659/MSM.944110
11 Mar 2024 : Clinical Research
Comparison of Effects of Sugammadex and Neostigmine on Postoperative Neuromuscular Blockade Recovery in Pat...Med Sci Monit In Press; DOI: 10.12659/MSM.942773
Most Viewed Current Articles
17 Jan 2024 : Review article
Vaccination Guidelines for Pregnant Women: Addressing COVID-19 and the Omicron VariantDOI :10.12659/MSM.942799
Med Sci Monit 2024; 30:e942799
14 Dec 2022 : Clinical Research
Prevalence and Variability of Allergen-Specific Immunoglobulin E in Patients with Elevated Tryptase LevelsDOI :10.12659/MSM.937990
Med Sci Monit 2022; 28:e937990
16 May 2023 : Clinical Research
Electrophysiological Testing for an Auditory Processing Disorder and Reading Performance in 54 School Stude...DOI :10.12659/MSM.940387
Med Sci Monit 2023; 29:e940387
01 Jan 2022 : Editorial
Editorial: Current Status of Oral Antiviral Drug Treatments for SARS-CoV-2 Infection in Non-Hospitalized Pa...DOI :10.12659/MSM.935952
Med Sci Monit 2022; 28:e935952