15 September 2020: Clinical Research
Cluster Analysis of the Associations among Physical Frailty, Cognitive Impairment and Mental Disorders
Ljiljana Trtica Majnarić12ACDEF, Sanja Bekić34ABDEF*, František Babič5CDEG, Ľudmila Pusztová5CDE, Ján Paralič5CDEGDOI: 10.12659/MSM.924281
Med Sci Monit 2020; 26:e924281


Abstract
BACKGROUND: Physical frailty, cognitive impairment, and symptoms of anxiety and depression frequently co-occur in later life, but, to date, each has been assessed separately. The present study assessed their patterns in primary care patients aged ≥60 years.
MATERIAL AND METHODS: This cross-sectional study evaluated 263 primary care patients aged ≥60 years in eastern Croatia in 2018. Physical frailty, cognitive impairment, anxiety and depression, were assessed using the Fried phenotypic model, the Mini-Mental State Examination (MMSE), the Geriatric Anxiety Scale (GAS), and the Geriatric Depression Scale (GDS), respectively. Patterns were identified by latent class analysis (LCA), Subjects were assorted by age, level of education, and domains of psychological and cognitive tests to determine clusters.
RESULTS: Subjects were assorted into four clusters: one cluster of relatively healthy individuals (61.22%), and three pathological clusters, consisting of subjects with mild cognitive impairment (23.95%), cognitive frailty (7.98%), and physical frailty (6.85%). A multivariate, multinomial logistic regression model found that the main determinants of the pathological clusters were increasing age and lower mnestic functions. Lower performance on mnestic tasks was found to significantly determine inclusion in the three pathological clusters. The non-mnestic function, attention, was specifically associated with cognitive impairment, whereas psychological symptoms of anxiety and dysphoria were associated with physical frailty.
CONCLUSIONS: Clustering of physical and cognitive performances, based on combinations of their grades of severity, may be superior to modelling of their respective entities, including the continuity and non-linearity of age-related accumulation of pathologic conditions.
Keywords: Cluster Analysis, Frail Elderly, mild cognitive impairment, Primary Health Care, Aged, Aged, 80 and over, Comorbidity, Cross-Sectional Studies, Female, frailty, Geriatric Assessment, Humans, Male, Mental Disorders, Middle Aged
Background
Increased average life expectancy in many countries throughout the world has contributed to aging of the population, along with an increased burden of chronic diseases [1]. Chronic diseases, particularly in older people, rarely appear as single diseases, but rather as two or more coexisting diseases, a condition termed multimorbidity [2]. Current healthcare systems, however, focus on individual diseases or organ systems. Care for patients with multimorbidity is often insufficient, or even harmful, accounting for potentially conflicting recommendations resulting from the management of several individual conditions [3]. Attempts to implement more integrated care programmes for managing patients with multimorbidity have been compromised by a lack of knowledge on how to provide person-centred care to many of these patients [4]. There is a broad expert consensus on the need for new approaches better able to address the complexity of multimorbidity [5].
Current measures of multimorbidity, necessary for epidemiologic investigations, are based on enumerating chronic diseases, on estimating observed to expected ratios of the most common dyads or triads of chronic diseases, and on using weighted scores of single chronic conditions [6]. These measures are not able to capture some of the essential characteristics of multimorbidity, including clustering (associations that are not random), overlapping (sharing between individuals and patient groups), and associations with functional impairments [7]. More systematic approaches are needed to solve this challenging issue [8].
Clustering techniques based on machine learning applications, have recently emerged as promising new approaches in research on multimorbidity [9,10]. These methods group diseases or patients according to the likelihood of distributions, rather than according to disease labels, and are more reliable pathophysiologically, as the relevant patterns are detected without prior assumptions on classification criteria.
The dynamic interplay among chronic diseases and functional impairments, which are modulated by genetic, behavioural and environmental factors, as well as treatments, is thought to drive the progression of age-related declines in physical and cognitive performances [11]. Decline in physical performance is best defined by the concept of
Physical and cognitive impairments often coexist and interact mutually in later life, with each potentiating the effect of the other on the development of negative health-related outcomes [15]. Longitudinal epidemiologic studies have yielded many conflicting results on the associations of these disorders and their outcomes. These conflicting results are due in part to these disorders being assessed separatelly, and as individual entities, without knowledge on their appearance in individual persons and their potential associations [15,16]. A new concept,
Physical conditions in later life, especially in individuals with multimorbidity, have been closely associated with mental conditions, especially anxiety and depression, with these physical and mental conditions acting sinergistically to increase the probability of negative health-related outcomes [2,17,18]. Anxiety and depression in older people manifest as a variety of symptoms, including anxious feelings, dysphoria, apathy, worry, trouble sleeping, irritability, and fatigue [19–21]. These symptoms of anxiety and depression may overlap with each other, as well as with cognitive and physical conditions, making mental conditions more difficult to recognize in older persons, especially in primary care (PC) situations, in which patients present with different symptoms and morbidities. Consensus has been reached on the need for the systematic assessment of anxiety and depression in older PC patients, especially those with multiple chronic conditions [22].
The biological and clinical basis of frailty is not yet fully understood [23]. The addition of cognitive and psychological dimensions to the physical dimension of frailty has been shown insufficient to explain the full range of frailty. Knowledge of the patterns of physical frailty, cognitive impairment, and anxiety and depression in older people may help better understand the multidimensional nature of frailty, improving patient-centred prediction and prevention of negative health-related outcomes.
Material and Methods
STUDY DESIGN AND PARTICIPANTS:
This cross-sectional study was conducted from March to September 2018 in an academic General Practice (GP) facility in Osijek, a town of 70,000 inhabitants and the administrative centre of eastern Croatia. All patients aged ≥60 years who visited their doctor for any reason or who were invited to visit their doctor were enrolled in this study, if they provided written informed consent, until the necessary sample size was reached. Individuals with acute conditions or exacerbations of chronic conditions were excluded, as were those receiving chemotherapy or biological treatments, those with home care services, and those diagnosed with psychosis or dementia. Of the 470 patients from this age group registered on the GP’s list, 263 were included in this analysis.
Physical frailty, cognitive impairment, and mental disorders, including anxiety and depression were assessed in all participants using standard screening tools.
Residents of eastern Croatia have a higher burden of chronic diseases than residents of other areas in Croatia. This higher burden is likely due to poor economic conditions, high emigration rates, and aging of the population in the past few decades. The living conditions of older people residing in the town of Osijek are similar to those of older people elsewhere in eastern Croatia, with these individuals generally being of a lower socioeconomic status, but above the poverty line.
ETHICAL STATEMENT:
The study complied with the World Medical Association Declaration of Helsinki 2013. It was approved by the Ethics Committee of the Faculty of Medicine of the Josip Juraj Strossmayer University of Osijek (No. 641-01/18-01/01).
CALCULATION OF SAMPLE SIZE:
A statistical power analysis before the start of participant enrolment was performed using G*Power 3.1 (2007) and was based on two criteria: 1) the tau correlation coefficients between the tests used to assess participants’ cognitive and psychological conditions [24], and 2) the sample size required for latent class analysis (LCA) [25]. In both cases, there were no formal approaches, and several rules of thumb are proposed. Based on these proposed rules, a sample size of 250 participants was regarded as large enough to show statistical significance for less complex models, such as those utilized in this study [26,27].
SCREENING FOR PHYSICAL FRAILTY, COGNITIVE IMPAIRMENT, AND MENTAL DISORDERS (ANXIETY AND DEPRESSION):
Physical fraility was screened using Fried’s phenotype model, which relies on five measurable criteria: weight loss, slow walking speed, weak grip strength, subjective feeling of exhaustion, and reduced activity [13]. Subjects were classified by the number of positive criteria, with those meeting ≥3, 1–2, and 0 criteria considered frail, pre-frail, and robust, respectively.
Cognitive function was assessed using the Mini-Mental State Examination (MMSE), a cognitive test that has been broadly validated, including in the Croatian population [28]. This test is more sensitive for diagnosing severe cognitive impairment than for distinguishing between cognitively healthy individuals and those with MCI, and cannot distinguish between different types of dementia. During the examination, a health professional asks patients a range of simple questions, or tasks, designed to test everyday mental skills. The maximum score is 30, divided among several domains, which indicate memory-related and non-memory-related (executive) functions, including: orientation in space and time (10 points), registration (3 points), attention and calculation (5 points), recall (3 points), and language and praxis (9 points) [29]. MMSE cut-offs were adjusted according to the levels of education of the participants, using the MMSE cut-off values for the Croatian population. This cut-off was found to be 24/25 when screening older people in general, and 26/27 when screening highly educated older people, defined as those with ≥14 years of education [28].
Anxiety was screened using the Geriatric Anxiety Scale (GAS), originally a 25-item test, and depression was screened using the Geriatric Depression Scale (GDS), originally a 30-item test [30,31]. These tests were designed to detect anxiety and depression specifically among elderly persons, since they are better than other, similar tests in distinguishing between mental symptoms, and symptoms of cognitive and physical conditions.
Because these tests had not been validated in the Croatian population, their English language versions were translated into Croatian and back-translated into English. Their internal factor structure was assessed by confirmatory factor analysis (CFA) and several model fit indices. The CFA was conducted using Mplus 8.1, a statistical modelling software program.
The uni-dimensional 10-item model was found to be the best fitted model for the GAS test, whereas the two-factor 10-item model was the best fitted model for the GDS test, with the two factors for the latter being “dysphoria”, and (absence of) “positive mood“. The Croatian versions of the GAS and GDS models were in accordance with the validated versions for other European countries, and provided good fit for the data, with Cronbach’s alpha being 0.82 for the GAS test, and 0.81 and 0.80 for the two domains of the GDS test, respectively [32]. Moreover, the repeated CFA procedure, performed on a comparative sample of 181 subjects with similar characteristics, confirmed the stability of the obtained factorial structure.
STATISTICAL ANALYSES:
The LCA method was used to determine the optimal number of subgroups, or latent classes, that statistically and clinically significantly described the heterogeneity of participants in the sample, with respect to the measured variables [25]. Inclusion in a cluster was based on similar scoring patterns of participants, including their responses on the MMSE test, the new versions of the GAS and GDS tests, and Fried’s phenotype frailty score. A sequence of LCA models was fitted to the data. Because no single indicator reflected the optimal model fit, model selection was based on the balance between several fit indices, including: the Akaike Information Criterion (AIC), the Sample-Size Adjusted Bayesian Information Criterion (SS Adj. BIC), the Entropy index, and the Lo-Mandell-Rubin test (LMR) [33,34]. Lower values on the AIC and SS Adj. BIC indicated better model fit. The Entropy index should be >0.7, with values closer to 1 indicating better model fit. The LMR index iteratively compares two neighboring models, a model with k-classes, with a higher number of latent classes, and a model with k-1 classes, with a smaller number of latent classes. The final decision about the number of clusters was based on several criteria, including the numbers of individuals in the clusters, the likelihood of an individual’s membership in the cluster, and the interpretability of the clusters.
Differences in distributions of numerical variables among the clusters was analysed by one-way analysis of variance (ANOVA), followed by the Games-Howell post-hoc test to discriminate between particular pairs of clusters. Differences in categorical variables among the clusters were calculated using chi-square (χ2) test, except when the expected number of observations was less than 5, for which Fisher’s exact test was deemed more appropriate. Differences among the clusters in particular domains of the MMSE and the GAS and GDS tests were determined by the MANOVA method. For all tests, p<0.05 was defined as statistically significant.
The likelihood of an individual belonging of to a cluster was assessed using a multivariate, multinomial logistic regression (LR) model if the scores of particular domains of the MMSE were below average, and if scores of the new versions of the GAS and GDS tests were above average. Cluster 1, being the best functionally, was regarded as the control. The AIC was used to measure the quality of the model’s predictive performance. This model was based on evidence indicating that particular domains of the MMSE test can improve the ability to predict the progression of cognitive impairment, beyond the predictive validity of the total MMSE score [35]. A separate LR model was utilized to assess the dependence of an individual’s age and level of education to membership in a particular set of pathological clusters (clusters 2–4). The rationale for using this model was based on evidence showing associations between increasing age and low educational level with declines in both physical and cognitive performances [36].
Results
The results of LCA model fitting are summarized in Table 1. The LCA procedure based on “frailty” and MMSE tests provided several potentially appropriate solutions. However, when all four tests were included, including the GAS and the GDS tests, the LCA did not provide good fit indices or generate interpretable models. The relative goodness-of-fit indices favoured the four-class model, as suggested by the lowest values of the AIC and SSAdj.BIC indices and the highest value of the Entropy index. Comparisons of two neighbouring classes using the LMR index found that fit index value was significantly higher for the four-class than the three-class model, whereas the fit index value was not significantly higher for the three-class than the two-class model. The superiority of the four-class to the three-class model was also indicated by the finding that a larger number of classes provided additional opportunities to better distinguish among participants in the sample, making it preferable for interpretation.
The independence of latent classes (clusters) from each other was assessed using by ANOVA, in which clusters were independent variables and the average results on the “frailty” and MMSE tests were dependent variables (Table 2). Significant differences were observed for both dependent variables and for all clusters, except for clusters 3 and 4, which did not differ from each other in results on the “frailty” test (the post-hoc analysis).
Table 2 also shows that members of the “HF” cluster were significantly younger than those in other clusters, whereas participants in the “CF” cluster were significantly older than those in the “CI” cluster. Participants in cluster “PhyF” did not differ significantly in age from those in clusters “CI” and “CF”.
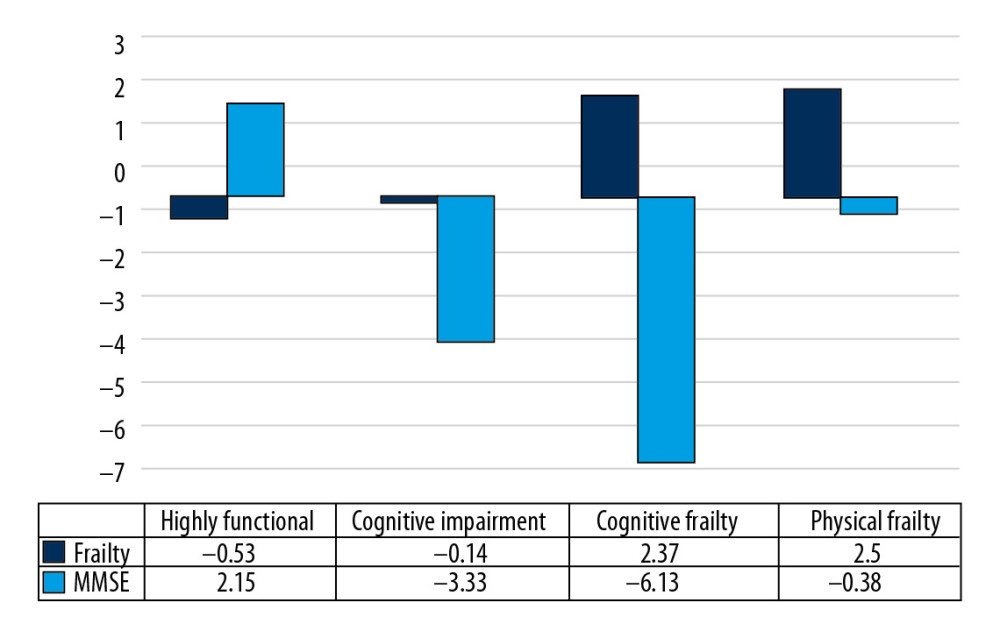
The average results on the “frailty” and MMSE tests were transformed to allow visual presentation of their variations across clusters (Figure 1). The first cluster, on the left side, consisted of participants with good cognitive performances (2.15 units above the average for the sample), and only slightly disturbed physical performances (0.53 units below the average for the sample). This cluster was defined as being “relatively robust” or “highly functional” (HF).
Members of the second cluster had low cognitive performance, 3.33 units below the average on the MMSE for the sample, with good physical performance, as shown by the slight difference in “frailty” score from the average for the sample. This cluster was defined as being “cognitively impaired” (CI).
Member of the third cluster showed higher physical performance scores (2.37 units above the average), but lower cognitive performance scores (6.13 units below the average). This cluster was defined as being “cognitively frail” (CF).
Finally, participants in the fourth cluster had only a slight difference in MMSE score from the rest of the sample, being 0.38 units below average, but a much higher “frailty” score, 2.50 units above average. This cluster was defined as being “physically frail” (PhyF).
Table 3 shows that the “PhyF” cluster contains only frail individuals; that the “CF” cluster includes a high proportion of frail individuals and a smaller proportion of pre-frail individuals, that the “CI” cluster consists of about two thirds of pre-frail individuals and one third of robust individuals, and that the “HF” cluster contains equal proportions of physically robust and pre-frail individuals.
When the MMSE cut-offs were adjusted according to levels of education, 34.6% of individuals in the sample were found to have MCI. The majority of individuals in clusters dominated by individuals with decreased cognitive function had MCI, including 74.6% of subjects in cluster 2 and 90.5% in cluster 3.
Analyses of differences among the clusters in the domains of the GAS, GDS, and MMSE tests showed that the domains indicating mental disorders, anxiety and dysphoria had significantly higher scores in clusters that containing high percentages of physically frail subjects (clusters “CF” and “PhyF”), than in the “highly functional” cluster (Table 4).
The scores of the domains of the MMSE test indicating “attention” as the non-mnestic function and “delayed memory” and “orientation in time” as mnestic functions were found to be significantly lower in clusters with decreased cognitive function (clusters “CI” and “CF”) than in the “highly functional” cluster (Table 4). The score on the domain “delayed memory” was also significantly lower in the cluster indicating physical frailty (cluster “PhysF”) (Table 4).
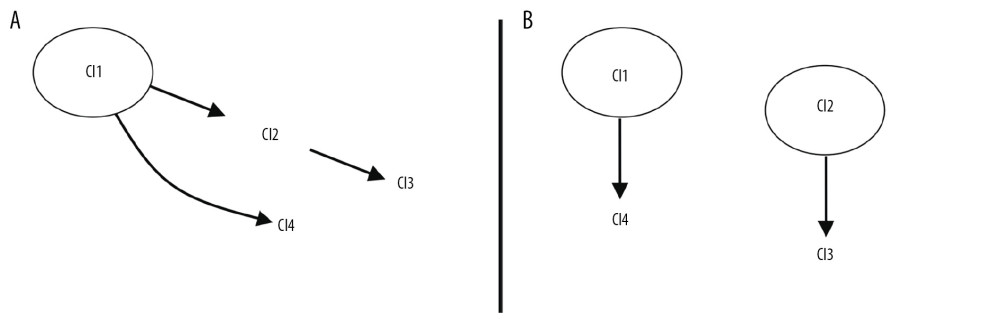
Based on current theories of the development of cognitive frailty syndrome, two scenarios of the transition of individuals among the clusters are suggested (Figure 2A, 2B).
In the multivariate LR model, low scores in the MMSE domains indicating the mnestic functions “orientation in time” and “delayed memory” were significantly associated with a higher probability of belonging to a cluster designated as “pathological” than to the control, “highly functional” cluster (Table 5 upper panel). The MMSE domain indicating “attention” was significantly associated with a higher probability of membership in cluster 2, characterized by cognitive impairment. The domains indicating anxiety on the GAS test and dysphoria on the GDS test were associated with a significantly higher probability of membership in cluster 4, which is characterized by physical frailty.
Increasing age was found to be significantly associated with the probability of membership in the pathological clusters, in particular cluster 3, which indicates cognitive frailty syndrome (Table 5). A higher level of education, defined as secondary school or higher, was associated with reduced probability of membership in clusters with impaired cognitive function (clusters 2 and 3), but the level of the significance was low, with a Z-value of about 2.
Discussion
This study identified four patterns (clusters) of physical frailty and cognitive impairment that most optimally described the population of Croatian subjects aged ≥60 years. One cluster, which included 61.22% of study participants, consisted of relatively robust individuals (cluster 1). The other three clusters, which contained 23.95%, 7.98% and 6.85% of the participants, consisted of subjects with various pathological conditions, including MCI (cluster 2), cognitive frailty (cluster 3), and physical frailty (cluster 4), respectively [37]. The mental disorders, anxiety and depression, were found to have an explanatory (mediating) role.
Increased age was found to strongly influence the formation of pathological clusters, particularly cluster 3, consisting of subjects with cognitive frailty. The interaction of accumulated pathologies with advanced age are the factors necessary for the development of this phenotype [38,39]. Level of education was generally balanced among the pathological clusters, and therefore did not have a major influence on membership in these clusters. Relative to primary school education, high (secondary) school education slightly reduced the likelihood of membership in the pathological clusters, in agreement with the results of the Croatian MMSE validation study, in which only a college level education had an effect on determining MMSE cut-offs for the older population [28]. A difference between genders was observed only in cluster 4 (physical frailty), in which women were dominant. Although this cluster was small in size, other evidence also suggests that women are more predisposed to physical frailty than men [7].
To our knowledge, this study is the first to assess the prevalence of frailty among older, community-dwelling Croatians. We found that the prevalence of frailty was about 14%. Other large epidemiologic studies in European countries have reported the prevalence of frailty to be 12% and 6–27% [40,41].
Moreover, to our knowledge, this study is the first attempt to identify patterns of physical and cognitive performances among older individuals. In our previous study, we used the k-means clustering technique, which compares distances between numerical variables, to determine the relationship of factors associated with comorbidities and the cognitive and mental functioning of older primary care patients with pre-frail and frail status [42]. A recent large-scale study used a fuzzy c-means algorithm to identify multimorbidity patterns in older individuals, and to analyse their sociodemographic, lifestyle, clinical, and functional characteristics [10]. Similar groups of older people, labelled as being physically frail, cognitively impaired, and cognitively frail, were used to predict incident dementia [43]. A small-scaled study analysing the associations of educational level and cognitive and physical functions with disabilities, as measured by activities of daily living, also identified four clusters, indicating similar combinations of physical and cognitive performances as in the present study [44].
The research approach used in this study was more reliable pathophysiologically than separate approaches to each comorbidity, approaches currently regarded as the best methods for research on multimorbidity, including clustering of chronic diseases, and modelling of the prediction of functional outcomes [8–11]. The approach described in the present study better reflects the dynamics of accumulated pathologies during the ageing process, and the relationship of theses dynamics with chronological age. If ageing is considered an increase in entropy of body organisation, as stated by the theory of complex systems and the recent integrated theory of ageing, then the clusters identified in this study can be considered a cross-section of the states of entropy of the examined population [38,45]. Although many factors may influence the dynamics of the ageing process, the result is a limited number of relatively stable, but heterogeneous, phenotypes at the population level, with these phenotypes being determined by the balance between neuropathological changes and somatic comorbidities [36,46]. Individuals within the same cluster would therefore be at similar risks of further deterioration in health or similar potential for change.
The partitioning of the older population according to physical and cognitive performances can constitute the primary framework to guide the further assembly of diagnoses of chronic diseases, or other factors that indicate the clinical and sociodemographic characteristics of older individuals. This procedure may allow for some insights into the pathophysiologic background beyond patterns of age-related functional decline. The present study showed that age was lower in cluster 1, consisting of robust persons, than in the other three clusters. Thus, individuals in this cluster are characterized only as at risk for incipient changes in body fitness, with 44% of these participants being pre-frail. Individuals with these characteristics are difficult to distinguish from those in a fully healthy state, as the accumulation of comorbidities is a continuous process [47]. Even these early changes in physical fitness are rarely isolated conditions, but rather are in combination with cognitive impairment. This is suggested by the finding that a small percentage of individuals in cluster 1 have MCI. However, a larger percentage may have subjective memory complaints, an early sign of cognitive decline that has been shown predictive of incident dementia [48,49].
The proposed evolving nature of age-based functional decline suggests that follow up of individuals in cluster 1 may clarify concerns that cannot be determined by prospective epidemiologic studies. For example, it is unclear whether early stages of physical frailty potentiate the development of cognitive decline, or whether cognitive frailty develops as a unique disorder, starting from the appearance of subclinical neurovascular and comorbidity changes [50–53]. If physical frailty potentiates cognitive decline, then patients would start in cluster 1 (pre-frailty) and proceed via cluster 2 (early cognitive frailty) towards higher stages of cognitive frailty, later in life, as in cluster 3. In this proposed scenario, cluster 3 can be viewed as the stage of multiple comorbidities affecting the body and brain [16,46]. This scenario is supported by the results of the epidemiologic studies indicating that physical frailty predicts cognitive decline [51].
Alternatively, clusters 1 and 2 may represent the start of two relatively independent pathways, which operate with a time lag during life. One pathway represents the development of the frailty phenotype, starting with early frailty changes (cluster 1) at a younger age and later progressing to overt physical frailty, in accordance with Fried’s postulate of deficit accumulation during the transition between frailty states [12,54]. The second pathway represents cognitive frailty, considered a unique disorder, which starts with early physical and cognitive impairments, as in cluster 2, and advances towards overt cognitive frailty, as in cluster 3. This scenario is supported by epidemiologic studies demonstrating that individuals with co-occurring physical frailty and cognitive impairment are at higher risk of progression to dementia than individuals with physical frailty alone, and from studies showing that physical frailty and cognitive impairment interact, potentiating each other in the development of negative outcomes [55,56].
Cognitive frailty is thought to represent a range of similar disorders, which share pathophysiologic pathways, including the effects of vascular, inflammatory, nutritional, and metabolic factors [46]. Accordingly, cognitive impairment should be considered within the context of existing comorbidities [39]. There is a broad expert consensus that all older pre-frail and frail individuals with comorbidities be screened for cognitive impairment [16,52].
This view is supported by our study, which found that cognitive impairment was rarely present as an isolated disorder, based on the high overlap rates between cognitive and physical impairments in clusters 2 and 3. The division of individuals into clusters, as in this study, may be useful in targeted screening for cognitive impairment. Based on our results, individuals in cluster 2 (early cognitive frailty) are likely to be better targets for screening of cognitive impairment than those in cluster 1 (early frailty). Subjects in cluster 2 show significant reductions in both memory-related cognitive functions (delayed memory and orientation in time) and attention (an executive functions), allowing the differentiation between cognitively impaired and robust individuals [57–59].
Partitioning the older PC population into clusters would allow follow-up of certain individuals who may progress to higher stages of cognitive impairment and frailty, and who may develop final outcomes, such as dementia, based on their initial cluster assignment. This may enable the determine of whether individuals in cluster 2 with isolated MCI or early cognitive frailty are more likely to develop dementia, either the vascular type or Alzheimer’s [52]. Follow up of individuals in these clusters could also determine whether reduced cognitive function, as in some individuals in cluster 4, is due to cognitive impairment or to interference by high anxiety level, which was found to significantly influence membership in this cluster [60]. Indeed, recent studies have found that the presence of symptoms of mental disorders in older, cognitively unaffected people increases their risks for cognitive impairment [21].
Conclusions
To our knowledge, the present study is the first to show that the continuity and non-linearity of age-related accumulation of pathologies can be addressed by clustering of older populations based on their physical and cognitive performances. The major limitation of this study was its small sample size, which may have influence the number and sizes of the identified clusters. Larger scale studies are needed to confirm these results.
Although each cluster was heterogeneous, older individuals could be classified into clusters of subjects who were highly functional, cognitively impaired, cognitively frail, and physically frail. The formation of these clusters was age-dependent and influenced by the occurrence of mental disorders and by performance on particular cognitive tasks. Follow up of individuals in these clusters may resolve many of the conflicting results of epidemiologic studies, in which participants were labelled individually, rather than as spontaneously assembled groups based on functional outcomes. The addition to these clusters of diagnoses of chronic diseases and other attributes that describe clinical and sociodemographic characteristics of older individuals may help disentangle the complex interfaces between age-related physical and cognitive decline.
Tables
Table 1. Summary of the LCA model fit results.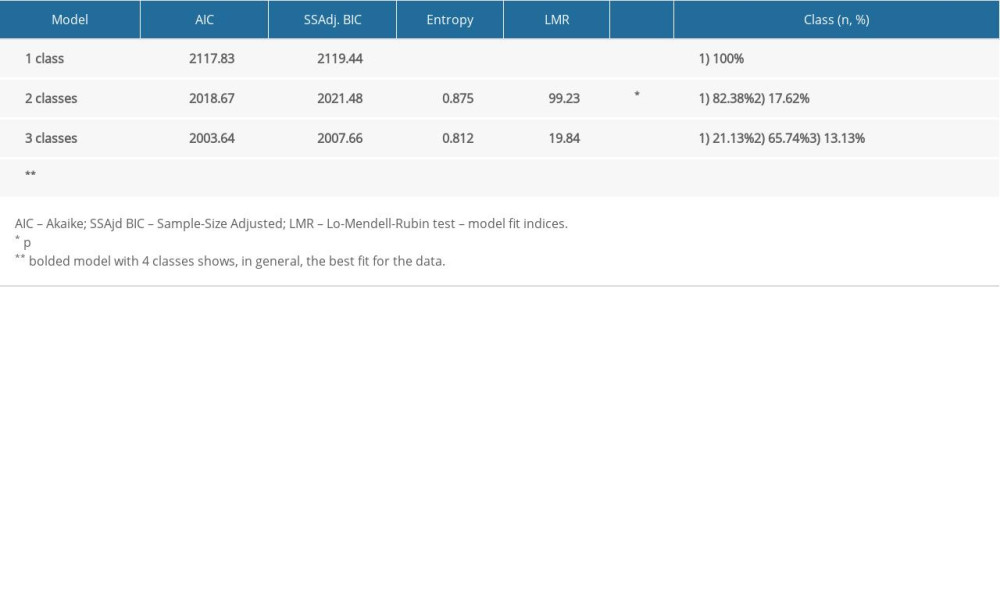 Table 2. Average scores across clusters on the frailty and MMSE tests.
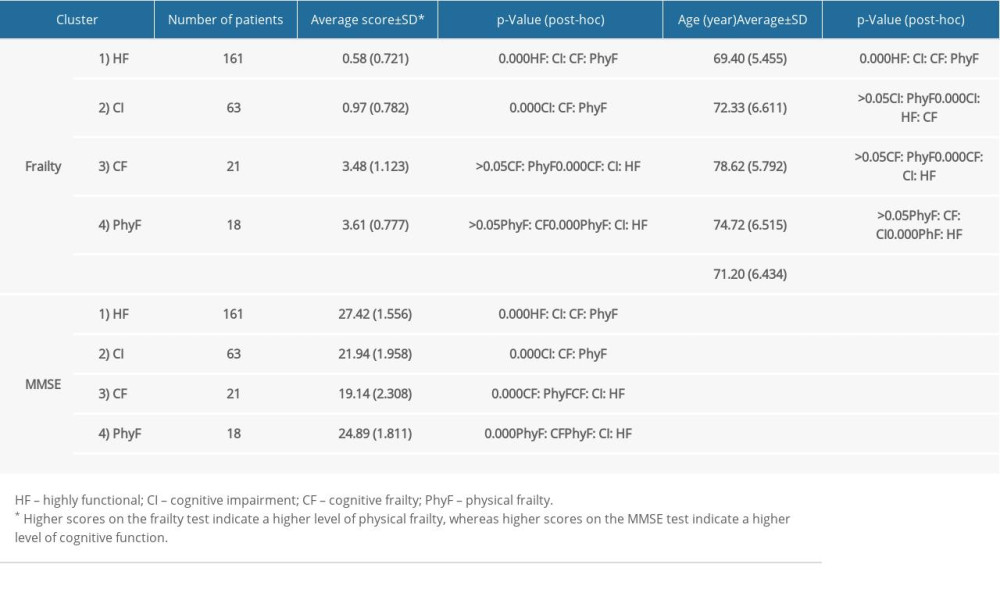 Table 3. Distributions of pre-frail and frail individuals, and those with mild cognitive impairment, across the clusters.
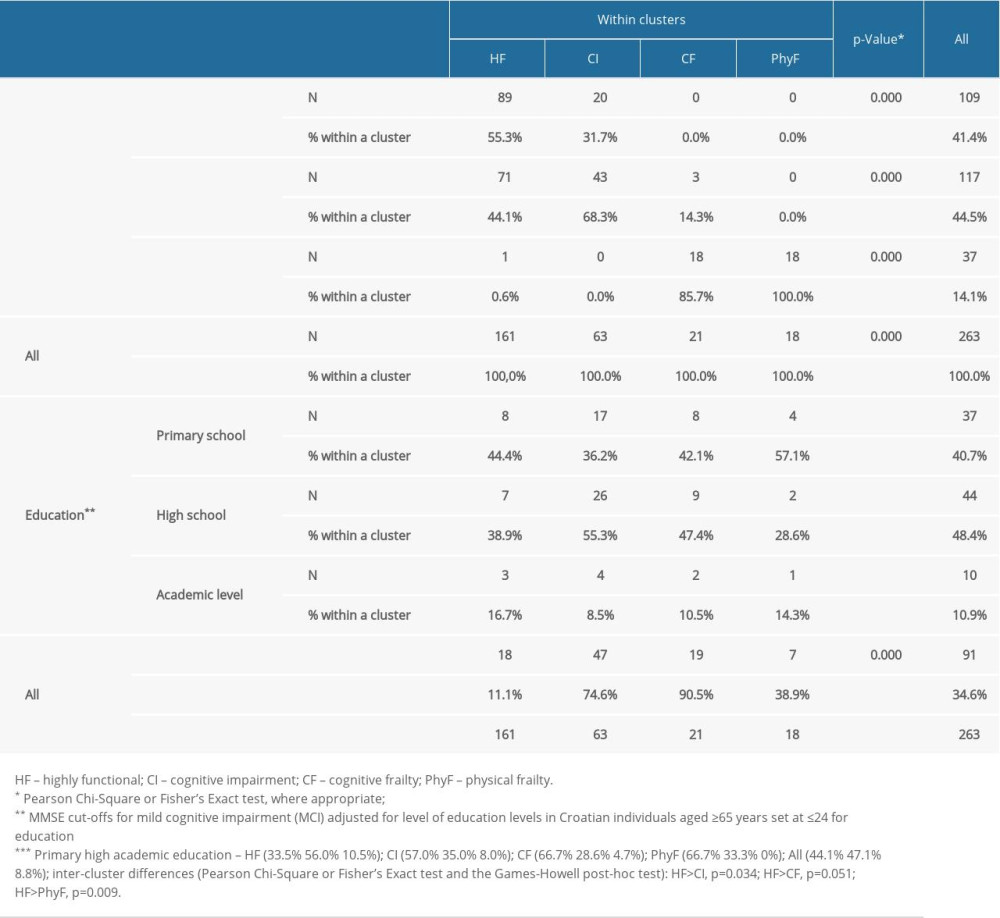 Table 4. Associations of the respective domains of the GAS, GDS and MMSE tests with subject membership in clusters.
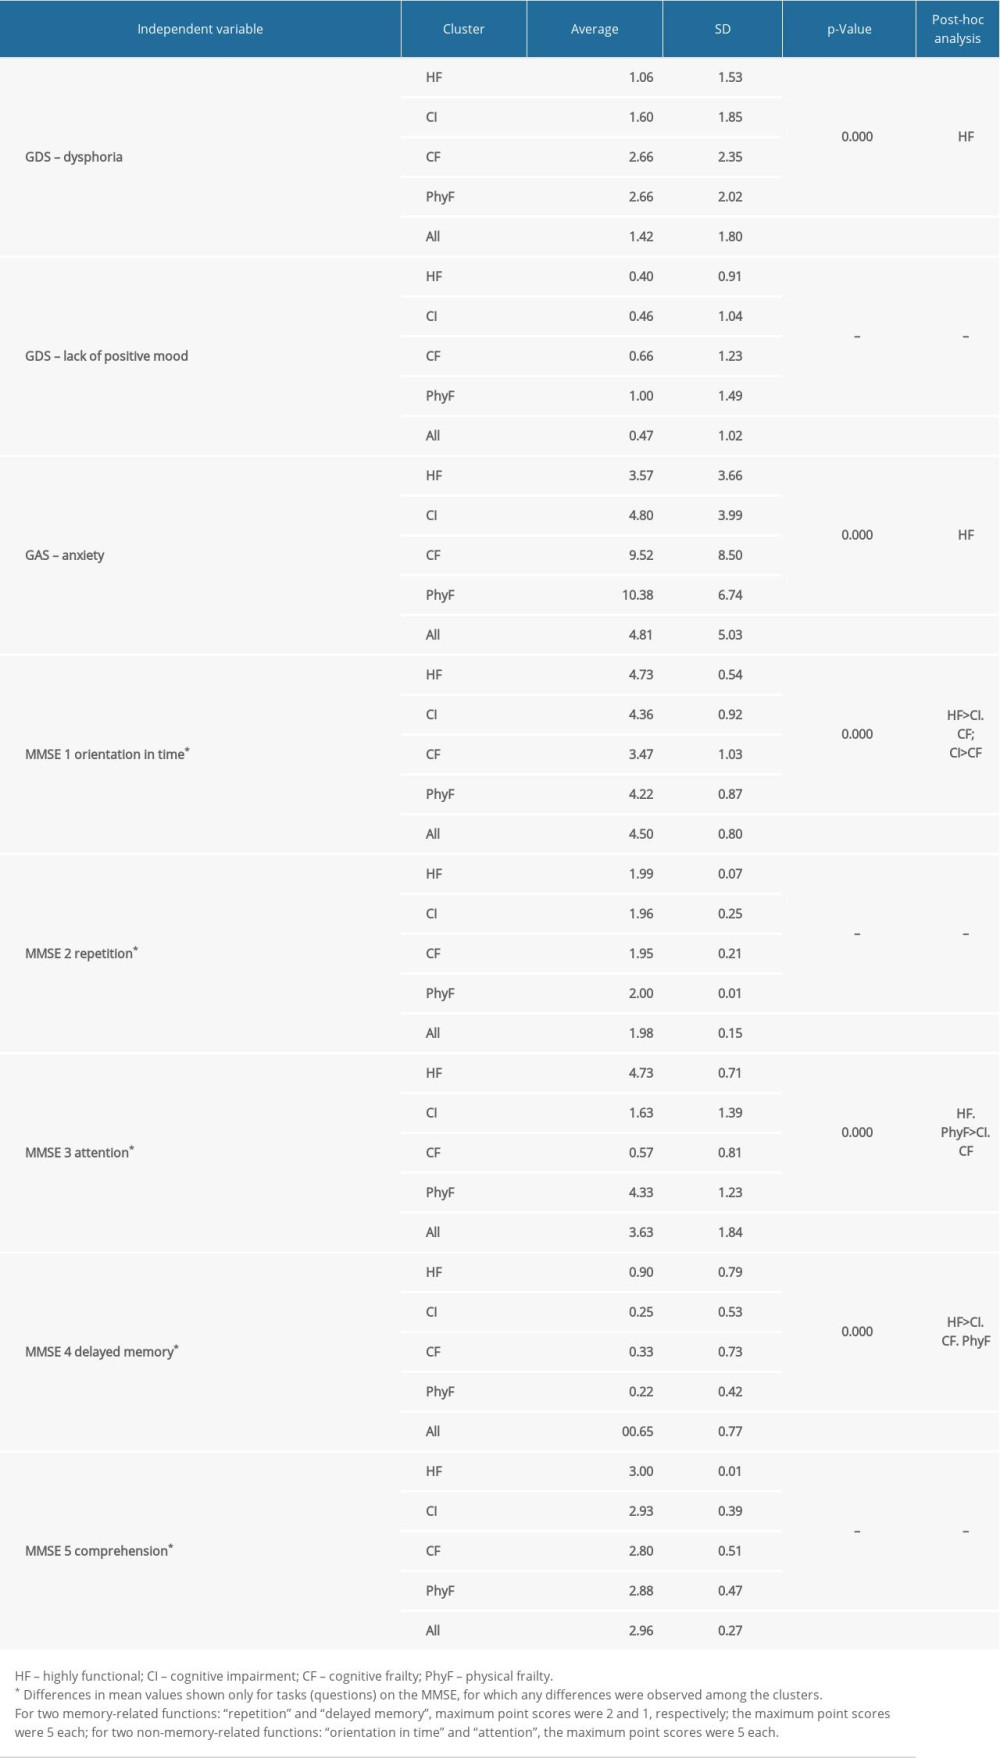
References
1. Ogura S, Jakovljevic MM, Editorial: Global population aging – health care, social and economic consequences: Front Public Health, 2018; 6; 335
2. Barnett K, Mercer SW, Norbury M, Epidemiology of multimorbidity and implications for health care, research and medical education: A cross-sectional study: Lancet, 2012; 380; 37-43
3. Boyd C, Smith CD, Masoudi FA, Decision making for older adults with multiple chronic conditions: Executive Summary for the American Geriatrics Society Guiding Principles on the Care of Older Adults with Multimorbidity: J Am Geriatr Soc, 2019; 67; 665-73
4. Struckmann V, Leijten FRM, van Ginneken ESELFIE consortium, Relevant models and elements of integrated care for multi-morbidity: Results of a scoping review: Health Policy, 2018; 122; 23-35
5. Nicholson K, Almirall J, Fortin M, The measurement of multimorbidity: Health Psychol, 2019; 38; 783-90
6. van den Bussche H, Koller D, Kolonko T, Which chronic diseases and disease combinations are specific to multimorbidity in the elderly? Results of a claims data based cross-sectional study in Germany: BMC Public Health, 2011; 11; 101
7. Onder G, Palmer K, Navickas RJoint Action on Chronic Diseases and Promoting Healthy Ageing across the Life Cycle (JA-CHRODIS), Time to face the challenge of multimorbidity. A European perspective from the joint action on chronic diseases and promoting healthy ageing across the life cycle (JA-CHRODIS): Eur J Intern Med, 2015; 26; 157-59
8. Whitty CJM, MacEwen C, Goddard A, Rising to the challenge of multimorbidity: BMJ, 2020; 368; I6964
9. Larsen FB, Pedersen MH, Friis K, Latent class analysis of multimorbidity and the relationship to socio-demographic factors and health-related quality of life. A national population-based study of 162,283 Danish adults: PLoS One, 2017; 12; e0169426
10. Marengoni A, Roso-Llorach A, Vetrano DL, Patterns of multimorbidity in a population-based cohort of older people: Sociodemographic, lifestyle, clinical, and functional differences: J Gerontol A Biol Sci Med Sci, 2020; 75; 798-805
11. Calderόn-Larrañaga A, Vetrano DL, Ferrucci L, Multimorbidity and functional impairment – bidirectional interplay, synergistic effects and common pathways: J Intern Med, 2019; 285; 255-71
12. Fried LP, Xue QL, Cappola AR, Nonlinear multisystem physiological dysregulation associated with frailty in older women: Implications for etiology and treatment: J Gerontol A Biol Sci Med Sci, 2009; 64; 1049-57
13. Fried LP, Tangen CM, Walston JCardiovascular Health Study Collaborative Research Group, Frailty in older adults: Evidence for a phenotype: J Gerontol A Biol Sci Med Sci, 2001; 56; M146-56
14. Ward A, Arrighi HM, Michels S, Cedarbaum JM, Mild cognitive impairment: Disparity of incidence and prevalence estimates: Alzheimers Dement, 2012; 8; 14-21
15. Grande G, Haaksma ML, Rizzuto D, Co-occurrence of cognitive impairment and physical frailty, and incidence of dementia: Systematic review and meta-analysis: Neurosci Biobehav Rev, 2019; 107; 96-103
16. Ruan Q, Yu Z, Chen M, Cognitive frailty, a novel target for the prevention of elderly dependency: Ageing Res Rev, 2015; 20; 1-10
17. Birk JL, Kronish IM, Moise N, Depression and multimorbidity: Considering temporal characteristics of the associations between depression and multiple chronic diseases: Health Psychol, 2019; 38; 802-11
18. Gould CE, O’Hara R, Goldstein MK, Beaudreau SA, Multimorbidity is associated with anxiety in older adults in the Health and Retirement Study: Int J Geriatr Psychiatry, 2016; 31; 1105-15
19. Kohrt BA, Griffith JL, Patel V, Chronic pain and mental health: Integrated solutions for global problems: Pain, 2018; 159(Suppl 1); S85-90
20. Vaughan L, Corbin AL, Goveas JS, Depression and frailty in later life: A systematic review: Clin Interv Aging, 2015; 10; 1947-58
21. Leoutsakos JS, Wise EA, Lyketsos CG, Smith GS, Trajectories of neuropsychiatric symptoms over time in healthy volunteers and risk of MCI and dementia: Int J Geriatr Psychiatry, 2019; 34; 1865-73
22. Wallace E, Salisbury C, Guthrie B, Managing patients with multimorbidity in primary care: BMJ, 2015; 350; h176
23. Gobbens RJ, van Assen MA, Luijkx KG, Determinants of frailty: J Am Med Dir Assoc, 2010; 11; 356-64
24. Chan DCD, Tsou HH, Chen CY, Chen CY, Validation of the Chinese-Canadian study of health and aging clinical frailty scale (CSHA-CFS) telephone version: Arch Gerontol Geriatr, 2010; 50; e74-80
25. Hageenars JA, McCutcheon AL: Applied latent class analysis, 2002, Cambridge, Cambridge University Press
26. Iacobucci D, Structural equations modeling: Fit indices, sample size, and advanced topics: J Consumer Psychol, 2010; 20; 90-98
27. Austin PC, Estimating multilevel logistic regression models when the number of clusters is low: A comparison of different statistical software procedures: Int J Biostat, 2010; 6; 16
28. Boban M, Malojčić B, Mimica N, The reliability and validity of the Mini Mental State Examination in the elderly Croatian population: Dement Geriatr Cogn Disord, 2012; 33; 385-92
29. MMSE Available: www.medicine.uiowa.edu/igec/tools/cognitive/MMSE.pdf
30. Yochim BP, Mueller AE, June A, Segal DL, Psychometric properties of the Geriatric Anxiety Scale: Comparison to the Beck Anxiety Inventory and Geriatric Anxiety Inventory: Clin Gerontologist, 2011; 34; 21-33
31. Wancata J, Alexandrowicz R, Marquart B, The criterion validity of the Geriatric Depression Scale: A systematic review: Acta Psychiatr Scand, 2006; 114; 398-410
32. Mueller AE, Segal DL, Gavett B, Geriatric Anxiety Scale: Item response theory analysis, differential item functioning, and creation of a ten-item short form (GAS-10): Int Psychogeriatr, 2015; 27; 1099-111
33. Akaike H, Information theory and an extension of the maximum likelihood principle, 1973, Budapest, Akademia Kiado
34. Tein JY, Coxe S, Cham H, Statistical power to detect the correct number of classes in latent profile analysis: Struct Equ Modeling, 2013; 20; 640-57
35. Tabert MH, Manly JJ, Liu X, Neuropsychological prediction of conversion to Alzheimer disease in patients with mild cognitive impairment: Arch Gen Psychiatry, 2006; 63; 916-24
36. Robertson DA, Savva GM, Kenny RA, Frailty and cognitive impairment – a review of the evidence and causal mechanisms: Ageing Res Rev, 2013; 12; 840-51
37. Panza F, Lozupone M, Solfrizzi V, Different cognitive frailty models and health- and cognitive-related outcomes in older age: From epidemiology to prevention: J Alzheimers Dis, 2018; 62; 993-1012
38. Franceschi C, Garagnani P, Morsiani C, The continuum of aging and age-related diseases: Common mechanisms but different rates: Front Med, 2018; 5; 61
39. Godin J, Armstrong JJ, Rockwood K, Andrew MK, Dynamics of frailty and cognition after age 50: Why it Matters that cognitive decline is mostly seen in old age: J Alzheimers Dis, 2017; 58; 231-42
40. O’Caoimh R, Galluzzo L, Rodríguez-Laso AWork Package 5 of the Joint Action ADVANTAGE, Prevalence of frailty at population level in European ADVANTAGE Joint Action Member States: A systematic review and meta-analysis: Ann Ist Super Sanità, 2018; 54; 226-38
41. Santos-Eggimann B, Cuenoud P, Spagnoli J, Junod J, Prevalence of frailty in middle-aged and older community-dwelling Europeans living in 10 countries: J Gerontol A Biol Sci Med Sci, 2009; 64; 675-81
42. Bekić S, Babič F, Filipčić I, Clustering of mental and physical comorbidity and the risk of frailty in patients aged 60 years or more in primary care: Med Sci Monit, 2019; 25; 6820-35
43. Shimada H, Doi T, Lee S, Makizako H, Chen LK, Arai M, Cognitive frailty predicts incident dementia among community-dwelling older people: J Clin Med, 2018; 7; 250
44. Bandelow S, Xu X, Xiao S, Hogervorst E, Cluster analysis of physical and cognitive ageing patterns in older people from Shanghai: Diagnostics, 2016; 6; 11
45. Lipsitz LA, Physiological complexity, aging, and the path to frailty: Sci Aging Knowledge Environ, 2004; 2004; pe16
46. Panza F, Seripa D, Solfrizzi V, Targeting cognitive frailty: Clinical and neurobiological roadmap for a single complex phenotype: J Alzheimers Dis, 2015; 47; 793-813
47. Strandberg TE, Pitkälä KH, Frailty in elderly people: Lancet, 2007; 369; 1328-29
48. Jessen F, Amariglio RE, van Boxtel MSubjective Cognition Decline Initiative (SCD-I) Working Group, A conceptual framework for research on subjective cognitive decline in preclinical Alzheimer’s disease: Alzheimers Dement, 2014; 16; 844-52
49. Solfrizzi V, Scafato E, Seripa DItalian Longitudinal Study on Aging Working Group, Reversible cognitive frailty, dementia, and all-cause mortality. The Italian Longitudinal Study on Aging: J Am Med Dir Assoc, 2017; 18; 89.e1-e8
50. Chung CP, Chou KH, Chen WT, Cerebral microbleeds are associated with physical frailty: A community-based study: Neurobiol Aging, 2016; 44; 143-50
51. Auyeung TW, Lee JS, Kwok T, Woo J, Physical frailty predicts future cognitive decline – a four-year prospective study in 2737 cognitively normal older adults: J Nutr Health Aging, 2011; 15; 690-94
52. Canevelli M, Cesari M, Cognitive frailty: Far from clinical and research adoption: J Am Med Dir Assoc, 2017; 18; 816-18
53. Buchman AS, Yu L, Wilson RS, Brain pathology contributes to simultaneous change in physical frailty and cognition in old age: J Gerontol A Biol Sci Med Sci, 2014; 69; 1536-44
54. Gill TM, Gahbauer EA, Allore HG, Han L, Transitions between frailty states among community-living older person: Arch Intern Med, 2006; 166; 418-23
55. Ávila Funes JA, Amieva H, Barberger-Gateau P, Cognitive impairment improves the predictive validity of the phenotype of frailty for adverse health outcomes: The three city study: J Am Geriatr Soc, 2009; 57; 453-61
56. Chu NM, Bandeen-Roche K, Tian J, Hierarchical development of frailty and cognitive impairment: Clues into etiological pathways: J Gerontol A Biol Sci Med Sci, 2019; 74; 1761-70
57. Delrieu J, Andrieu S, Pahor M, Neuropsychological profile of “cognitive frailty“ subjects in MAPT study: J Prev Alzheimers Dis, 2016; 3; 151-59
58. Robertson DA, Savva GM, Coen RF, Kenny RA, Cognitive function in the prefrailty and frailty syndrome: J Am Geriatr Soc, 2014; 62; 2118-24
59. O’Keeffe E, Mukhtar O, O’Keeffe ST, Orientation to time as a guide to the presence and severity of cognitive impairment in older hospital patients: J Neurol Neurosurg Psychiatry, 2011; 82; 500-4
60. El-Gabalawy R, Mackenzie CS, Shooshtari S, Sareen J, Comorbid physical health conditions and anxiety disorders: A population-based exploration of prevalence and health outcomes among older adults: Gen Hosp Psychiatry, 2011; 33; 556-64
Figures
Tables
Table 1. Summary of the LCA model fit results.Table 2. Average scores across clusters on the frailty and MMSE tests.Table 3. Distributions of pre-frail and frail individuals, and those with mild cognitive impairment, across the clusters.Table 4. Associations of the respective domains of the GAS, GDS and MMSE tests with subject membership in clusters.Table 1. Summary of the LCA model fit results.Table 2. Average scores across clusters on the frailty and MMSE tests.Table 3. Distributions of pre-frail and frail individuals, and those with mild cognitive impairment, across the clusters.Table 4. Associations of the respective domains of the GAS, GDS and MMSE tests with subject membership in clusters. In Press
Clinical Research
Effects of Single-Bout Endurance Exercise Intensity on Peripheral Neurotrophic Factors in Patients With Isc...Med Sci Monit In Press; DOI: 10.12659/MSM.952089
Review article
Anisodus tanguticus in Cancer Research: A Review of Traditional Use, Phytochemistry, Extraction Methods, an...Med Sci Monit In Press; DOI: 10.12659/MSM.952999
Clinical Research
Nasal Mucociliary Clearance and Its Relationship With Disease Severity in Patients With Multiple SclerosisMed Sci Monit In Press; DOI: 10.12659/MSM.952850
Clinical Research
Modified Thoracoabdominal Nerves Block Through the Perichondrial Approach vs Subcostal Transversus Abdomini...Med Sci Monit In Press; DOI: 10.12659/MSM.953976
Most Viewed Current Articles
17 Jan 2024 : Review article 14,176,570
Vaccination Guidelines for Pregnant Women: Addressing COVID-19 and the Omicron VariantDOI :10.12659/MSM.942799
Med Sci Monit 2024; 30:e942799
13 Nov 2021 : Clinical Research 3,762,188
Acceptance of COVID-19 Vaccination and Its Associated Factors Among Cancer Patients Attending the Oncology ...DOI :10.12659/MSM.932788
Med Sci Monit 2021; 27:e932788
14 Dec 2022 : Clinical Research 2,466,310
Prevalence and Variability of Allergen-Specific Immunoglobulin E in Patients with Elevated Tryptase LevelsDOI :10.12659/MSM.937990
Med Sci Monit 2022; 28:e937990
16 May 2023 : Clinical Research 708,927
Electrophysiological Testing for an Auditory Processing Disorder and Reading Performance in 54 School Stude...DOI :10.12659/MSM.940387
Med Sci Monit 2023; 29:e940387