06 September 2020: Animal Study
Biological Network Model of Effect of Chronic Intermittent Hypoxia on Spermatogenesis in Rats
Jisheng Wang12ABDE, Xuefeng Gong2ABEF, Fanchao Meng12ABCDEF, Sheng Deng12CDF, Hengheng Dai12BF, Binghao Bao12BE, Junlong Feng12BF, Haisong Li2AG*, Bin Wang2AEDOI: 10.12659/MSM.925579
Med Sci Monit 2020; 26:e925579


Abstract
BACKGROUND: The aim of this study was to explore the effect of obstructive sleep apnea hypopnea syndrome (OSAHS) on spermatogenesis and the effects of the expression of related proteins.
MATERIAL AND METHODS: Rats in Group A were normoxic (exposed to a normal level of oxygen). Rats in Group B were exposed to intermittent hypoxia. After 6 weeks, the rats were killed and their epididymides were removed. The epididymis of one testis was used to test indices of semen quality. The epididymis of the other testis was stained with hematoxylin & eosin to observe pathologic changes in the testis. We used real-time quantitative polymerase chain reaction (RT-qPCR) and Western blotting to measure expression of the protein and mRNA of leptin, Janus kinase (JAK), and signal transducer and activator of transcription (STAT) in rat testicular cells. Cytoscape v3.7.1 was employed to construct the OSAHS–male infertility network and protein–protein interactions network. Information on common targets of OSAHS and male infertility was imported into the Database for Annotation, Visualization and Integrated Discovery (DAVID). Then, analyses of pathway enrichment were undertaken using the Gene Ontology and Kyoto Encyclopedia of Genes and Genomes databases.
RESULTS: Data were obtained 6 weeks after completion of OSAHS modeling. Compared with Group A, the total sperm count and sperm motility in Group B showed a downward trend (P<0.05). Staining showed no obvious abnormality in Group A. However, numerous structurally abnormal spermatogenic tubules were observed in Group B samples, and the lumen was atrophied and thinned, arranged unevenly, and the gap between the tubules was markedly increased. Western blotting and RT-qPCR showed that, compared with Group A, expression of the protein and mRNA of leptin, JAK, and STAT in the testes of rats in Group B was significantly increased (P<0.05 for all).
CONCLUSIONS: These data suggest that: (1) Chronic intermittent hypoxia can cause pathologic damage to rat testes; (2) Oligozoospermia was highly correlated and regulated by the JAK2/STAT6 signaling pathway; and (3) Chronic intermittent hypoxia can lead to decreased spermatogenesis in rats.
Keywords: Infertility, Male, Sleep apnea, obstructive, Computational Biology, Epididymis, Janus Kinase 2, Oligospermia, Protein Interaction Maps, STAT6 Transcription Factor, Spermatogenesis
Background
With the development of sleep medicine, increasing attention has focused on obstructive sleep apnea hypopnea syndrome (OSAHS) [1]. Studies have shown that OSAHS prevalence in adult males is ≤4% and increases rapidly with increasing age. Infertility also affects the health of adult males. Worldwide, infertility affects approximately 10–15% of couples [2]. Whether there is a relationship between male infertility and OSAHS, and the manner of this relationship, is unknown.
According to the World Health Organization (WHO), infertility is defined as the inability to conceive after 1 year of unprotected intercourse [3]. Male infertility is not an independent disease, but the result of one or more diseases/factors. OSAHS potentiates the hypoxic stimuli for oxidative stress, culminating in systemic inflammation and generalized vascular endothelial damage [4]. Reports have indicated that OSAHS can induce sexual dysfunction and low libido, and that it has a clear correlation with erectile dysfunction [5], but the specific mechanism is unclear.
The Janus kinase/signal transducer and activator of transcription (JAK/STAT) signaling pathway is composed mainly of tyrosine kinase-related receptors, tyrosine kinases (JAKs) and transcription factors (STATs) [6,7]. Tyrosine kinase-related receptors mainly include cytokine receptors (such as those for interleukins [ILs] and interferons) and hormone receptors (e.g., growth hormone) [8].
JAK is a non-transmembrane tyrosine kinase. There are 4 members of the JAK protein family: JAK1, JAK2, JAK3, and Tyk2 [9]. STAT includes 6 members (1 to 6) [10]. The JAK/STAT signaling pathway can regulate the growth, development, differentiation, and apoptosis of cells. STAT6 belongs to both the STAT family of transcription factors and adaptation proteins. Members of the STAT family exhibit a similar protein structure, which helps activation and function. In addition, they possess regulatory signals to ensure that they are assigned to the correct cell location at the appropriate time. Typically, signals are generated by the binding of extracellular ligands to their homologous transmembrane receptors. This combination induces the dimerization and activation of JAKs. Activated JAKs phosphorylate tyrosine residues in the cytoplasmic part of the receptor. These residues are the docking sites for STAT factors. The phosphorylated state dimerizes and transfers to the nucleus, thereby activating or inhibiting its target gene [11,12].
We hypothesized that chronic intermittent hypoxia could activate the JAK2/STAT6 signaling pathway, inhibit cell proliferation, and promote apoptosis, which would lead to oligozoospermia (semen with a low concentration of sperm). We aimed to predict the pathways and proteins of OSAHS and oligozoospermia through bioinformatic analysis.
Material and Methods
ETHICAL APPROVAL OF THE STUDY PROTOCOL:
Animal-based procedures were carried out in accordance with the guidelines set by the Experimental Animal Welfare Ethics Committee of China-Japan Friendship Hospital (190107) in Beijing, China.
EXPERIMENTAL ANIMALS:
Adult male Sprague-Dawley rats (specific pathogen-free; 4 weeks; ~120 g) were purchased from Sbeef (Beijing) Biotechnology (lot number: DM190623060102; Beijing, China). Rats were allowed to acclimatize for 1 week under standard animal-housing conditions before experimentation. Twenty healthy male specific pathogen-free rats were divided randomly into 2 groups of 10. After 6 weeks of experimentation, 6 rats were selected randomly from each group for measurement of relevant indices.
DRUGS AND REAGENTS:
Bovine serum albumin was purchased from Amresco Chemicals (catalog number, 0332; Solon, Ohio, United States). Sodium dodecyl sulfate was obtained from Sigma-Aldrich (L4390; Saint Louis, Missouri, United States). Electrochemiluminescence (ECL) was purchased from Millipore (WBKLS0500). Sulfosalicylic acid was purchased from Sinopharm Chemical Reagent Co., Ltd. (10021516). Beta-actin mouse monoclonal antibody was obtained from ImmunoWay Biotechnology (YM3028; Plano, Texas, United States). TRIzol® Reagent was purchased from Invitrogen Life Technologies (15596-026; Carlsbad, California, United States). Trichloromethane was purchased from Sinopharm Chemical Reagents (10006818; Beijing, China). Isopropanol was obtained from Sinopol Group Chemical Reagent Co., Ltd. (80109218; Beijing, China). Anhydrous ethanol was purchased from Sinopharm Chemical Reagent Co, Ltd. (10009218; Beijing, China). HyPure™ molecular biology-grade water was purchased from HyClone (SH30538.02; Jülich, Germany). A RevertAid First Strand cDNA Synthesis Kit was obtained from Thermo Scientific (K1622; Waltham, Massachusetts, United States). A FastStart Universal SYBR™ Green Master (Rox) kit was obtained from Roche (04913914001; Basel, Switzerland). Primers were purchased from Invitrogen. Antibodies against JAK2 (bs-0908R), STAT6 (Bd-1143R), leptin (bs-0409R) and β-actin (Bs-33036M) were obtained from Bioss Inc. (Woburn, Massachusetts, United States).
PROTEIN–PROTEIN INTERACTIONS:
The Search Tool for the Retrieval of Interacting Genes/Proteins (STRING) database (
NETWORK CONSTRUCTION/ANALYSES:
Cytoscape v3.7.1 (
ANALYSES OF PATHWAY ENRICHMENT USING GENE ONTOLOGY AND KYOTO ENCYCLOPEDIA OF GENES AND GENOMES DATABASES:
The Database for Annotation, Visualization and Integrated Discovery (DAVID v6.8;
CONSTRUCTION AND VERIFICATION OF THE OSAHS MODEL:
Group A rats received a normal level of oxygen (20–21%) and were normoxic. Group B rats were exposed to intermittent hypoxia in a special cabin and the model. First, a tap of compressed nitrogen was opened for 30 s to rapidly reduce the oxygen concentration in the cabin from 20–21% to 6–7%, and the air supply was stopped for 10 s to maintain the oxygen concentration in the cabin at 6–7%. Second, a tap of compressed oxygen was opened for 20 s, and the oxygen concentration in the cabin was increased from 6–7% to 20–21% within 20 s. Finally, a tap of compressed air was opened for 60 s to maintain the oxygen concentration at 20–21% in the cabin. The total time of intermittent hypoxia was 120 s. The rats had water and food in the cabin and could eat normally. Studies have shown that the method of intermittent hypoxia used in the present study can cause arterial oxygen saturation in rats to fluctuate periodically with the intermittent change of oxygen concentration in the cabin [13]. The intermittent hypoxia phase of the experiment was conducted daily from 9 am to 5 pm, 8 h/day, and lasted for 6 weeks. When the 8-h/day intermittent hypoxia experiment was complete, rats were transferred from the cabin to a standard cabin with the same feeding environment. During the experiment, both groups of rats were given normal drinking water and food.
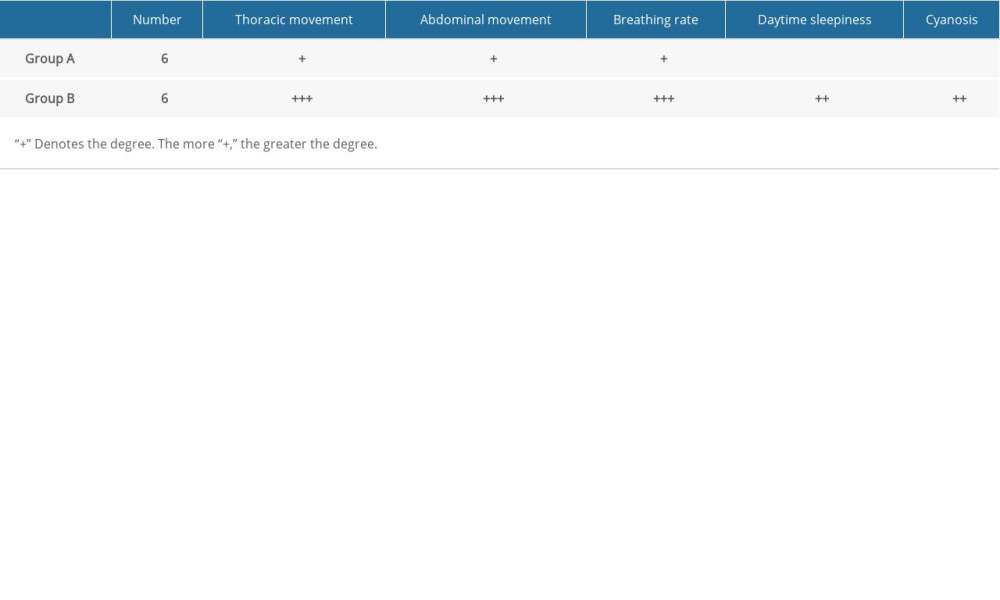
Indices of general observation and oxyhemoglobin saturation were used for model verification. General indicators observed were abnormal thoracic and abdominal movements, increased respiratory rate, daytime sleepiness, and cyanosis. Dynamic changes in arterial oxygen saturation were monitored to determine the efficiency of intermittent hypoxia in the experimental animals.
SAMPLE PREPARATION:
At the end of the treatment period, the rats were weighed and anesthetized with pentobarbital sodium (50 mg/kg, IP). Rats were euthanized and their testis and epididymal tissues were harvested. The epididymides was removed, weighed, and transferred to pre-warmed physiologic (0.9%) saline. The tissue was shredded using fine scissors and incubated. The epididymal tissue was used to determine semen quality (count and motility of sperm). The right testis was used for Western blotting and RT-qPCR. The left testis was used for morphologic and ultrastructural observations.
ANALYSES OF SEMEN QUALITY:
We used the shredded epididymal tissue in 0.9% saline described above and incubated it in a 37°C water bath for 5 min. Shaking gently while incubating, we aimed to allow sperm to swim out and mix with the saline. The sperm mixture was filtered repeatedly using a stainless-steel cell sieve (PY-0643; Puyi Biotechnology, Shanghai, China). The filtrate was centrifuged at 2200 g for 5 min at room temperature. We removed the precipitate, added 1 mL of sperm fixative to it, and mixed thoroughly. After mixing, we used a cell-counting plate to count the sperm mixture. The specific observation method was according to the World Health Organization standard: 10 visual fields were selected randomly, and the number of sperm in 10 large squares was counted. The average value was 106/mL.
STAINING USING HEMATOXYLIN AND EOSIN (H&E):
We removed the testicular tissue fixed in 4% paraformaldehyde, after which we cut along the horizontal axis and continued to fix and rinse the tissue. Ethanol and xylene were used to treat the tissue. This was followed by embedding in paraffin in sections that were 4–5 μm thick, followed by staining with H&E. Stained tissue was observed by electron microscopy (BK-FL4, OPTEC; Chongqing, China).
WESTERN BLOTTING:
To measure expression of leptin, JAK, and STAT proteins, we took a portion of cavernous tissue from each rat homogenized it in ice-cold tissue-lysis buffer. We centrifuged the mixture at 12 000 rpm for 10 min at room temperature, after which the supernatant was collected. The protein concentration was measured using a bicinchoninic acid (BCA) protein kit (SI-5700; Sino-uk Institute of Biological Technology, Beijing, China). We adjusted the protein concentration with radioimmunoprecipitation assay buffer and boiled it for 5 min. Each sample was separated by sodium dodecyl sulfate-polyacrylamide gel electrophoresis using 10% gels, and transferred to polyvinylidene fluoride (PVDF) membranes. Immunoblotting was undertaken using β-actin as an internal control (Bioss). After being left overnight at 4°C, the PVDF membranes were washed and incubated with a peroxidase-linked secondary antibody. An ECL system (WBKLS0500; Millipore, New York, New York, United States) was used to detect the immune-response signal.
RT-QPCR:
A PCR instrument (slan-96p; Shanghai Hongshi, Shanghai, China) was used for RT-qPCR. When extracting total RNA, TRIzol™ Reagent was added to homogenized tissue to maintain the integrity of RNA in the sample and to inhibit RNA degradation. The purity and concentration of total RNA was determined, and complimentary DNA was prepared by reverse transcription. The primer sequences are shown in Table 1. After adding samples to 96-well plates, fluorescent RT-qPCR was undertaken for amplification. The number of cycles (Ct value) required for the fluorescence signals in each reaction tube to reach the set threshold was recorded. The difference in gene expression was determined by the 2−CtΔΔ method.
STATISTICAL ANALYSES:
Measurement data are shown as graphs using Prism 6.0 (GraphPad, San Diego, California, United States). The
Results
COLLECTION OF TARGETS:
The flowchart for our study is shown in Figure 1. After collection, 100 OSAHS and 100 infertility targets were obtained from GeneCard. After intersection, 28 targets related to both OSAHS and infertility were retained (Figure 2).
CONSTRUCTION AND TOPOLOGY OF THE OSAHS–INFERTILITY NETWORK AND PPI NETWORK:
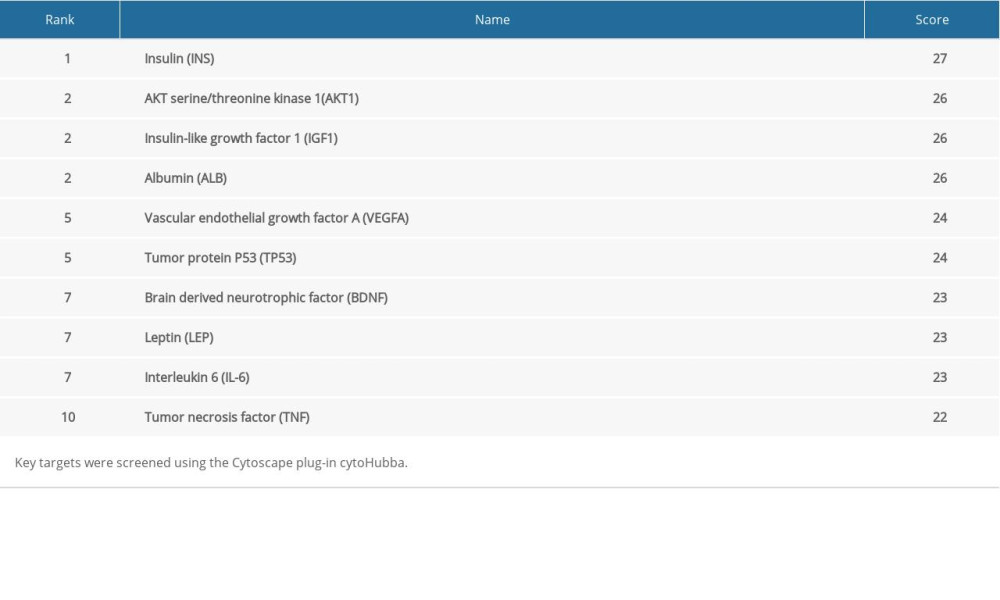
The STRING database was used to further analyze 28 overlapping targets of OSAHS and infertility. Through Cytoscape, 28 targets participating in PPIs were used for further network construction. Cytoscape was used for construction of an OSAHS-infertility network (Figure 3). According to cytoHubba analyses, the top 10 degrees were considered key targets (Figure 4): insulin (INS), AKT serine/threonine kinase 1 (AKT1), insulin-like growth factor 1 (IGF1), albumin (ALB), tumor protein P53 (TP53), vascular endothelial growth factor A (VEGFA), brain derived neurotrophic factor (BDNF), leptin, IL-6, and tumor necrosis factor (TNF) (Table 2).
ANALYSES OF PATHWAY ENRICHMENT USING THE DAVID DATABASE:
Enrichment analyses of 28 targets through DAVID v6.8 showed that 83 biological process, 6 cellular component, 12 molecular function, and 72 signaling pathways were involved in GO and KEGG. The top 10 biological functions and signaling pathways were selected based on their P values (Figure 5).
VERIFICATION OF THE OSAHS MODEL:
We found abnormalities in chest and abdominal movements, increased respiratory rate, daytime sleepiness, and cyanosis in rats in the model group (Table 3). Oxygen saturation in the normoxic group was significantly higher than that in the model group (P<0.05) (Figure 6).
ANALYSES OF SEMEN QUALITY:
The sperm count in the normoxic group was significantly higher than that in the model group (P<0.05) (Figure 7). The total sperm motility in the normoxic group was significantly higher than that in the model group (P<0.05) (Figure 7).
H&E STAINING OF TESTICULAR TISSUE:
In the normoxic group, seminiferous tubules were closely arranged, and the boundary between the basement membrane and interstitium was clear and smooth. Spermatogenic cells and spermatids at all levels in the seminiferous tubules were arranged neatly.
In the intermittent hypoxia group, seminiferous tubules were damaged to varying degrees, and their number and morphology changed markedly. Also, the arrangement of seminiferous epithelial cells in the seminiferous tubules was disordered, with varying degrees of degeneration and necrosis. The seminiferous tubules were arranged sparsely, showed interstitial edema, and their epithelium was separated from the matrix. The seminiferous tubules had a cavity-like structure. Spermatogonia and seminiferous cells at all levels in the seminiferous tubules were degenerated and nuclei were constricted and necrotic. A syncytium structure appeared in the center of the seminiferous tubules. The emergence of spermatogenic cells at all levels disappeared, and proliferation of interstitial cells was observed (Figure 8).
PROTEIN EXPRESSION OF LEPTIN, JAK, AND STAT IN TESTICULAR TISSUES DETECTED BY WESTERN BLOTTING:
After 6 weeks of successful modeling, expression of JAK2 protein in the model group was significantly higher than that in the normoxic group (P<0.05). Also, expression of STAT6 protein in the model group was significantly higher than that in the normoxic group (P<0.05). Expression of leptin protein in the model group was significantly higher than that in the normoxic group (P<0.05) (Figure 9).
MRNA EXPRESSION OF LEPTIN, JAK, AND STAT IN TESTICULAR TISSUES DETECTED BY RT-QPCR:
Expression of leptin mRNA in the normoxic group was about 8 times that observed in the model group (P<0.05). Expression of JAK2 mRNA in the normoxic group was about 7 times that documented in the model group (P<0.05). Expression of STAT6 mRNA in the normoxic group was about 3 times that in the model group (P<0.05) (Figure 10).
Discussion
How male infertility is caused by OSAHS is unknown. Combining the results of bioinformatic analysis and animal experiments, we discovered that chronic intermittent hypoxia could activate the JAK2/STAT6 signaling pathway and cell proliferation and promote apoptosis, thereby leading to oligozoospermia. This is the first study to demonstrate OSAHS and oligozoospermia in experimental rats.
The results of
The main pathophysiologic changes in patients who suffer from OSAHS are hypoxia and a reduction in oxyhemoglobin saturation, which leads to hypoxemia. The latter can cause excitement of sympathetic nerves, increases in levels of angiotensin, and blood-pressure fluctuations, all of which can increase leptin levels. Leptin is a risk factor for male infertility [14]. The effects of leptin on the reproductive system are complex and may occur in the hypothalamic-pituitary-gonadal axis. Studies have shown that a high concentration of leptin caused by OSAHS can inhibit secretion of testosterone, luteinizing hormone, and follicle-stimulating hormone in the testes and pituitary glands of adult rats. These actions reduce the weight and volume of the testes, the diameter of the vas deferens, and the number of spermatocytes, sperm, and interstitial cells, as well as influencing other reproductive parameters [14,15].
Through bioinformatic analysis, we predicted that the JAK/STAT signaling pathway is one of the essential causes of OSAHS-induced disruption of spermatogenesis. Scholars have found that the cytokines IL-4, -5, and -13 are associated with activation of the JAK2 and STAT6 signaling pathways [16]. IL-13 is an upstream activator of the JAK/STAT6 pathway, which can induce STAT6 phosphorylation [6]. Absence of JAK2 and STAT6 leads to failure of the inhibitory effect of IL-13 on angiogenesis, indicating that STAT6 activation inhibits angiogenesis [17]. The amino-acid residue at position 641 of STAT6 is tyrosine, and phosphorylation of this residue plays a key part in the JAK/STAT signaling pathway. If tyrosine is mutated, the ability of STAT6 to bind DNA and its transcription activity will be lost [18]. First, activation of the JAK2/STAT6 signaling pathway may inhibit growth of testicular blood vessels, which in turn impacts the normal growth of testicular tissue [19]. Second, the JAK2/STAT6 signaling pathway is activated, STAT6 is phosphorylated, and the ability to bind DNA and transcriptional activity will be lost, which leads to a decline in spermatogenesis. Therefore, we cannot rule out these 2 possible mechanisms. Studying the relationship between the JAK2/STAT6 signaling pathway in relationship to the morphology and function of sperm could guide the treatment of male infertility.
Our study had 2 main limitations. It was based on network pharmacology and bioinformatic analysis. However, the predictive results based on network pharmacology did not involve sex hormone-related indicators. We postulate that the hypoxic mechanism of OSAHS would also lead to endocrine dysfunction, and the relationship between hormone levels and male infertility is close [20]. Hence, not measuring sex hormone-related indicators was a deficiency of our study. Based on the biological network module, 10 related pathways were predicted. If we had aimed to detect all pathways, more work would have been involved and a larger budget would have been required. Therefore, for experimental verification, we selected the JAK/STAT pathway that relevant literature suggested was the mechanism closest to that of the 2 diseases.
Conclusions
Oligozoospermia was highly correlated and regulated by the JAK2/STAT6 pathway. Hypoxia activated the JAK2/STAT6 signaling pathway, leading to pathologic damage to rat testes and causing a decrease in the count and motility of sperm.
Figures
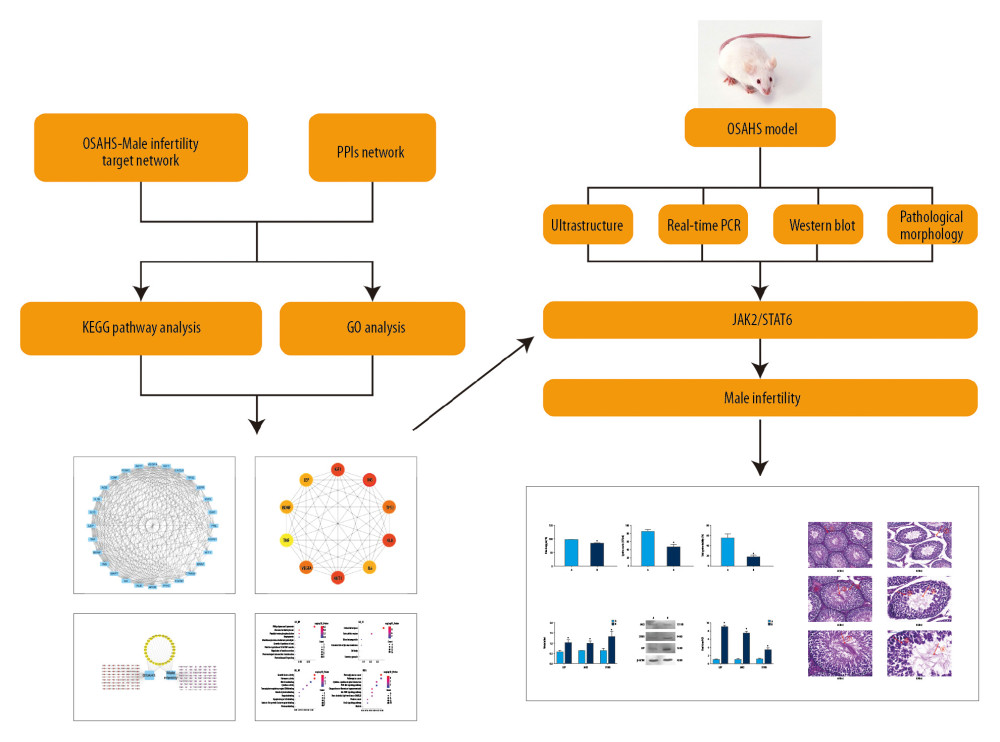 Figure 1. Study flowchart. Based on DAVID, we predicted the proteins and pathways associated with OSAHS and oligozoospermia. We used qPCR and Western blotting to measure expression of leptin, JAK, and STAT proteins and mRNA in the predicted pathways in rat testis cells from each group. The results of in vivo experiments were consistent with the results predicted by bioinformatic analysis. Chronic intermittent hypoxia and oligozoospermia were highly correlated with proteins in the JAK pathway. Hypoxia was able to activate the JAK2/STAT6 signaling pathway, inhibit cell proliferation, and promote apoptosis, which led to pathologic damage to rat testes and caused a reduction in the count and motility of sperm.
 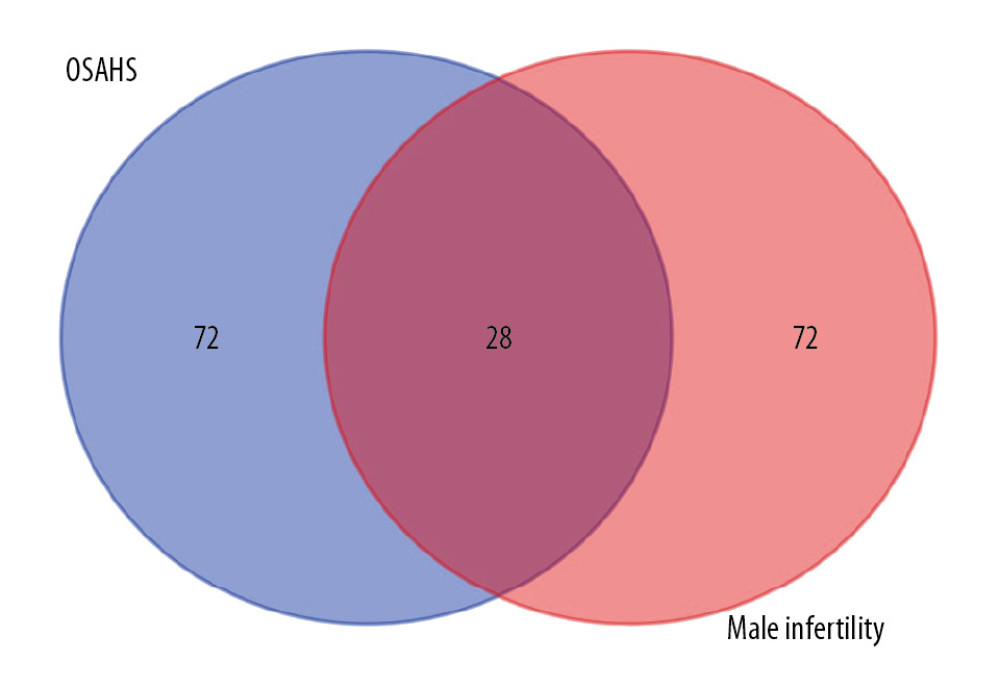 Figure 2. Venn diagram showing intersection of targets for male infertility and targets for OSAHS. Based on DAVID, we predicted the intersection of targets for male infertility and targets for OSAHS. Individual targets for OSAHS are shown as a blue circle. Individual targets for male infertility are shown as a red circle. The intersection of these targets is shown as a deep-red circle.
 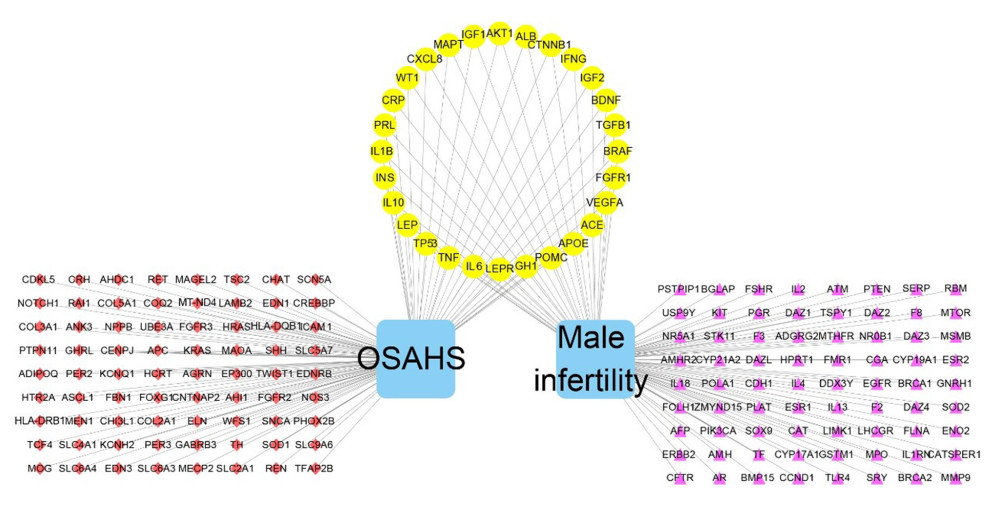 Figure 3. Network construction for OSAHS – male infertility. OSAHS (blue square). Male infertility (blue square). OSAHS individual targets (red rhombus). Male infertility individual targets (purple triangle). Intersecting targets (yellow circle).
 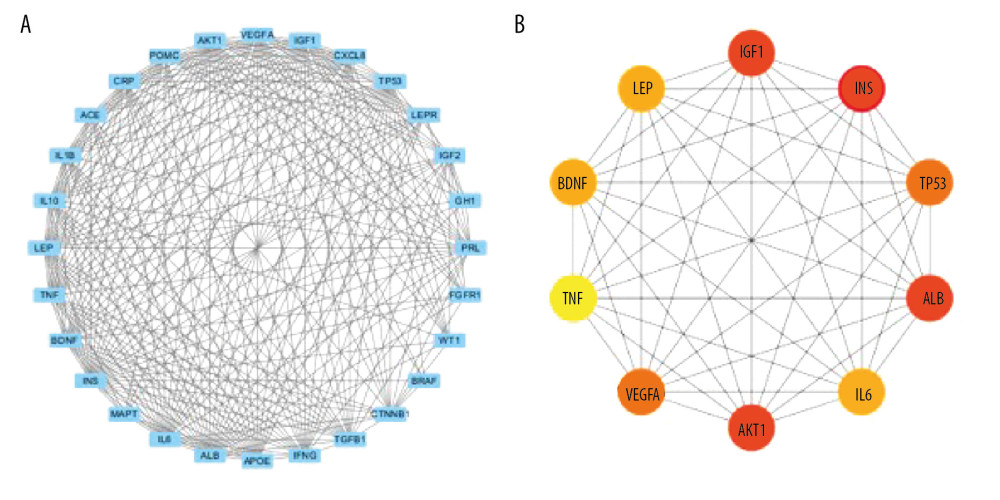 Figure 4. PPI network. (A) PPI network built by Cytoscape v3.7.1. (B) PPI network processed by a Cytoscape v3.7.1 plug-in called cytoHubba. The node color is proportional to the degree of PPI.
 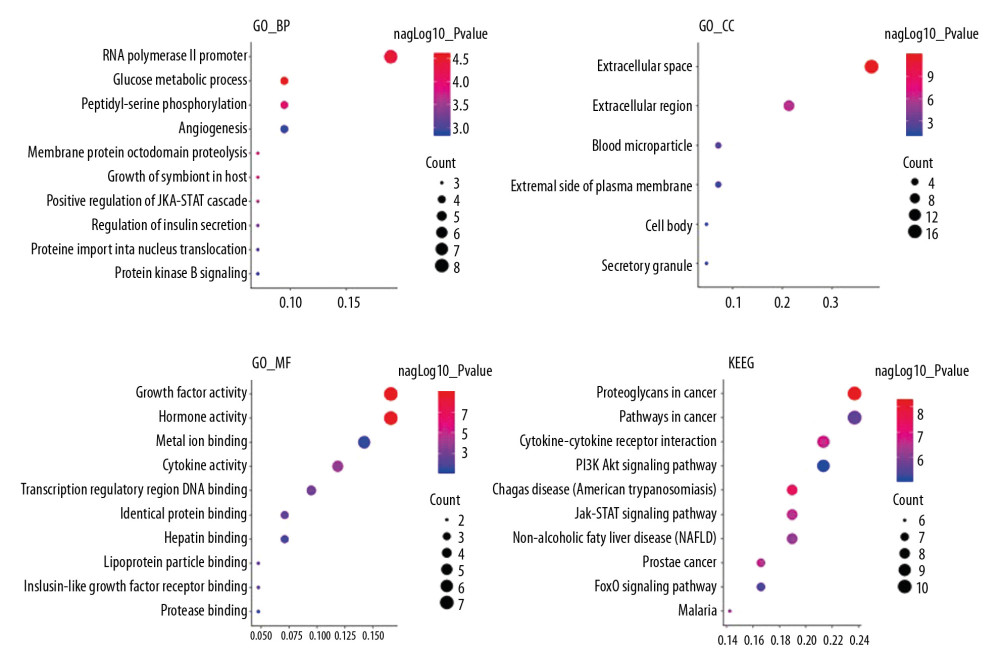 Figure 5. Analyses of pathway enrichment using GO and KEGG databases. The Y axis is the name. The X axis is the richness factor. The size of the node is proportional to the number of genes. The node color is proportional to the P value.
 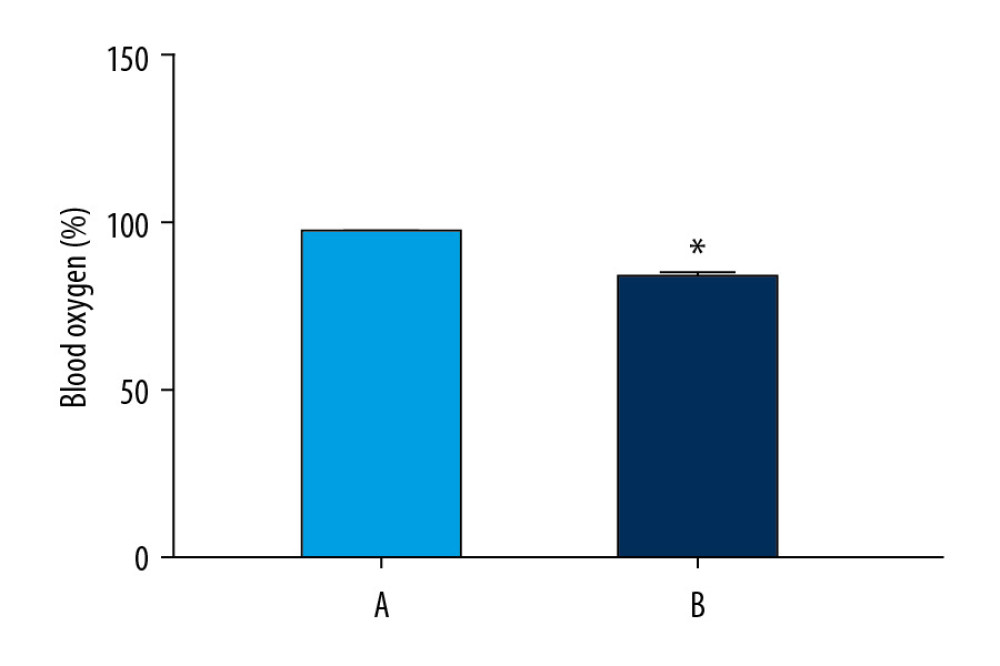 Figure 6. Oxygen saturation in the blood of the 2 groups. The light blue bar chart represents the oxygen saturation in Group A. The deep blue bar chart represents the oxygen saturation in Group B. Values are the mean±SEM (n=6 animals per group). The t test was used. Group B was compared with Group A, * P<0.05.
 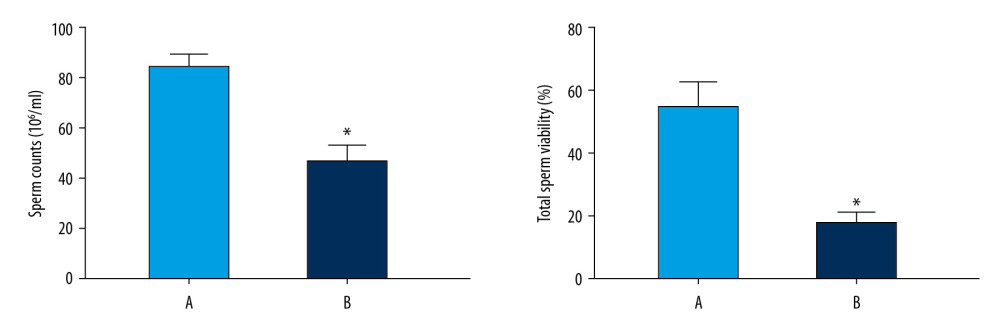 Figure 7. Sperm counts and total sperm viability in the 2 groups. The light blue bar represents the total number of sperm in Group A. The deep blue bar shows the sperm count in Group B. Values are the mean±SEM (n=6 animals per group). The t test was used. Group B was compared with Group A, * P<0.05.
 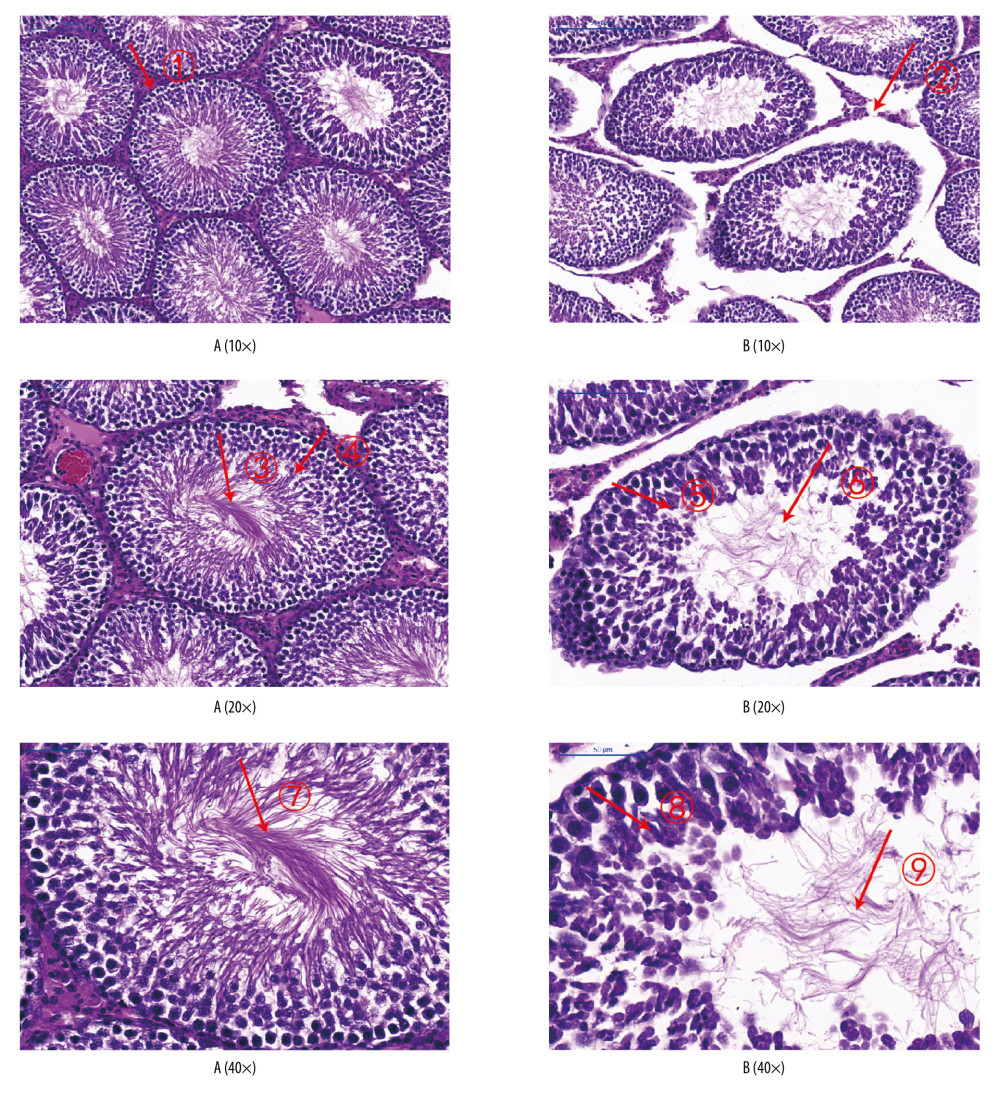 Figure 8. Analyses of testicular tissue in rats using H&E staining. The testicular tissue of rats was stained with hematoxylin & eosin (H&E) to observe pathologic changes in the testes under electron microscopy (n=6 animals per group). In Group A: (i) The convoluted tubules are closely arranged, and the boundary between the basal membrane and the stroma is clear and even (Arrow ➀); (ii) All levels of spermatogenic cells and spermatogenic cells are arranged in order (Arrow ➂➃➆). In Group B: (i) Spermatogenic tubules are damaged to different degrees, and the number and morphology of spermatogenic tubules are significantly changed (Arrow ➄➇); (ii) The convoluted tubules are sparsely arranged, interstitial edema is observed, and the epithelium of the tubules is separated from the stroma; the convoluted tubules have a cavity-like structure (Arrow ➁); (iii) The degeneration, nuclear shrinkage, and necrosis of spermatogenic cells and spermatogenic cells in the convoluted tubules is seen (Arrow ➅➈); (iv) All levels of spermatogenic cells have disappeared and proliferation of interstitial cells is seen (Arrow ➈).
 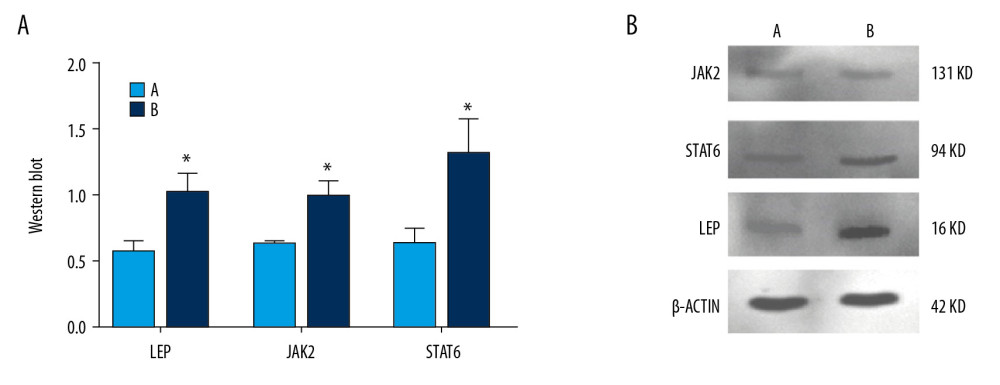 Figure 9. Expression of JAK2, STAT6, and leptin in rat testes. (A) The light blue bar chart represents expression of JAK2, STAT6, and LEP in Group A. The deep blue bar chart represents expression of JAK2, STAT6, and LEP in Group B. Values are the mean±SEM (n=6 animals per group). The t test was used. Group B was compared with Group A, * P<0.05. (B) Western blotting showing expression of JAK2, STAT6, and LEP proteins. β-actin is a loading control.
 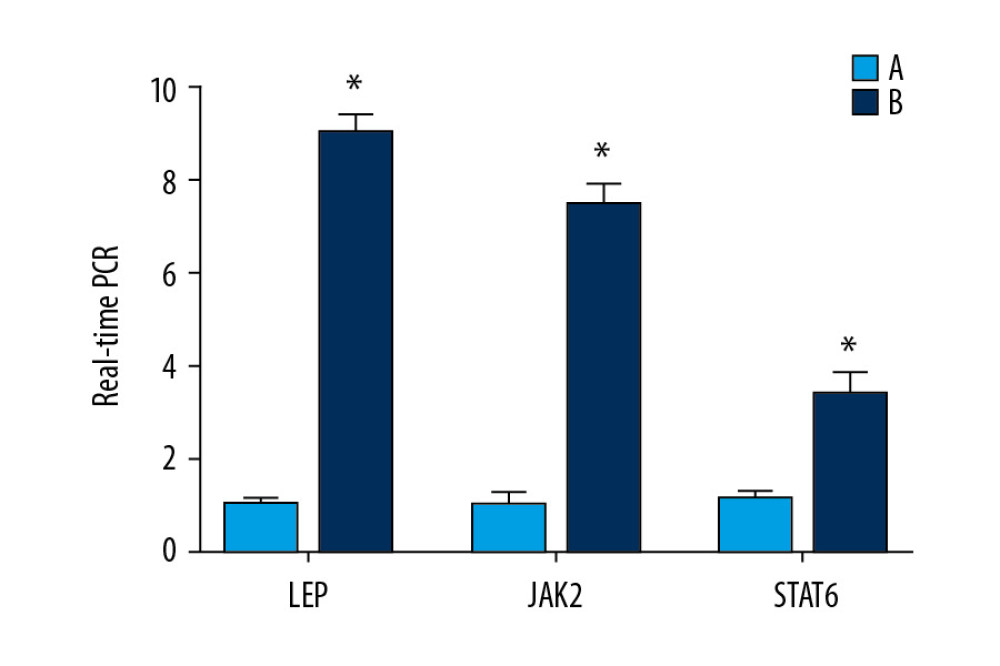 Figure 10. Expression of the mRNA of leptin, JAK2, and STAT6 in rat testes. The light blue bar graph represents expression of the mRNA of LEP, JAK2, and STAT6 in Group A. The deep blue bar chart represents expression of the mRNA of LEP, JAK2, and STAT6 in Group B. Values are the mean±SEM (n=6 animals per group). The t test was used. Group B was compared with Group A, * P<0.05.
References
1. Saaresranta T, Hedner J, Bonsignore MR, Clinical phenotypes and comorbidity in European sleep apnoea patients: PLoS One, 2016; 11(10); e0163439
2. Raj TS, Bastakoti R, Determinants of infertility in couples: J Nepal Health Res Counc, 2019; 17(1); 85-89
3. Zegers-Hochschild F, Adamson GD, de Mouzon J, International Committee for Monitoring Assisted Reproductive Technology (ICMART) and the World Health Organization (WHO) revised glossary of ART terminology: Fertil Steril, 2009; 92; 1520-24
4. Adegunsoye A, Balachandran J, Inflammatory response mechanisms exacerbating hypoxemia in coexistent pulmonary fibrosis and sleep apnea: Mediators Inflamm, 2015; 2015 510105
5. Margel D, Cohen M, Livne PM, Pillar G, Severe, but not mild, obstructive sleep apnea syndrome is associated with erectile dysfunction: Urology, 2004; 63(3); 545-49
6. Kiu H, Nicholson SE, Biology and significance of the JAK/STAT signalling pathways: Growth Factors, 2012; 30; 88-106
7. Schindler C, Darnell JE, Transcriptional responses to polypeptide ligands: The JAK-STAT pathway: Annu Rev Biochem, 1995; 64; 621-51
8. Hammarén HM, Virtanen AT, Raivola J, Silvennoinen O, The regulation of JAKs in cytokine signaling and its breakdown in disease: Cytokine, 2019; 118; 48-63
9. D’Cruz OJ, Vassilev AO, Uckun FM, Members of the Janus kinase/signal transducers and activators of transcription (JAK/STAT) pathway are present and active in human sperm: Fertil Steril, 2001; 76(2); 258-66
10. Darnell JE, STATs and gene regulation: Science, 1997; 277(5332); 1630-35
11. Tang H, Smith IJ, Hussain SNA, The JAK-STAT pathway is critical in ventilator-induced diaphragm dysfunction: Mol Med, 2014; 20(1); 579-89
12. Xu P, Shen P, Yu B, Janus kinases (JAKs): The efficient therapeutic targets for autoimmune diseases and myeloproliferative disorders: Eur J Med Chem, 2020; 192; 112155
13. Zhao YS, An Ji-R, Yang S, Hydrogen and oxygen mixture to improve cardiac dysfunction and myocardial pathological changes induced by intermittent hypoxia in rats: Oxid Med Cell Longev, 2019; 2019 7415212
14. Hodžić A, Ristanović M, Zorn B, Genetic variation in leptin and leptin receptor genes as a risk factor for idiopathic male infertility: Andrology, 2017; 5(1); 70-74
15. Wang X, Zhang X, Hu L, Exogenous leptin affects sperm parameters and impairs blood testis barrier integrity in adult male mice: Reprod Biol Endocrinol, 2018; 16(1); 55 (Abstract)
16. Cai B, Cai JP, Luo YL, The specific roles of JAK/STAT signaling pathway in sepsis: Inflammation, 2015; 38(4); 1599-608
17. Nishimura Y, Nitto T, Inoue T, IL-13 attenuates vascular tube formation via JAK2-STAT6 pathway: Circ J, 2008; 72(3); 469-75
18. Wei S, Study on the relationship between signal transduction and transcriptional activator 4/6 and preeclampsia and its adverse pregnancy outcome: Doctoral thesis, 2019, Yangzhou University
19. Hendry WF, Testicular, epididymal and vasal injuries: BJU Int, 2000; 86(3); 344-48
20. Kim ED, McCullough A, Kaminetsky J, Oral enclomiphene citrate raises testosterone and preserves sperm counts in obese hypogonadal men, unlike topical testosterone: Restoration instead of replacement: BJU Int, 2016; 117(4); 677-85
Figures
Figure 1. Study flowchart. Based on DAVID, we predicted the proteins and pathways associated with OSAHS and oligozoospermia. We used qPCR and Western blotting to measure expression of leptin, JAK, and STAT proteins and mRNA in the predicted pathways in rat testis cells from each group. The results of in vivo experiments were consistent with the results predicted by bioinformatic analysis. Chronic intermittent hypoxia and oligozoospermia were highly correlated with proteins in the JAK pathway. Hypoxia was able to activate the JAK2/STAT6 signaling pathway, inhibit cell proliferation, and promote apoptosis, which led to pathologic damage to rat testes and caused a reduction in the count and motility of sperm.Figure 2. Venn diagram showing intersection of targets for male infertility and targets for OSAHS. Based on DAVID, we predicted the intersection of targets for male infertility and targets for OSAHS. Individual targets for OSAHS are shown as a blue circle. Individual targets for male infertility are shown as a red circle. The intersection of these targets is shown as a deep-red circle.Figure 3. Network construction for OSAHS – male infertility. OSAHS (blue square). Male infertility (blue square). OSAHS individual targets (red rhombus). Male infertility individual targets (purple triangle). Intersecting targets (yellow circle).Figure 4. PPI network. (A) PPI network built by Cytoscape v3.7.1. (B) PPI network processed by a Cytoscape v3.7.1 plug-in called cytoHubba. The node color is proportional to the degree of PPI.Figure 5. Analyses of pathway enrichment using GO and KEGG databases. The Y axis is the name. The X axis is the richness factor. The size of the node is proportional to the number of genes. The node color is proportional to the P value.Figure 6. Oxygen saturation in the blood of the 2 groups. The light blue bar chart represents the oxygen saturation in Group A. The deep blue bar chart represents the oxygen saturation in Group B. Values are the mean±SEM (n=6 animals per group). The t test was used. Group B was compared with Group A, * P<0.05.Figure 7. Sperm counts and total sperm viability in the 2 groups. The light blue bar represents the total number of sperm in Group A. The deep blue bar shows the sperm count in Group B. Values are the mean±SEM (n=6 animals per group). The t test was used. Group B was compared with Group A, * P<0.05.Figure 8. Analyses of testicular tissue in rats using H&E staining. The testicular tissue of rats was stained with hematoxylin & eosin (H&E) to observe pathologic changes in the testes under electron microscopy (n=6 animals per group). In Group A: (i) The convoluted tubules are closely arranged, and the boundary between the basal membrane and the stroma is clear and even (Arrow ➀); (ii) All levels of spermatogenic cells and spermatogenic cells are arranged in order (Arrow ➂➃➆). In Group B: (i) Spermatogenic tubules are damaged to different degrees, and the number and morphology of spermatogenic tubules are significantly changed (Arrow ➄➇); (ii) The convoluted tubules are sparsely arranged, interstitial edema is observed, and the epithelium of the tubules is separated from the stroma; the convoluted tubules have a cavity-like structure (Arrow ➁); (iii) The degeneration, nuclear shrinkage, and necrosis of spermatogenic cells and spermatogenic cells in the convoluted tubules is seen (Arrow ➅➈); (iv) All levels of spermatogenic cells have disappeared and proliferation of interstitial cells is seen (Arrow ➈).Figure 9. Expression of JAK2, STAT6, and leptin in rat testes. (A) The light blue bar chart represents expression of JAK2, STAT6, and LEP in Group A. The deep blue bar chart represents expression of JAK2, STAT6, and LEP in Group B. Values are the mean±SEM (n=6 animals per group). The t test was used. Group B was compared with Group A, * P<0.05. (B) Western blotting showing expression of JAK2, STAT6, and LEP proteins. β-actin is a loading control.Figure 10. Expression of the mRNA of leptin, JAK2, and STAT6 in rat testes. The light blue bar graph represents expression of the mRNA of LEP, JAK2, and STAT6 in Group A. The deep blue bar chart represents expression of the mRNA of LEP, JAK2, and STAT6 in Group B. Values are the mean±SEM (n=6 animals per group). The t test was used. Group B was compared with Group A, * P<0.05. In Press
Clinical Research
Effects of Single-Bout Endurance Exercise Intensity on Peripheral Neurotrophic Factors in Patients With Isc...Med Sci Monit In Press; DOI: 10.12659/MSM.952089
Review article
Anisodus tanguticus in Cancer Research: A Review of Traditional Use, Phytochemistry, Extraction Methods, an...Med Sci Monit In Press; DOI: 10.12659/MSM.952999
Clinical Research
Nasal Mucociliary Clearance and Its Relationship With Disease Severity in Patients With Multiple SclerosisMed Sci Monit In Press; DOI: 10.12659/MSM.952850
Clinical Research
Modified Thoracoabdominal Nerves Block Through the Perichondrial Approach vs Subcostal Transversus Abdomini...Med Sci Monit In Press; DOI: 10.12659/MSM.953976
Most Viewed Current Articles
17 Jan 2024 : Review article 14,176,570
Vaccination Guidelines for Pregnant Women: Addressing COVID-19 and the Omicron VariantDOI :10.12659/MSM.942799
Med Sci Monit 2024; 30:e942799
13 Nov 2021 : Clinical Research 3,762,188
Acceptance of COVID-19 Vaccination and Its Associated Factors Among Cancer Patients Attending the Oncology ...DOI :10.12659/MSM.932788
Med Sci Monit 2021; 27:e932788
14 Dec 2022 : Clinical Research 2,466,310
Prevalence and Variability of Allergen-Specific Immunoglobulin E in Patients with Elevated Tryptase LevelsDOI :10.12659/MSM.937990
Med Sci Monit 2022; 28:e937990
16 May 2023 : Clinical Research 708,927
Electrophysiological Testing for an Auditory Processing Disorder and Reading Performance in 54 School Stude...DOI :10.12659/MSM.940387
Med Sci Monit 2023; 29:e940387