10 August 2021: Clinical Research
A Novel Substrate-Inspired Fluorescence-Based Albumin Detection Improves Assessment of Clinical Outcomes in Hemodialysis Patients Receiving a Nursing Nutrition Intervention
Lei You1ABCE, Xia Wang1BDEG, Wenhong Wang1DEF*DOI: 10.12659/MSM.930257
Med Sci Monit 2021; 27:e930257


Abstract
BACKGROUND: Albumin level does not precisely reflect nutritional status. We aimed to investigate the impact of a nutrition intervention on hemodialysis patients by use of fluorescence-based plasma albumin (FPA) detection.
MATERIAL AND METHODS: Eighty patients underwent maintenance hemodialysis for more than half a year and had a mean albumin <3.5 g/dL for over 3 months. The subjects were randomly divided into either a Control Group (CG) or an Intervention Group (IG). The IG received nutritional supplementation, and the CG group received routine nutritional support for 12 months. FPA and plasma albumin (PA) concentrations were measured. The fluorescence probe 1,3-Dichloro-7-hydroxy-9,9-dimethyl-2(9H)-acridone methyl biphenyl benzoate was used in FPA detection. Quality of life was estimated using WHOQOL-BREF (Quality of Life Scale developed through the World Health Organization), the 36-Item Short-Form Survey (SF-36), and the 6-minute walking test (6MWT).
RESULTS: After a 6-month and a 12-month intervention, PA and FPA concentrations increased, and the increase in FPA concentration was higher than that of PA in the IG group (P<0.05). Comparatively, the parameters of quality of life and 6MWT were improved in the IG group (P<0.05) but there were only minor changes in the CG group (P>0.05). There is an obvious association between the changes in FPA concentration and the parameters of quality of life and 6MWT but not PA.
CONCLUSIONS: Use of the fluorescence probe improves the detection sensitivity of plasma albumin and provides a potential method to assess clinical outcomes in hemodialysis patients.
Keywords: Fluorescent Antibody Technique, Direct, Hemodialysis Solutions, Nutrition Assessment, Serum Albumin, Fluorescence, Kidney Failure, Chronic, malnutrition, Molecular Probes, Nursing Care, Nutritional Support, Quality of Life, Renal Dialysis, Serum Albumin, Human, Walk Test
Background
High rates of nutritional deficiency are widely reported in patients undergoing maintenance hemodialysis [1,2]. Malnutrition can cause micro-inflammatory reactions, leading to malnutrition-inflammation-atherosclerosis syndrome (MIA) and cardiovascular events, seriously affecting the lifespan and the general wellbeing of patients [3,4]. An optimal diet is critical to improve the outcomes of hemodialysis patients [5,6]. Albumin reflects the nutrition status of patients, and low plasma albumin (PA) is often associated with poor clinical outcomes [7]. Therefore, albumin management is often tried in various hemodialysis modalities [8]. However, the most appropriate level of albumin for nutrition assessment remains unclear. The connection between albumin and nutrition is tenuous and likely confounded by comorbid diseases [9].
A variety of albumin measurement methods have been developed, including dye binding [10], size exclusion [11], and immunoassay [12]. However, size exclusion has poor selectivity when compared with other chromatographic techniques. Immunoassay is often affected by the experimental situation, such as the incubation time and incubation temperature. The dye binding method is non-specific for human serum albumin detection, is often reversible, and is easily affected by high-affinity endogenous molecules (such as bilirubin or bile acid) and exogenous substances (such as drugs or food additives) [14]. In addition, dye binding, size exclusion, and immunoassay cannot distinguish between natural and denatured albumin. Reactive probes are usually designed based on the recognizing, binding, and catalytic characteristics of a given enzyme molecule, and thus will improve the selectivity of the detection of the target molecule. Thus, it may be important to develop an alternative method, such as human albumin reactive probe molecules (ABPs) for specifically detecting natural albumins in complex biological systems.
Based on a previous report [15], we decided to use high-sensitivity and high-specificity fluorescent probes such as 1,3-Dichloro-7-hydroxy-9,9-dimethyl-2(9H)-acridone methyl biphenyl benzoate (DDAMBB) for albumin detection. We aimed to investigate the efficiency of FPA probing in patients on maintenance hemodialysis, and to use this method to assess the nutrition deficiency in the subjects to provide an early nursing nutritional intervention. The relationship between the wellbeing or physical activity of patients and FPA or PA levels was also investigated.
Material and Methods
PARTICIPANTS:
From July 2017 to June 2019, 360 patients on maintenance hemodialysis in the Outpatient Department of the First Affiliated Hospital of Dalian Medical University were recruited as the research subjects. After the implementing the inclusion and exclusion criteria, 80 patients were enrolled in the study (Figure 1). All subjects gave informed consent to participate in this study and signed an informed consent form. The study was approved by the Ethics Committee of the First Affiliated Hospital of Dalian Medical University.
INCLUSION CRITERIA:
The patients were 18-60 years of age, underwent maintenance hemodialysis for at least 6 months, had mean albumin <3.5 g/dL for over 3 months, and had kidney failure, which was confirmed using the values of estimated glomerular filtration rate (eGFR) less than 15 mL/min/1.73 m2 [16]. eGFR was evaluated via the abbreviated Modification of Diet in Renal Disease (MDRD) formula: 186×(Creatinine/88.4)−1.154×(Age)−0.20× (0.742 if female).
EXCLUSION CRITERIA:
Hepatic insufficiency was confirmed by using plasma levels of aspartate aminotransferase (AST) and alanine aminotransferase (ALT), which were over 2 times the upper limit of the normal range. We also excluded patients for drug and alcohol abuse and acute infection. Women were excluded if they were experiencing pregnancy or lactation. Chronic kidney disease (CKD) and life-threatening complications can be caused by dialysis. Kidney transplantation was performed within 3 months, and the expected survival time was ≤1 year.
SAMPLE SIZE CALCULATION:
The number of individual samples needed was calculated using the equation [17]:
where n stands for mandatory sample number, Zα stands for a constant-reference based on the accepted α error, Z1-β is a constant-reference based on the power in the present research. σ presents the standard deviation (S.D.), and Δ presents the difference in effects between the Intervention and Control groups. The significance level (α error level) was 0.05 and the power was 0.8. Zα is 1.96 based on a two-tailed test and Z1-β is 0.84. The noise refers to Gaussian distribution centered on zero with the S.D. of 0.5 [18]. The S.D. σ is 0.8 based on reported literature [19]. For Δ, an effect size of 0.3 is often considered as small [20]. The desired number of subjects were 65, and 80 patients were finally selected to allow for a 15% loss of patients to follow-up [21].
RANDOMIZATION:
A total of 360 patients on maintain hemodialysis at our hospital were recruited. According to the selecting standards, 80 subjects were finally selected. Random numbers were generated by a computer. According to the number, the patients were divided into a nutritional Intervention group (IG) and a Control group (CG). The patients received nutritional supplementation in the IG group, and the patients received routine nutritional support in the CG group for 12 months.
NUTRITIONAL NURSING INTERVENTION:
For both groups, the nursing staff provided routine care for the patients based on routine albumin detection, including condition observation, nutrition and diet guidance, and medication guidance. Nursing staff conducted nutritional care interventions for the patients that included the following aspects. First, they distributed health education manuals and assisted patients in formulating a reasonable diet plan, told them how to carry out diet interventions, and help them develop reasonable eating habits. Second, according to the test results, timely interventions in nutrition and diet care were performed for the patients, who were instructed to eat less fat food, eat more fresh fruits and vegetables, eat more lean meat, milk, eggs, fish, and other protein-rich foods to ensure the intake of various vitamins. Third, the nurses paid close attention to changes in the patient’s body mass. Scientific and appropriate nutritional care can ease the patient’s clinical symptoms, correct the patient’s metabolic disorder, and improve the function of the patient’s kidneys.
The nutritional supplementations provided to the IG group comprised carbohydrates, proteins, lipids, calcium, phosphorus, potassium, and sodium, based on a previous report [22] with modification, which is mainly from milk, eggs, sugar, and cornstarch. The nutritional supplement was prepared within 15 min of consumption using the method detailed in a previous report [22] and was offered to the patients during the first half of each hemodialysis session.
DIETARY ASSESSMENT:
Assessment of dietary intake is extremely important for hemodialysis patients. A semi-quantitative food frequency questionnaire was developed to assess the nutritional status according to a previously reported method before and after 6 and 12 months of intervention [23].
FPA AND PA MEASUREMENT:
Before and after 0 months, 6 months, and 12 months of intervention, 5 mL of blood was collected from each subject into ethylene diamine tetra-acetic acid (EDTA)-coated tubes and plasma was isolated through centrifugation at 4000×g for 10 min. PA was measured using the Human Albumin ELISA Kit (Biorbyt, MA, USA) on an automatic chemistry analyzer (Mindray, BE-2000, China).
DDAMBB was purchased from DICP (Dalian, China). We exposed 0.5% plasma and human albumin (200 mg/mL) to a series of concentrations of DDABP (0.2–20 μM) in phosphate buffer (pH=7.4, 100 mM) at 37°C for 30 min. The reaction was ended by adding ice-cold acetonitrile. Metabolite was detected by measuring the fluorescence value at 662 nm. The amounts of the product per unit time represented the rate of the enzyme-catalyzed reaction. Kinetic parameters (Km and Vmax) were calculated using GraphPad Prism 8.0 software. Plasma was diluted by 200 times and mixed with probe DDAMBB (final concentration 10 nM) in a 200 μL buffer reaction system, reacted at 37°C for 30 min, and an equal volume of ice-cold acetonitrile was added to stop the reaction. We used 200 nL of reaction solution for fluorescence detection (excitation/emission: 600/662 nm). The FPA content was then calculated based on the standard curve, which was made using standard albumin.
MEASUREMENT OF BIOCHEMICAL PARAMETERS:
The plasma total cholesterol (TC), triglycerides (TG), high-density lipoprotein cholesterol (HDL-C) and low-density lipoprotein cholesterol (LDL-C) were measured using kits from Shenggong Company (Shanghai, China). C-reactive protein (CRP) was evaluated using a kit (Beyotime, Beijing, China). Plasma creatinine was measured using a kit (BioVision, Milpitas, CA, USA). Adiponectin concentration was measured using ELISA (Kaibun Biotech, Shanghai, China). HbA1c (%) was measured using a HbA1c commercial kit (Recipe Chemicals – Instruments GmbH, Munich, Germany). AST and ALT were measured using kits from Shino-Test Corp. (Tokyo, Japan).
ASSESSMENTS OF LIFE QUALITY AND PHYSICAL ACTIVITY:
World Health Organization Quality of Life (WHOQOL-BREF) questionnaire was used to measure the quality of life, which consists of 4 domains (Physical health, Psychological, Social relationships, and Environment) in the WHOQOL-BREF questionnaire [24]. For the assessment of quality of life, the SF-36 questionnaire (36-Item Short-Form Health Survey) was also used to measure patients’ health status. The SF-36 has 36 items comprising physical function (PF), social function (SF), role physical (RP), role emotional (RE), mental health (ME), vitality (VT), body pain (BP), and general health (GH) [22]. Physical activity was measured using the 6-minute walking test (6MWT), which assesses how far a patient can walk in 6 minutes.
STATISTICAL ANALYSIS:
The Shapiro-Wilk test was used to confirm the normal distribution of continuous variables, which were described as mean±standard deviation (S.D.). The differences between the 2 groups were assessed using the
Results
DEMOGRAPHIC CHARACTERISTICS:
Three hundred and sixty hemodialysis patients visited the outpatient department of our hospital and the final 80 patients were selected. After a 6-month intervention, 1 patient was transferred to another center and 1 patient declined to take part further in the IG group and 1 patient was transferred to another center in the CG group. After a 12-month intervention, 1 was transferred to another center and 2 patients died in the IG group and 3 patients were transferred to another center and 3 patients died in the CG group. Therefore, 35 patients in the IG group and 33 patients in the CG group finished the present study. The statistical differences for demographic variables were insignificant between the IG and CG groups, including gender, age, duration of CHD disease, smoking, drinking, lipid profile, medical treatment, the cases of tunneled central venous catheter (TVC), arteriovenous fistula (AVF), anuric and albuminuria, and other biochemical indices between IG and CG groups (Table 1, P>0.05).
DIETARY SUPPLEMENTATION CHANGED NUTRITIONAL PARAMETERS:
The statistical difference for the dietary intake was insignificant between the 2 groups at 0 month (Table 2, P>0.05). After a 6-month intervention, the contents of sugar, proteins, lipids, calcium, phosphorus, and potassium in the IG group were higher than those in the CG group (Table 2, P<0.05). After a 12-month intervention, the levels of sugars, proteins, lipids, calcium, phosphorus, and potassium in the IG group were higher than those in the CG group (Table 2, P<0.05). The results suggest that nutritional supplement changed nutritional status in the IG group when compared to that in the CG group.
DIETARY SUPPLEMENTATION IMPROVED QUALITY OF LIFE PARAMETERS:
The statistical difference for the WHOQOL-BREF score was insignificant between the IG and CG groups at 0 months (Table 3, P>0.05). After a 6-month intervention, dietary supplementation increased the WHOQOL-BREF score in the IG group, which were higher than those in the CG group, including physical, psychological, and environment domains (Table 3, P<0.05). After a 12-month intervention, the scores were further increased in the IG group and were still higher than those in the CG group (Table 3, P<0.05).
The statistical difference for the SF-36 score was insignificant between the 2 groups at 0 months (Table 3, P>0.05). After 6 months of intervention, dietary supplementation had increased the SF-36 score in the IG group, which were higher than those in the CG group, including Physical role function, Body pain, General health, Vitality, and Emotional role (Table 3, P<0.05). After a 12-month intervention, the scores were further increased in the IG group and were still higher than those in the CG group, including all the items (Table 3, P<0.05). The results suggest that nutritional supplementation improved the quality of life of the subjects in the IG group when compared with the CG group by affecting WHOQOL-BREF and SF-36 scores.
NUTRITIONAL SUPPLEMENT INCREASED FPA LEVEL HIGHER THAN PA LEVEL:
The statistical difference for the PA level was insignificant at 0 months (Figure 2A, P>0.05). After a 6-month intervention, PA levels in the IG group were higher than those in the CG group (Figure 2A, P<0.05). After a 12-month intervention, the PA levels in the IG group were further increased and were higher than those in the CG group (Figure 2A, P<0.05). The different concentrations of human albumin and DDAMBB probes were mixed and reacted. As the concentration of human albumin increased, the fluorescent intensity was increased and showed the highest value at 662 nm (Figure 2B). Meanwhile, there was a perfect linear relationship between the concentrations of human albumin and fluorescent intensity (Figure 2C). The results suggested that the fluorescent probes performed well in detecting human albumin. The statistical difference for FPA level was insignificant at the 0 months (Figure 2D, P>0.05). After a 6-month intervention, the FPA levels in the IG group were higher than those in the CG group (Figure 2D, P<0.01). After a 12-month intervention, the FPA levels in the IG group were further increased and were higher than those in the CG group (Figure 2D, P<0.001). Comparatively, the increase in FPA concentration was higher than that in PA concentration in the IG group after 6-month and 12-month interventions (Figure 2E, P<0.05). These results suggest that nutritional supplementation increased FPA levels more than PA levels in the hemodialysis patients.
NUTRITIONAL SUPPLEMENT IMPROVED 6MWT:
The statistical difference for 6MWT values was insignificant at 0 months (Figure 3, P>0.05). After a 6-month intervention, the 6MWT values in the IG group were higher than those in the CG group (Figure 3, P<0.05). After a 12-month intervention, the values of 6MWT in the IG group increased and were higher than those in the CG group (Figure 3, P<0.01). The results suggest that nutritional supplementation improves physical activity and increases the values of 6MWT in hemodialysis patients.
FPA CONCENTRATION HAD A STRONGER NEGATIVE RELATIONSHIP WITH CRP LEVEL:
PA concentration had a strong relationship with CRP (Figure 4A). In contrast, the concentration of FPA had a stronger relationship with CRP level since the value of rho was lower (Figure 4B). The results suggest that FPA concentration had a stronger negative relationship with the CRP level and may be a potential biomarker to predict the status of physical activity in hemodialysis subjects.
THE LEVEL OF FPA HAD A STRONG RELATIONSHIP WITH THE PARAMETERS OF QUALITY OF LIFE:
PA concentration had a weak relationship with WHOQOL-BREF values with low rho values (Figure 5A). In contrast, the concentration of FPA had a strong relationship with WHOQOL-BREF values, since the rho values were over 0.5 (Figure 5B). Comparatively, the PA concentration had a weak relationship with SF-36 scores with low rho values (Figure 5C). In contrast, the concentration of FPA had a strong relationship with SF-36 scores since the values of rho were over 0.5 (Figure 5D). These results suggest that the concentration of FPA had a strong relationship with the parameters of quality of life and may be a potential biomarker to predict the quality of life in hemodialysis subjects.
FPA CONCENTRATION HAD A STRONG RELATIONSHIP WITH THE 6MWT VALUES:
PA concentration had a weak relationship with 6MWT values with low rho values (Figure 6A). In contrast, the concentration of FPA had a strong relationship with 6MWT values since the values of rho were more than 0.5 (Figure 6B). These results suggest that FPA concentration had a strong relationship with the 6MWT values and may be a potential biomarker to predict the status of physical activity in hemodialysis subjects.
Discussion
The results showed that nutritional supplement improved the wellbeing and walking ability in patients undergoing hemodialysis. Meanwhile, the nutritional supplementation increased the level of PA less than the level of FPA of the patients in the IG group. The levels of FPA had a significant association with the parameters of quality of life and 6MWT but not PA. Nutritional supplementation is an effective way to promote the wellbeing of hemodialysis patients. FPA may be a potential biomarker to predict the prognosis of hemodialysis patients.
Rates of nutritional deficiency in people receiving maintenance hemodialysis are still high [2]. Malnutrition can cause micro-inflammatory reactions, leading to cardiovascular events, and seriously affects the survival time and quality of life of patients [25]. Healthy diets and nutritional status are very important for these patients, and maintaining a good nutritional status helps reduce the risk of kidney problems and secondary complications. Hemodialysis patients lose nutrients during dialysis and nutritional status should be considered for the treatment plan, prognosis, and wellbeing of these patients. Low-level albumin is an important cause of malnutrition [26]. To verify the stability, accuracy, and specificity of PA quantitative detection to control nutrition deficiency in hemodialysis patients, the present research was carried out. The results indicated showed that nutritional supplementation increased the level of PA. However, the Pearson correlation coefficient test showed that PA level had a weak relationship with the quality of life and physical activity, suggesting that plasma PA may not be sufficiently specific or sensitive in evaluating patient outcomes.
FPA, a form of glycated PA, has high detection sensitivity, little environmental interference, and good biocompatibility, and its sensitivity and specificity were confirmed in patients undergoing maintenance hemodialysis. The results of the present study showed no statistically significant difference in albumin level between the 2 groups of patients at 0 months after enrollment, indicating that the results of the 2 detection methods were consistent during this period. Compared with the albumin levels at 6 and 12 months after enrollment, the difference was statistically significant (Figure 2,
CRP is an acute-phase reactant, while albumin is a negative acute-phase reactant. The level of albumin has a negative relationship with the level of CRP. Comparatively, FPA has stronger negative relationship with the levels of CRP when compared with PA (Figure 4).
Serum glycated albumin (SGA) has been used to predict all-cause mortality in dialysis patients [27,28]. Elevated levels of SGA were associated with death in patients with diabetes mellitus on hemodialysis [29]. High levels of SGA were also associated with cardiovascular outcomes and death [30]. However, the effects of the nursing nutritional intervention have seldom been studied using FPA in patients on maintenance hemodialysis. The results showed a potential predictor for the nursing results of the nutritional intervention in hemodialysis patients. Notably, the evaluated levels of FPA may be beneficial to the hemodialysis patients since the dietary supplementation increased its level (Figure 2B), improved quality of life, and increased the values of WHOQOL-BREF and SF-36 (Table 3, and Figure 3). These findings agree with earlier reports.
Some limitations should be considered in future work. It seems that all patients have a narrow duration of dialysis. The hemodialysis durations (years) were 3.52±2.06 and 3.37±2.52 in the IG and CG groups, respectively, so the duration was 1.46–5.58 and 0.85–5.89, respectively. These results may be caused by the small sample size in the present study. Furthermore, a few patients with longer duration of dialysis tended to refuse to participate in our study. The function of PA and FPA were not explored in hemodialysis patients. The detail mechanisms for the functional roles of FPA are still unknown. Nursing nutritional intervention in hemodialysis patients is often complicated and costly. The dietary supplementation was not determined based on personal appetites (the nutritional supplementation was well accepted by all the patients) or malnutrition, which was only determined by the low level of GA. Although the proportion of patients with diabetic nephropathy is increasing in long-term dialysis patients, the relationship between the level of adiponectin and the classification of diabetic nephropathy was not explored because of the small size of the sample population in this study. Further in-depth research is needed to address these important issues in a larger dialysis population in future work.
Conclusions
This study verified the sensitivity and specificity of FPA for nursing nutritional intervention in hemodialysis patients. Based on clinical care, using FPA to assess the nutritional status of hemodialysis patients will be helpful to improve the quality of life and physical activity of patients. Personalized nutritional supplementation can be a method to prevent nutritional deficiency. Using FPA may be a good way to assess the medical outcomes of subjects on long-term maintenance hemodialysis. The present conclusions need to be verified in studies with larger sample sizes and long-term follow-up.
Figures
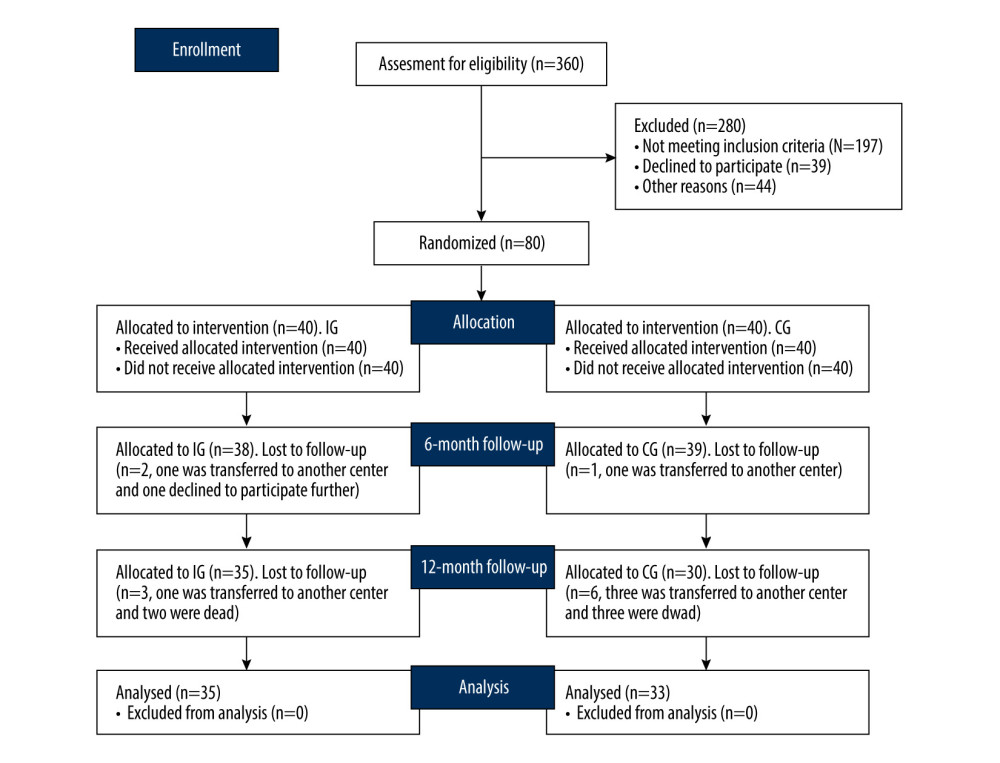 Figure 1. The present study CONSORT (Consolidation of Standards for Reporting Trials).
 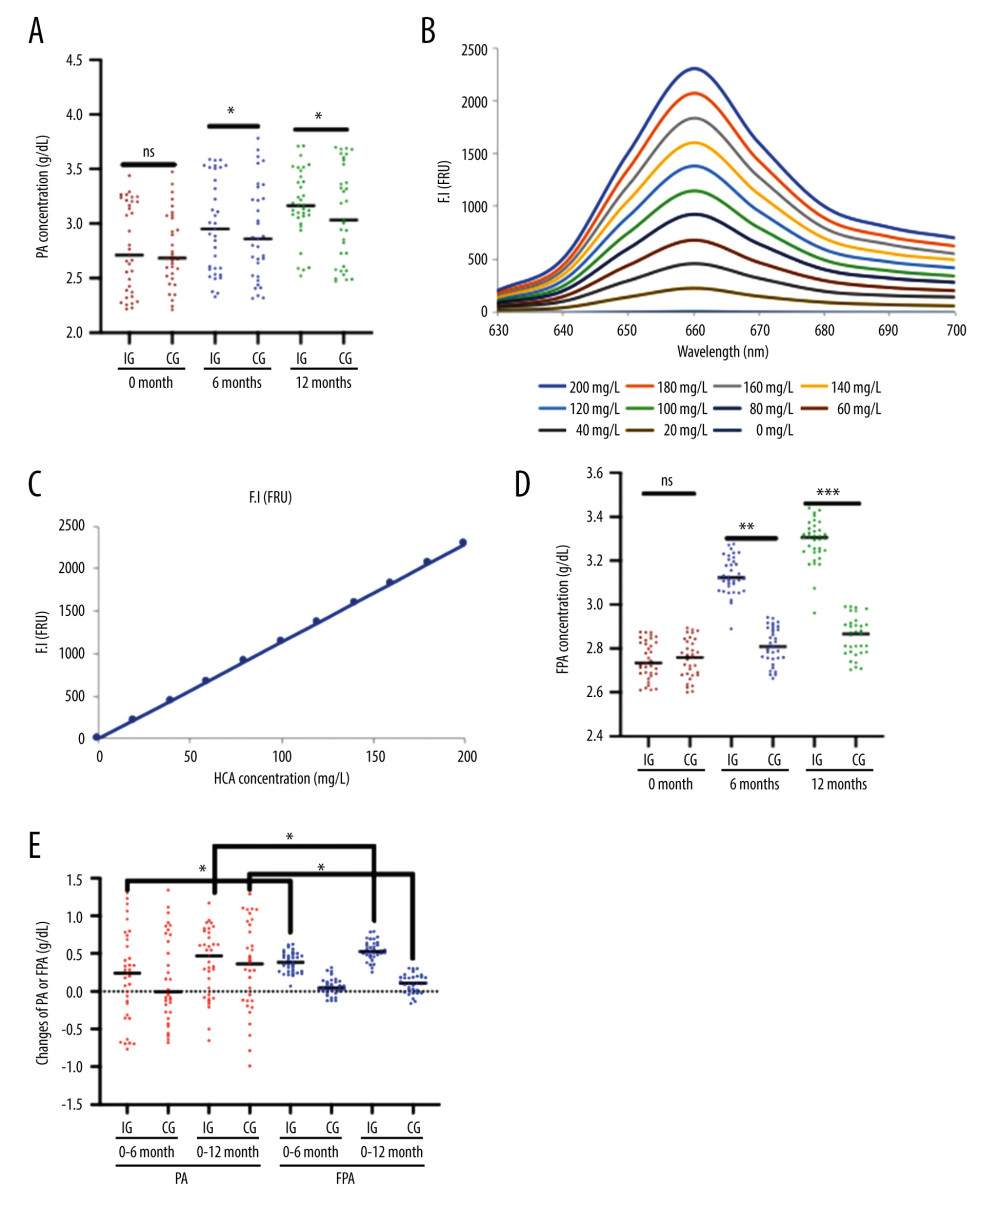 Figure 2. Plasma levels of albumin measured using ELISA (PA) and albumin measured using fluorescent probe (FPA) between the 2 groups. (A) PA concentration (* P<0.05 vs the IG group). (B) The fluorescent profile of DDAMBB probes mixing with different concentrations of human albumin. As the concentration of human albumin increased, the PFA increased and showed the highest value at 662 nm. (C) The linear relationship between the concentrations of human albumin and fluorescent intensity. (D) FPA concentration (** P<0.01 and *** P<0.001 vs the IG group). (E) Changes in PA and PFA concentration (g/dl) from 0 to 6 months and 12 months of intervention (* P<0.05 vs PA). The hemolysis patients were divided into either the Control Group (CG, n=35) or the Intervention Group (IG, n=33). The IG received nutritional supplementation, and the CG group received routine nutritional support. The statistical difference was insignificant for ns between the 2 groups. * P<0.05, ** P<0.01 and *** P<0.001 vs the IG group.
 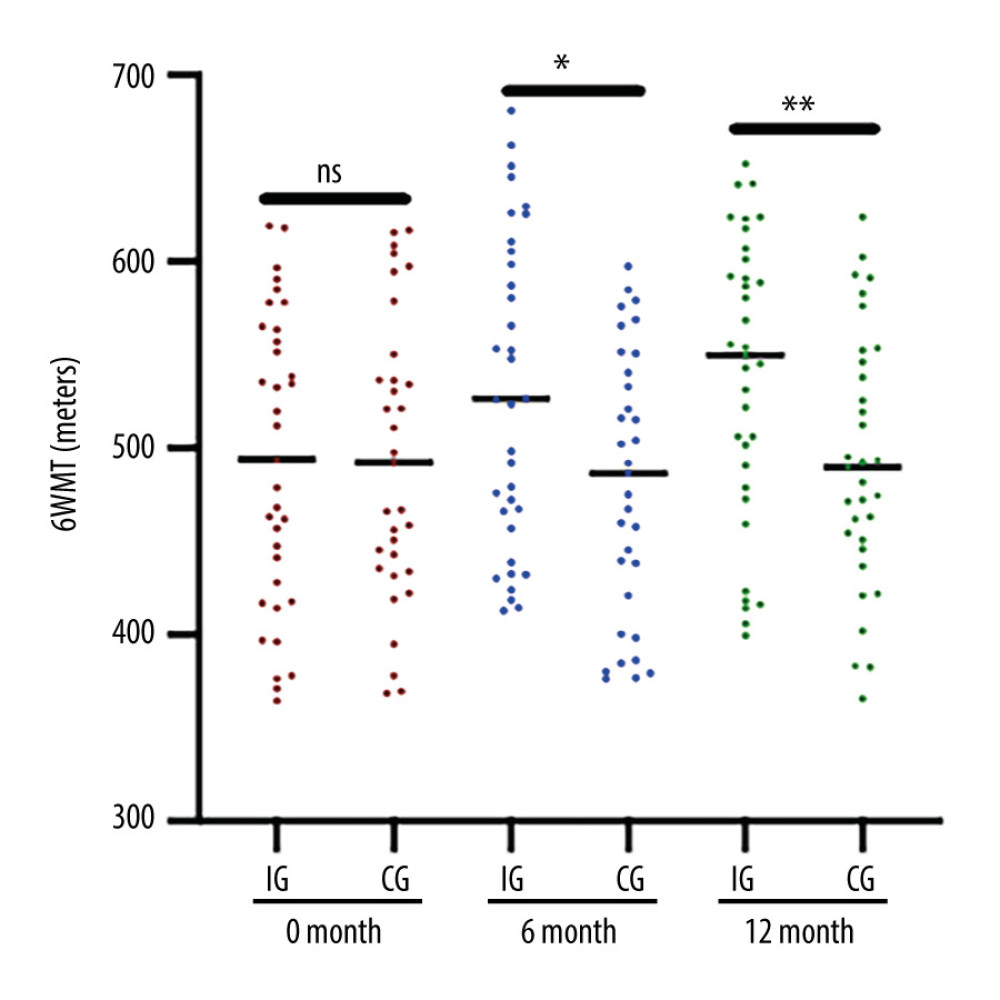 Figure 3. Six-minute walk test (6MWT) results in the 2 groups. The hemolysis patients were divided into either the Control Group (CG, n=35) or the Intervention Group (IG, n=33). The IG received nutritional supplementation, and the CG group received routine nutritional support. The statistical difference was insignificant for ns between the 2 groups. * P<0.05, and ** P<0.01 vs the IG group.
 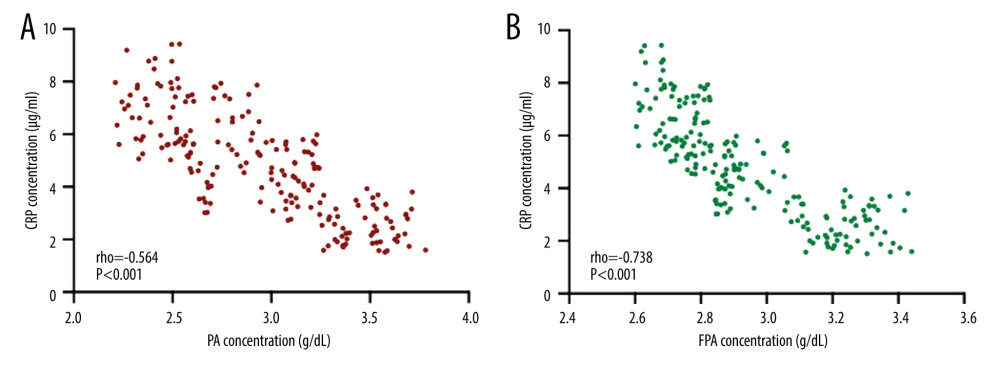 Figure 4. Pearson correlation coefficient test of the relationship between plasma levels of albumin measured using ELISA (PA) or albumin measured using fluorescent probe (FPA) and the levels of CRP. (A) The relationship between CRP and PA concentration. (B) The relationship between CRP and FPA concentration. There is a strong negative relationship between the 2 variables if rho <−0.5.
 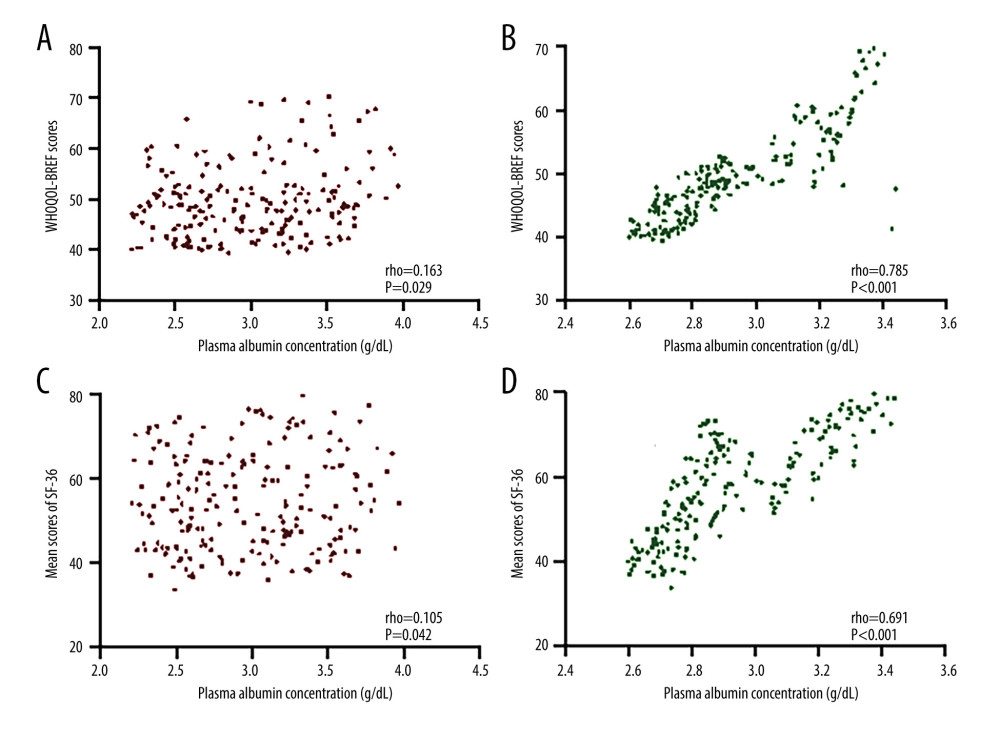 Figure 5. Pearson correlation coefficient test of the relationship between the plasma levels of albumin measured using ELISA (PA) or albumin measured using fluorescent probe (FPA) and the World Health Organization Quality of Life: Brief Version (WHOQOL-BREF) or the Medical Outcomes Study 36-item Short-Form Health Survey (SF-36) scores. (A) The relationship between WHOQOL-BREF and PA concentration. (B) The relationship between WHOQOL-BREF and FPA concentration. (C) The relationship between SF-36 and PA concentration. (D) The relationship between SF-36 and FPA concentration. There is a strong relationship between the 2 variables if rho >0.5.
 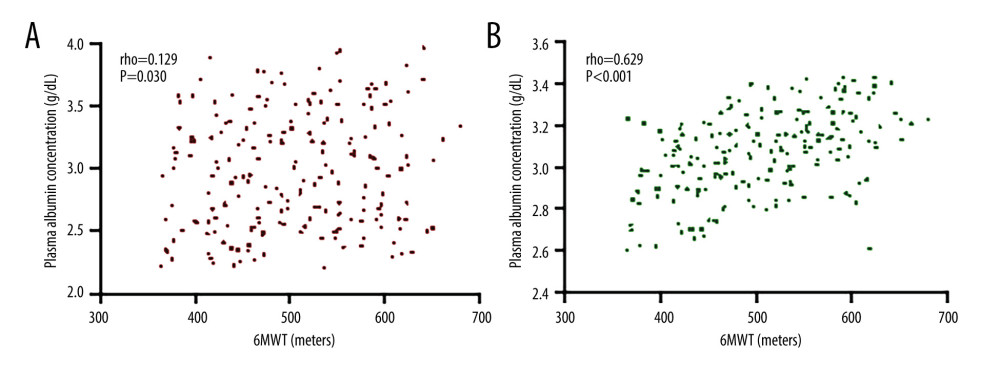 Figure 6. Pearson correlation coefficient test of the relationship between plasma levels of albumin measured using ELISA (PA) or albumin measured using fluorescent probe (FPA) and 6-minute walk test (6MWT). (A) The relationship between 6MWT and PA concentration. (B) The relationship between 6MWT and FPA concentration. There is a strong relationship between the 2 variables if rho >0.5.
 References
1. Plytzanopoulou P, Papasotiriou M, Politis P, Malnutrition as a risk factor for cardiac valve calcification in patients under maintenance dialysis: A cross-sectional study: Int Urol Nephrol, 2020; 52(11); 2205-12
2. Zhou J, Yang T, The efficacy of L-carnitine in improving malnutrition in patients on maintenance hemodialysis: A meta-analysis: Biosci Rep, 2020; 40(6); BSR20201639
3. El Ati Z, Machfar H, Boussafa H, Metabolic syndrome, malnutrition, and its associations with cardiovascular and all-cause mortality in hemodialysis patients: Follow-up for three years: Saudi J Kidney Dis Transpl, 2020; 31(1); 129-35
4. Huang Z, Fang J, Song A, The association between self-management ability and malnutrition-inflammation-atherosclerosis syndrome in peritoneal dialysis patients: A cross-sectional study: BMC Nephrol, 2021; 22(1); 13
5. Jasani R, Nutrition in dialysis patients: Journal of Renal Nutrition and Metabolism, 2018; 4(2); 48
6. Jo I-Y, Kim WJ, Park HC, Effect of personalized nutritional counseling on the nutritional status of hemodialysis patients: Clin Nutr Res, 2017; 6(4); 285-95
7. Xiao S, Feng F, Liu N, Preoperative albumin level is superior to albumin-globulin ratio as a predicting indicator in gastric cancer patients who underwent curative resection: Cancer Manag Res, 2019; 11; 9931-38
8. Van Gelder MK, Abrahams AC, Joles JA, Albumin handling in different hemodialysis modalities: Nephrol Dial Transplant, 2018; 33(6); 906-13
9. Krowsoski L, Yeh DD, Nutrition in the geriatric surgical patient: Principles and Practice of Geriatric Surgery, 2020; 135-58
10. Delanghe JR, Himpe J, De Cock N, Sensitive albuminuria analysis using dye-binding based test strips: Clinica Chimica Acta, 2017; 471; 107-12
11. Haxhiu M, Method development and validation for determination of human serum albumin monomer, dimer and other aggregates using size exclusion chromatography: Northeastern Illinois University, 2019
12. Del Valle R, Cazanave Mora JM, Carrazana San Martín NL, An enzyme immunoassay for determining albumin in human urine samples using an ultra-microanalytical system: J Immunoassay Immunochem, 2020; 41(5); 896-912
13. Usoltsev D, Sitnikova V, Kajava A, Systematic FTIR spectroscopy study of the secondary structure changes in human serum albumin under various denaturation conditions: Biomolecules, 2019; 9(8); 359
14. Ge G-B, Feng L, Jin Q, A novel substrate-inspired fluorescent probe to monitor native albumin in human plasma and living cells: Anal Chim Acta, 2017; 989; 71-79
15. Sun Y, Characterization and medical application research of human albumin small molecule fluorescent probe DDABP: Masters thesis: Zhengzhou University, 2018
16. Heaf J, Heiro M, Petersons A, Suboptimal dialysis initiation is associated with comorbidities and uraemia progression rate but not with estimated glomerular filtration rate: Clin Kidney J, 2020; 14(3); 933-42
17. Kadam P, Bhalerao S, Sample size calculation: Int J Ayurveda Res, 2010; 1(1); 55-57
18. Bosl WJ, Li R, The role of noise and positive feedback in the onset of autosomal dominant diseases: BMC Syst Biol, 2010; 4(1); 93
19. Plumb TJ, Alvarez L, Ross DL, Safety and efficacy of the Tablo hemodialysis system for in-center and home hemodialysis: Hemodial Int, 2020; 24(1); 22-28
20. Amro A, Waldum-Grevbo B, von der Lippe N, Symptom clusters from dialysis to renal transplantation: A five-year longitudinal study: J Pain Symptom Manag, 2016; 51(3); 512-19
21. Feng Y, Shi X, Shi J, Immunogenicity, antibody persistence, and safety of the 60 μg hepatitis B vaccine in hemodialysis patients: A multicenter, randomized, double-blind, parallel-controlled trial: Expert Rev Vaccines, 2017; 16(10); 1045-52
22. Calegari A, Barros EG, Veronese FV, Malnourished patients on hemodialysis improve after receiving a nutritional intervention: J Bras Nephrol, 2011; 33(4); 394-401
23. Li Y-P, He Y-N, Zhai FComparison of assessment of food intakes by using 3 dietary survey methods: Zhonghua Yu Fang Yi Xue Za Zhi, 2006; 40(4); 273-80 [in Chinese]
24. Duarte SB, Chaveiro N, de Freitas AR, Validation of the WHOQOL-Bref instrument in Brazilian sign language (Libras): Qual Life Res, 2021; 30(1); 303-13
25. Choi SR, Lee Y-K, Cho AJ, Malnutrition, inflammation, progression of vascular calcification and survival: Inter-relationships in hemodialysis patients: PLoS One, 2019; 14(5); e0216415
26. Fu MC, D’Ambrosia C, McLawhorn AS, Malnutrition increases with obesity and is a stronger independent risk factor for postoperative complications: A propensity-adjusted analysis of total hip arthroplasty patients: J Arthroplasty, 2016; 31(11); 2415-21
27. Copur S, Siriopol D, Afsar B, Serum glycated albumin predicts all-cause mortality in dialysis patients with diabetes mellitus: Meta-analysis and systematic review of a predictive biomarker: Acta Diabetol, 2020; 58(1); 81-91
28. Hayashi A, Takano K, Masaki T, Distinct biomarker roles for HbA1c and glycated albumin in patients with type 2 diabetes on hemodialysis: J Diabetes Complications, 2016; 30(8); 1494-99
29. Chen CW, Drechsler C, Suntharalingam P, High glycated albumin and mortality in persons with diabetes mellitus on hemodialysis: Clin Chem, 2017; 63(2); 477-85
30. Mihara A, Ohara T, Hata J, Association between serum glycated albumin and risk of cardiovascular disease in a Japanese community: The Hisayama Study: Atherosclerosis, 2020; 311; 52-59
Figures
Figure 1. The present study CONSORT (Consolidation of Standards for Reporting Trials).Figure 2. Plasma levels of albumin measured using ELISA (PA) and albumin measured using fluorescent probe (FPA) between the 2 groups. (A) PA concentration (* P<0.05 vs the IG group). (B) The fluorescent profile of DDAMBB probes mixing with different concentrations of human albumin. As the concentration of human albumin increased, the PFA increased and showed the highest value at 662 nm. (C) The linear relationship between the concentrations of human albumin and fluorescent intensity. (D) FPA concentration (** P<0.01 and *** P<0.001 vs the IG group). (E) Changes in PA and PFA concentration (g/dl) from 0 to 6 months and 12 months of intervention (* P<0.05 vs PA). The hemolysis patients were divided into either the Control Group (CG, n=35) or the Intervention Group (IG, n=33). The IG received nutritional supplementation, and the CG group received routine nutritional support. The statistical difference was insignificant for ns between the 2 groups. * P<0.05, ** P<0.01 and *** P<0.001 vs the IG group.Figure 3. Six-minute walk test (6MWT) results in the 2 groups. The hemolysis patients were divided into either the Control Group (CG, n=35) or the Intervention Group (IG, n=33). The IG received nutritional supplementation, and the CG group received routine nutritional support. The statistical difference was insignificant for ns between the 2 groups. * P<0.05, and ** P<0.01 vs the IG group.Figure 4. Pearson correlation coefficient test of the relationship between plasma levels of albumin measured using ELISA (PA) or albumin measured using fluorescent probe (FPA) and the levels of CRP. (A) The relationship between CRP and PA concentration. (B) The relationship between CRP and FPA concentration. There is a strong negative relationship between the 2 variables if rho <−0.5.Figure 5. Pearson correlation coefficient test of the relationship between the plasma levels of albumin measured using ELISA (PA) or albumin measured using fluorescent probe (FPA) and the World Health Organization Quality of Life: Brief Version (WHOQOL-BREF) or the Medical Outcomes Study 36-item Short-Form Health Survey (SF-36) scores. (A) The relationship between WHOQOL-BREF and PA concentration. (B) The relationship between WHOQOL-BREF and FPA concentration. (C) The relationship between SF-36 and PA concentration. (D) The relationship between SF-36 and FPA concentration. There is a strong relationship between the 2 variables if rho >0.5.Figure 6. Pearson correlation coefficient test of the relationship between plasma levels of albumin measured using ELISA (PA) or albumin measured using fluorescent probe (FPA) and 6-minute walk test (6MWT). (A) The relationship between 6MWT and PA concentration. (B) The relationship between 6MWT and FPA concentration. There is a strong relationship between the 2 variables if rho >0.5. Tables
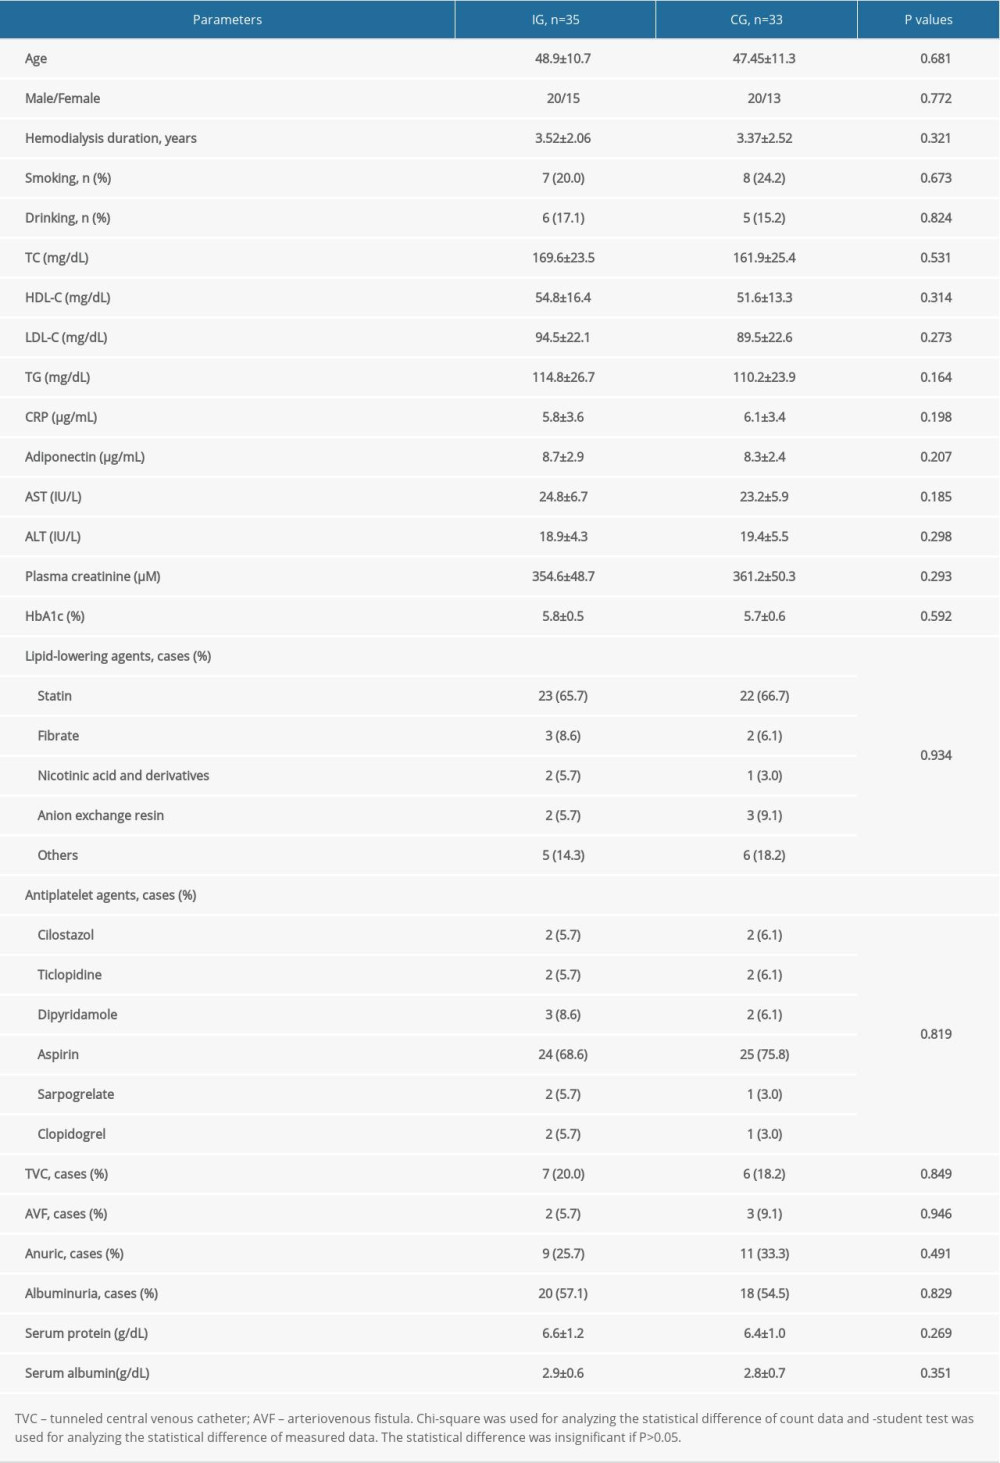 Table 1. Clinical baseline characteristics between the 2 groups.
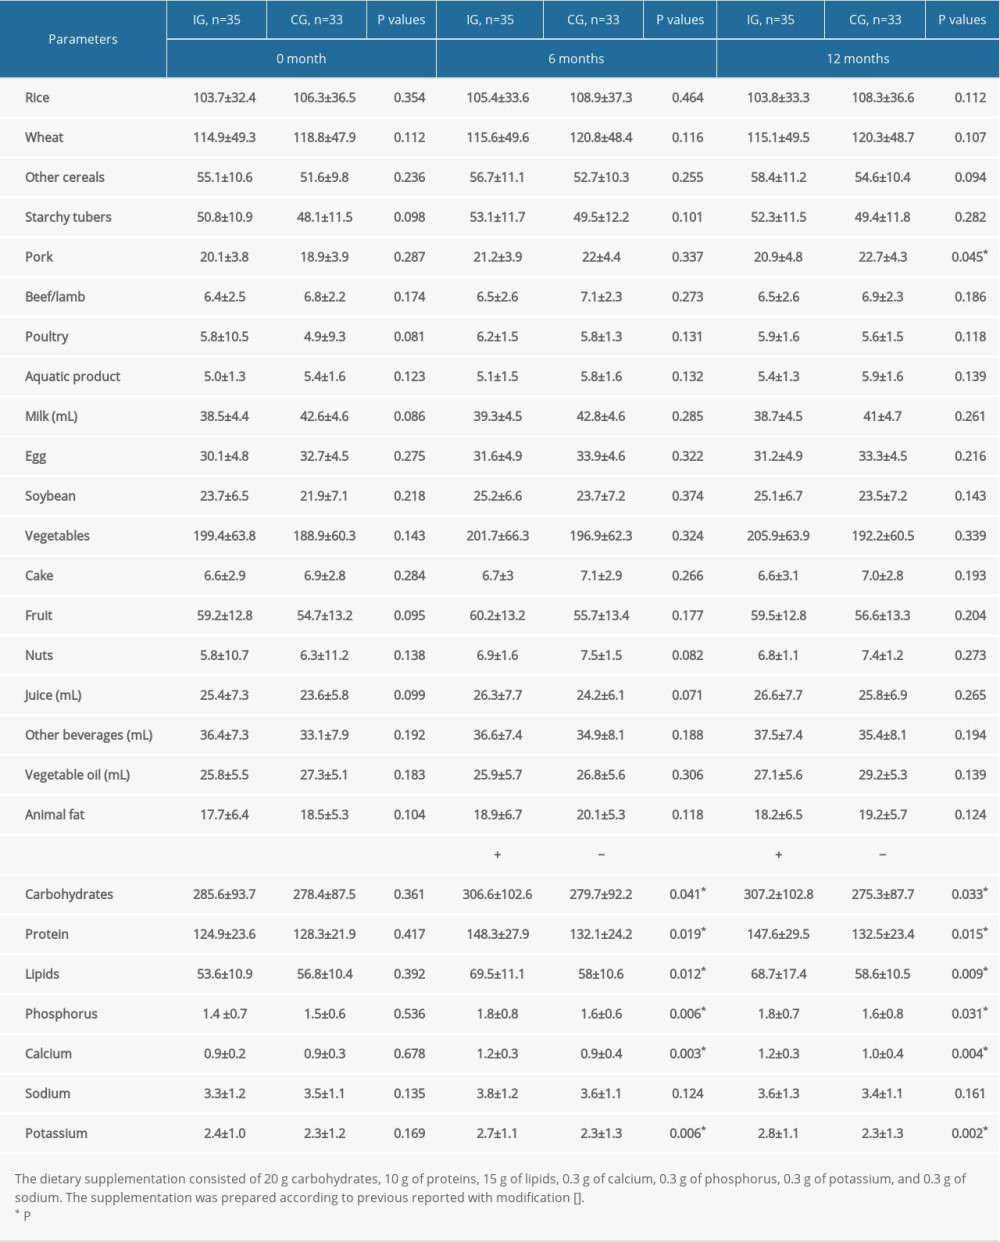 Table 2. Food consumption of the hemodialysis patients according to dietary patterns (mean±standard deviation, g/day).
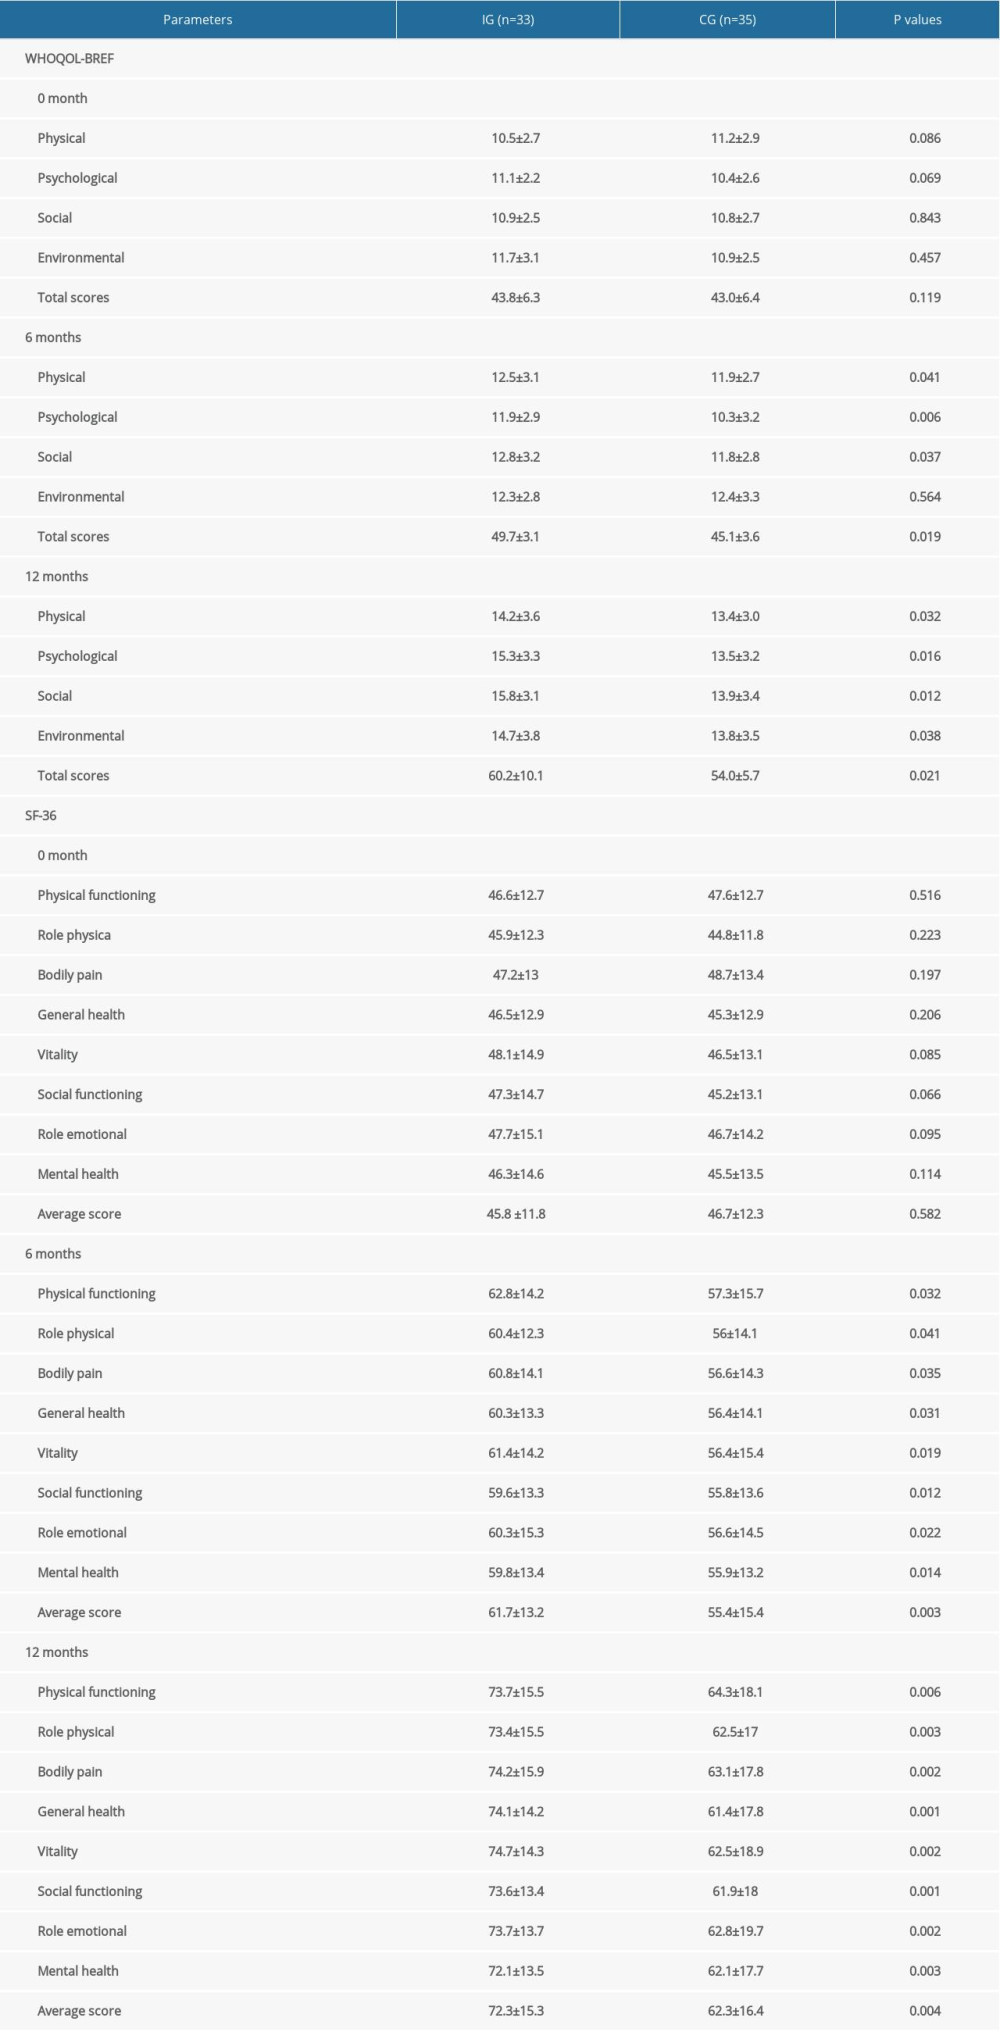 Table 3. Comparison of WHOQOL-BREF and SF-36 between the 2 groups.Table 1. Clinical baseline characteristics between the 2 groups.Table 2. Food consumption of the hemodialysis patients according to dietary patterns (mean±standard deviation, g/day).Table 3. Comparison of WHOQOL-BREF and SF-36 between the 2 groups.
 In Press
Clinical Research
Effects of Single-Bout Endurance Exercise Intensity on Peripheral Neurotrophic Factors in Patients With Isc...Med Sci Monit In Press; DOI: 10.12659/MSM.952089
Review article
Anisodus tanguticus in Cancer Research: A Review of Traditional Use, Phytochemistry, Extraction Methods, an...Med Sci Monit In Press; DOI: 10.12659/MSM.952999
Clinical Research
Nasal Mucociliary Clearance and Its Relationship With Disease Severity in Patients With Multiple SclerosisMed Sci Monit In Press; DOI: 10.12659/MSM.952850
Clinical Research
Modified Thoracoabdominal Nerves Block Through the Perichondrial Approach vs Subcostal Transversus Abdomini...Med Sci Monit In Press; DOI: 10.12659/MSM.953976
Most Viewed Current Articles
17 Jan 2024 : Review article 14,176,570
Vaccination Guidelines for Pregnant Women: Addressing COVID-19 and the Omicron VariantDOI :10.12659/MSM.942799
Med Sci Monit 2024; 30:e942799
13 Nov 2021 : Clinical Research 3,762,188
Acceptance of COVID-19 Vaccination and Its Associated Factors Among Cancer Patients Attending the Oncology ...DOI :10.12659/MSM.932788
Med Sci Monit 2021; 27:e932788
14 Dec 2022 : Clinical Research 2,466,310
Prevalence and Variability of Allergen-Specific Immunoglobulin E in Patients with Elevated Tryptase LevelsDOI :10.12659/MSM.937990
Med Sci Monit 2022; 28:e937990
16 May 2023 : Clinical Research 708,927
Electrophysiological Testing for an Auditory Processing Disorder and Reading Performance in 54 School Stude...DOI :10.12659/MSM.940387
Med Sci Monit 2023; 29:e940387