14 August 2021: Database Analysis
Identification of Mucus-Associated Molecular Subtypes of Chronic Obstructive Pulmonary Disease: A Latent Profile Analysis Based on MUC5B-Associated Genes
Yuanlong Hu1ACE, Xiaomeng Cheng1BCEF, Zhanjun Qiu2ADG*, Xianhai Chen2ADFGDOI: 10.12659/MSM.931222
Med Sci Monit 2021; 27:e931222


Abstract
BACKGROUND: Chronic obstructive pulmonary disease (COPD) is a disease with high heterogeneity, which is a major challenge in clinical individualized treatment. A mucus phenotype is one of the main characteristics of COPD.
MATERIAL AND METHODS: Gene expression profiles of lung tissue samples were from the Lung Genomics Research Consortium. MUC5B-associated gene signatures were obtained based on a nonlinear feature screening algorithm. These signatures were used to fit a latent profile analysis (LPA) model to identify COPD molecular subtypes and build a subtype classifier to verify the subtypes. Then, we explored the characteristics of cilium assembly and beating signatures, transcriptome features, immune infiltration among the 3 subtypes by xCell, single-sample gene set enrichment analysis, network perturbation amplitude, and weighted gene co-expression network analysis algorithms. An external dataset was used to verify the above COPD subtypes.
RESULTS: Three subtypes associated with mucus were identified by LPA and verified in an external dataset. Subtype 1 displayed higher T helper type 1 (Th1) and basophil infiltration, higher Th17/regulatory T cells (Tregs) ratio, a higher level of cilium assembly and beating, and lower mast cell and Treg infiltration. The subtypes 2 and 3 demonstrated higher macrophage M2 infiltration in lung tissue, while subtype 3 had higher neutrophil and eosinophil infiltration than subtype 2.
CONCLUSIONS: Overall, this work identified 3 mucus-associated molecular subtypes related to MUC5B expression, which deepens the understanding of airway mucus secretion in COPD and potentially provides valuable information for precision therapy.
Keywords: Classification, Mucin-5B, Mucus, Pulmonary Disease, Chronic Obstructive, Databases, Genetic, Genotype, Mast Cells, Mucins, Neutrophils, Phenotype, Th17 Cells
Background
Mucus serves a vital role in mucociliary clearance (MCC) and host defense, which help to maintain the lung health [1]. However, a substantial proportion of patients with chronic obstructive pulmonary disease (COPD) experience chronic mucus hypersecretion. This hypersecretion is associated with severe airflow limitation [2], poor quality of life [2–4], a higher number of exacerbations and hospitalizations [2–6], and mortality [7–9].
Normally, MCC of the lung consists of 3 elements: motile cilia, a periciliary liquid layer, and a mucus layer [10]. Previous studies [11–13] showed that MUC5AC and MUC5B are the major oligomeric respiratory mucins. However, the functions of MUC5AC and MUC5B are thought to be different, because of the differences in secretion sites, domain structure, and glycosylation [14].
The traditional theory holds that the mucous phenotype of COPD is driven by MUC5AC, and the contribution of MUC5B is unnecessary. However, a series of studies in recent years have shown that MUC5B plays a dominant role in the mucous phenotype of COPD. First, a previous study found that MUC5B [15] is a major polymeric mucin from COPD sputum. Second, MUC5B is critical to respiratory innate immunity and MCC, while MUC5AC is secondary. Lowering MUC5B levels could result in airway obstruction by mucus, MCC damage, and increased infection risk [14,16]. Thus, understanding the utility and role of MUC5B in COPD is important [17].
The heterogeneity of MUC5B expression can affect the heterogeneity of the mucus phenotype. A search of the literature revealed only a few studies that evaluated the heterogeneity of MUC5B expression and relationship between MUC5B with the lung immune microenvironment. Therefore, the aim of our study was to better understand the correlation of MUC5B expression with MCC and inflammation. In the present study, a latent profile analysis (LPA) method based on MUC5B-associated genes was carried out to identify the COPD subtypes, and the findings were validated in another COPD dataset. Then, we identified the characteristics of cilium assembly and beating signatures, transcriptome features, and immune infiltration in the COPD subtypes.
Material and Methods
DATA SOURCE:
The gene expression profile GSE47460 was downloaded from Gene Expression Omnibus (GEO, http://www.ncbi.nlm.nih.gov/geo/) by GEOquery R package (version 2.56.0). The publicly available data of the whole-lung homogenate samples in GSE47460, which was from the Lung Genomics Research Consortium, were from individuals undergoing thoracic surgery. Individuals with cystic fibrosis or pulmonary hypertension were excluded. A total of 220 patients with COPD and 108 donor control subjects were selected from the GSE47460-GPL6480 (75 cases and 17 controls) and GSE47460-GPL14550 (145 cases and 91 controls) cohorts. Patient characteristics are detailed in Supplementary Table 1. The expression profile data of COPD patients were selected for subsequent clustering analysis.
TWO-STEP FEATURE SELECTION:
We designed a 2-step feature selection pipeline to identify MUC5B-related gene signatures. In the first step, the maximal information coefficient (MIC) [18] was used to test the dependence between MUC5B with other genes and whether they have a linear or nonlinear relationship, calculated with the minerva R package (version 1.5.8). The MIC values between MUC5B and the expression of other genes in GSE47460-GPL6480 and GSE47460-GPL14550 cohorts were calculated, respectively. The robust rank aggregation (RRA) algorithm was used to evaluate the consistency of the rank of genes with MIC ≥0.3 in 2 cohorts by RobustRankAggreg R package (version 1.1). Genes with an RRA score <0.05 were considered to be the genes obtained by feature selection in the first step.
In the second step, the Boruta algorithm with default parameters based on the random forest algorithm was used to identify the genes significantly associated with MUC5B from the one-step genes by Boruta R package (version 7.0.0). The “rejected” genes were excluded. Then, the overlapping genes in the 2 cohorts were confirmed as the final selected genes.
LATENT PROFILE ANALYSIS:
To estimate the optimal number of subtypes, latent profile models were fit in tidyLPA (version 1.0.8) and mclust (version 5.4.6) R package based on the selected genes [19]. Models ranging from 2 to 5 subtypes and specified variable variances and covariances arguments were estimated to identify the optimal number of subtypes and parameter combinations. From these models, the best fit was evaluated by the analytic hierarchy process method [18] using Akaike information criterion, approximate weight of evidence, bayesian information criterion, classification likelihood criterion, and Kullback information criterion.
CLASSIFIER CONSTRUCTION:
Following the previous research of Chen et al [20], we used a similar method to construct a subtype classifier. For each subtype, we computed the average expression value for each of the selected genes based on the gene expression data. We then computed the cosine similarity between each external expression profile and each subtype averaged profile. We assigned each external COPD case to a subtype, according to which subtype profile showed the highest correlation with the given external dataset profile.
WEIGHTED GENE CO-EXPRESSION NETWORK ANALYSIS:
Weighted gene co-expression network analysis (WGCNA) was used to correlate or associate highly co-expressed genes (modules) with 3 subtypes by WGCNA R package (version 1.69). Modules were selected as further research objects, which displayed high correlation according to module-trait relationships. The module with the highest positive or negative correlation for each COPD subtype was considered to be the key module.
PATHWAY ANALYSIS:
The clusterProfiler (version 3.16.0) and ReactomePA (version 1.32.0) were used to evaluate the biological and functional relevance within COPD subtypes gene-enriched modules. The overrepresentation of gene ontology (GO) categories, Kyoto Encyclopedia of Genes and Genomes (KEGG), and Reactome pathways was examined (Bonferroni-corrected
NETWORK ANALYSIS:
We constructed the protein-protein interaction network (PPI) using STRING (
IMMUNE MICROENVIRONMENTS IN COPD-AFFECTED LUNG TISSUE ANALYSIS:
The relative abundance across lung tissue of immune cells was scored using xCell R package (version 1.1.0) [21]. The xCell algorithm is a gene signature-based method, which is used to examine whole-lung tissue gene expression data to infer 10 immune cell types, including type 1 T helper (Th1) cells, type 2 T helper (Th2) cells, regulatory T cells (Tregs), basophils, eosinophils, neutrophils, mast cells, macrophages M1, and macrophages M2.
To verify the results of xCell, the single-sample gene set enrichment analysis (ssGSEA) algorithm was used to re-evaluate the immune score by GSVA R package (version 1.36.0), including Th1 cells, Th2 cells, activated Th1 cells, activated Th2 cells, Th17 cells, Tregs, basophils, eosinophils, neutrophils, mast cells, macrophages M1, and macrophages M2. In addition, the ratios of Th1 score to Th2 score, activated Th1 to activated Th2, Th17 to Tregs, and macrophages M1 to macrophages M2 were calculated using the ssGSEA score. The gene set and the detailed calculation method used in the calculation are shown in Supplementary Table 2.
Further, the network perturbation amplitude (NPA) methodology was used to obtain a quantitative assessment of how the cause-and-effect network models of neutrophil signaling interprets the transcriptomic difference between the various subtypes [22,23]. The NPA R package (https://github.com/philipmorrisintl/NPA) was used to perform NPA analysis, and the network models were provided with the NPAModels R package (https://github.com/philipmorrisintl/NPAModels) [24]. O and K statistics were used to test the specificity of the network models [25]. A network was confirmed to be significantly affected if the P value of the confidence interval, *O, and K* statistics were below 0.05.
OTHER STATISTICAL ANALYSIS:
All analyses and data plotting were performed using R software (version 4.0.2) and Rstudio (version 1.3.1093) for Windows, and
Results
THREE MOLECULAR SUBTYPES RELATED TO MUCUS SECRETION:
Twelve gene signatures were identified using the 2-step feature selection pipeline (Figure 1A) and were selected as indicator variables for constructing latent profiles, including BPIFB1, SERPINB3, SERPINB4, FAM83F, GSTA2, GSTA5, PLEKHS1 (C10orf81), ABCA13, TSPAN19, KRT15, ATP12A, and ANKFN1. The model with equal variances and equal covariances is considered to be the best fit in the GSE47460-GPL14550 dataset (Supplementary Table 3). Three distinct subtypes were identified, namely subtype 1, subtype 2, and subtype 3. The principal components analysis showed a relatively stable partitioning of the samples in the 3 subtypes (Figure 1B). By differential expression analysis of 3 subtypes, 12 genes of subtype 1 were found to be significantly upregulated compared with subtypes 2 and 3 (Figure 1C). Similarly, the expression level of MUC5B showed the same trend. Further analysis of MUC5B expression showed that there was no significant difference between subtype 2 and normal samples, but subtypes 1 and 3 were significantly upregulated. The main source of MUC5B production was considered to be the cells of the submucosal glands and superficial epithelium of small airways [26]. Human SCGB3A2 is the biomarker of serous-like cells of the submucosal gland acinus [27], and subtypes 1 and 3 had a higher level of SCGB3A2 expression than subtype 2 (Figure 2A). Thus, subtypes 1 and 3 were mucus phenotypes.
We constructed the classifier and tested its performance using a confusion matrix (Figure 2B). Using this classifier, 3 subtypes were verified on another dataset (GSE47460-GPL6480), and the results showed high consistency (Figure 2C).
We further analyzed the relationship between the 3 subtypes and clinical characteristics, which revealed that the differences in the clinical characteristics were not significant in the 2 datasets, including the age, sex, smoking status, emphysema, diffusing capacity for carbon monoxide, forced expiratory volume in the first second of expiration, and forced vital capacity (Table 1, Supplementary Table 4).
TWO KEY MODULES RELATED TO 3 MOLECULAR SUBTYPES IDENTIFIED BY WGCNA:
WGCNA identified 34 modules (Figure 3A) in the GSE47460-GPL14550 dataset; of these, the eigengene was significantly associated with the 3 subtypes in 17 (Figure 3A). We found the blue module (MEblue) displaying highest correlation was significantly associated with COPD molecular subtypes (Figure 3A).
To investigate the biological functions of MEblue, the pathway analysis of GO-biological process, KEGG, and Reactome were performed in the target genes corresponding to each module. The key biological functions of MEblue were associated with cilium assembly and beating (Figure 3B, Supplementary Table 5).
We constructed the PPI network on the basis of the MUC5B-related genes in the MEblue and calculated the topological features of each node. Afterward, a subnetwork was extracted based on genes linked to MUC5B, in which node rankings in each topological feature were integrated using the RRA method (Figure 4A, 4B). We found that FOXJ1 was the most important hub gene (Figure 4C) and had a significant difference in expression between the 3 subtypes (Figure 4D). In addition, FOXJ1 is a marker of ciliated-to-goblet transdifferentiation [28,29] and cilia development [30], and RFX3 is the transcriptional co-activator to FOXJ1 [31].
Correlation analysis showed that MUC5B was positively correlated with FOXJ1 (Pearson’s r=0.63, P<0.001) and RFX3 (Pearson’s r=0.57, P<0.001), respectively. The shape of the loess fitting curves indicated that there is a threshold for FOXJ1/RFX3 expression (Figure 5A, 5B). The slope of the curve after the threshold is greater than the threshold of the curve before the threshold. Additionally, FOXJ1 was positively associated with RFX3 (Pearson’s r=0.72, P<0.001; Figure 5C).
Further subgroup analysis of the 3 subtypes showed that a significant positive relationship was observed between MUC5B and FOXJ1/RFX3 (Figure 5D, 5E) only in subtype 1 (FOXJ1, Pearson’s r=0.67, P<0.001; RFX3, Pearson’s r=0.68, P<0.001), and only subtype 1 and subtype 3 showed a significant positive correlation between FOXJ1 and RFX3 (subtype 1, Pearson’s r=0.86, P<0.001; subtype 3, Pearson’s r=0.54, P<0.001; Figure 5F).
THREE SUBTYPES DIFFER IN IMMUNE MICROENVIRONMENT CHARACTERISTICS:
We utilized the xCell algorithm to estimate the relative abundance of 10 cells from the expression profile of COPD-affected lung tissue. As shown in Figure 6A, there was a significant difference in the degree of immune cell infiltration between the 3 subtypes, which differed in immune microenvironment characteristics.
As shown in Figure 6A, compared with subtypes 2 and 3, subtype 1 had a lower fraction of Tregs (subtype 1 vs subtype 2, P=0.013; subtype 1 vs subtype 3, P=0.028) and a higher level of Th1 cells (subtype 1 vs subtype 2, P=0.013; subtype 1 vs subtype 3, P=0.043), but Th2 cell infiltration among the 3 subtypes showed no significant difference. The fractions of macrophages M2 and mast cells were significantly lower in subtype 1. Subtype 3 had a significantly higher level of neutrophils than subtypes 1 and 2 (subtype 1 vs subtype 3, P=0.014; subtype 2 vs subtype 3, P=0.046), which was consistent with the ssGSEA results. What is particularly noteworthy is that basophil infiltration was significantly increased in subtype 1 (subtype 1 vs subtype 2, P=2.7×10⁻⁵; subtype 1 vs subtype 3, P=1.6×10⁻³).
To verify and complement the results of xCell evaluation, we used the ssGSEA algorithm to reanalyze the immune microenvironment of lung tissue in COPD. As shown in Figure 6B, the scores for Th1 and Th2 cells in subtype 1 were higher compared with subtypes 2 and 3, while no consistent result was found in the scores for activated Th1 cells and Th2 cells. However, the ratio of the scores for Th1 cells to Th2 cells was not significantly different between the 3 subtypes, and consistent results were found for the activated Th1/Th2 cells score. In contrast with the results calculated by xCell, the level of eosinophil infiltration in subtype 1 was significantly lower than that in subtypes 2 and 3 in the ssGSEA calculation. In addition, the ratio of Th17 cells to Tregs in subtype 1 was higher than the other 2 subtypes.
The NPA analysis showed that only the NPA values of subtypes 2 and 3 were significantly different in neutrophil signaling (Figure 7A). The above results were supported by the results of the xCell and ssGSEA. The lung tissue in subtype 3 possessed a higher degree of neutrophil signaling activation, and the activation of top-10 leading nodes was upregulated, including ALOX5, LTB4R1, IRAK1, leukotriene B4, ICAM1, Myd88, IRAK4, ALOX12, neuroprotectin D1, and lipoxin A4 (Figure 7B). Although there was no statistically significant difference in other 2 comparison groups of NPA values (subtype 1 vs subtype 2, subtype 1 vs subtype 3), the above 10 leading nodes were downregulated in subtype 2 and upregulated in subtype 3, compared with subtype 1. Subtypes 1 and 3 had higher ssGSEA scores for the antimicrobial humoral immune response mediated by antimicrobial peptide than subtype 2 (Figure 7C, 7D).
In summary, lung tissue in subtype 1 displayed higher Th1 and basophil infiltration, higher Th17/Tregs, and lower mast cell and Treg infiltration. Subtypes 2 and 3 demonstrated higher macrophage M2 infiltration in lung tissue, while subtype 3 had higher neutrophil and eosinophil infiltration than subtype 2.
Discussion
Three subtypes were marked with LPA based on 12 gene signatures, which displayed the heterogeneity of MUC5B-related mucus secretion in COPD. The expression level of MUC5B varied from subtype to subtype. However, it was unexpected that the 3 COPD subtypes could not reflect the difference in airflow limitation. A previous study found that the MUC5B/MUC5AC ratio was the factor influencing the lung function [32], so we think the airflow limitation cannot be entirely attributable to the MUC5B expression.
Additionally, a decreased MUC5B level could hamper MCC and airway defense injury [16]. Consistent with that idea, our WGCNA analysis showed that subtype 1 with the highest MUC5B expression had a significantly positive association with MCC. The ssGSEA analysis suggested that subtypes 1 and 3 had a stronger antimicrobial humoral immune response than subtype 2.
Very little is noted in the literature regarding an association between MUC5B expression and the immune microenvironment. Previous observational studies [16] found that the infiltration level of neutrophils and eosinophils was higher in lung tissue with low expression of MUC5B, which was consistent with our results. Of interest, our findings suggest that basophil infiltration may be a new mechanism for regulating the expression of MUC5B. In a review of the literature, we found that basophil infiltration plays a crucial role in emphysema formation [35], and the lower eosinophil/basophil ratio of peripheral blood has been linked to a higher rate of exacerbations in COPD [36]. The SPIROMICS study [37] recently found that patients with low eosinophil counts had a greater degree of obstruction. However, the differences between local and systemic inflammation need to be taken in account.
An important caveat to this type of analysis is the limitations of how well inferred values from transcriptomic databases can reflect immune infiltration. Secondly, our subtypes need to be verified in a dataset based on a larger sample size. In addition, the infiltration of immune cells in the lung tissue of COPD is not uniform, and different sampling locations may affect the inferred results of immune infiltration. Despite such limitation, this transcriptome-based approach provides insights on the interaction between the immune microenvironment and mucus secretion in COPD. Future experiments are needed to verify the results and conclusion.
Conclusions
Overall, this work identified 3 MUC5B-associated molecular subtypes, which deepens the understanding of MUC5B-related airway mucus secretion in COPD and could provide valuable information for precision therapy.
Figures
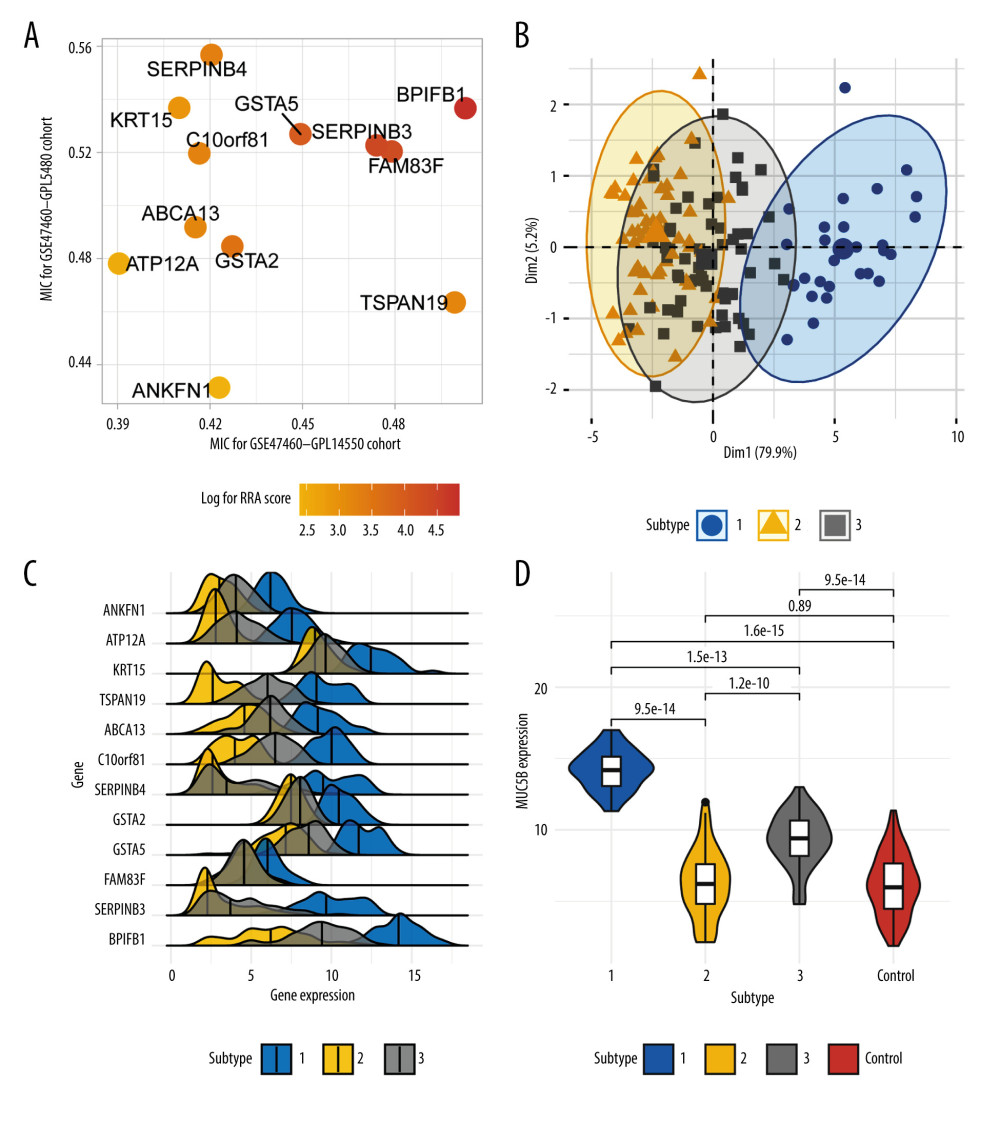 Figure 1. The disease subtype of chronic obstructive pulmonary disease related to mucus hypersecretion. (A) The maximal information coefficient (MIC) values in 2 datasets. (B) Principal components analysis plot for 3 subtypes in the GSE47460-GPL14550 dataset. (C) Ridgeline plot showing differences of expression values of 12 gene signatures in 3 subtypes. (D) Violin and box plot gave a significant difference in MUC5B expression.
 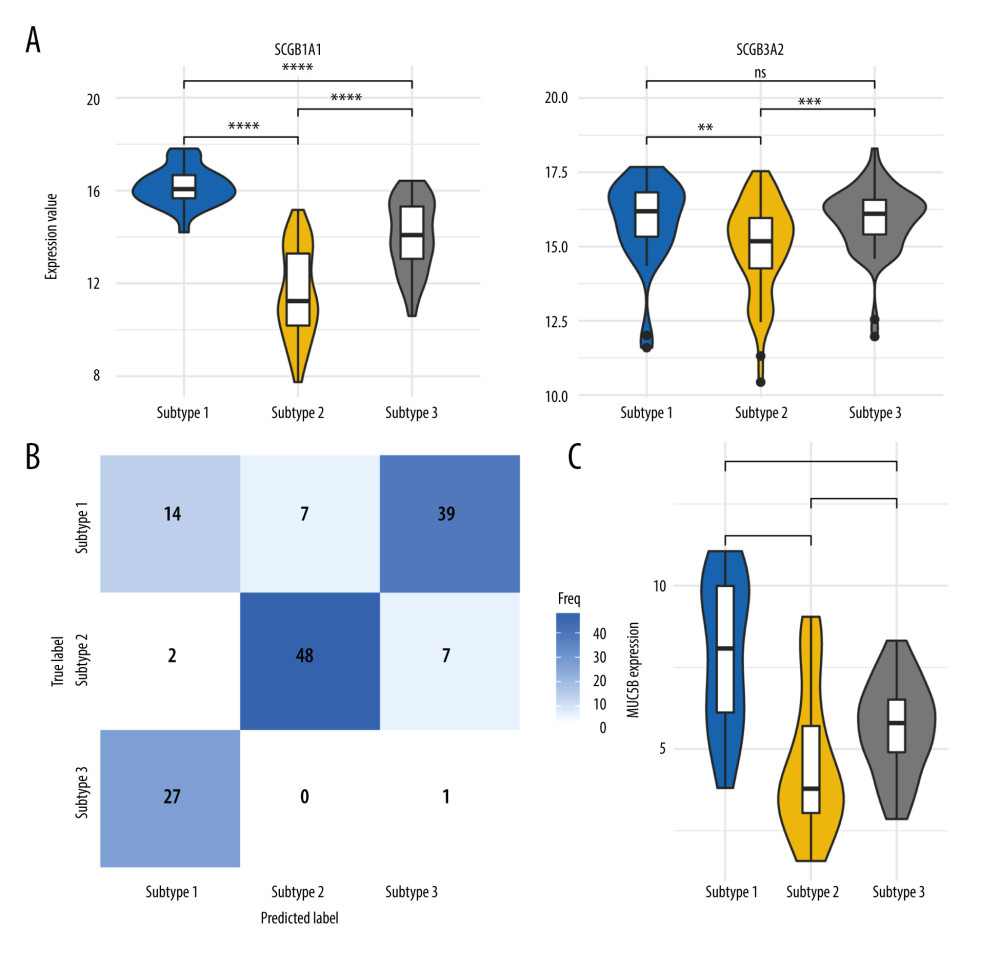 Figure 2. Verification of chronic obstructive pulmonary disease subtypes. (A) Difference in SCGB1A1 and SCGB3A2 between 3 subtypes in the GSE47460-GPL14550 dataset. (B) Confusion matrix showing the performance of classifier. (C) Three subtypes displaying high robustness verified on the GSE47460-GPL6480 dataset. ns, no significance.
 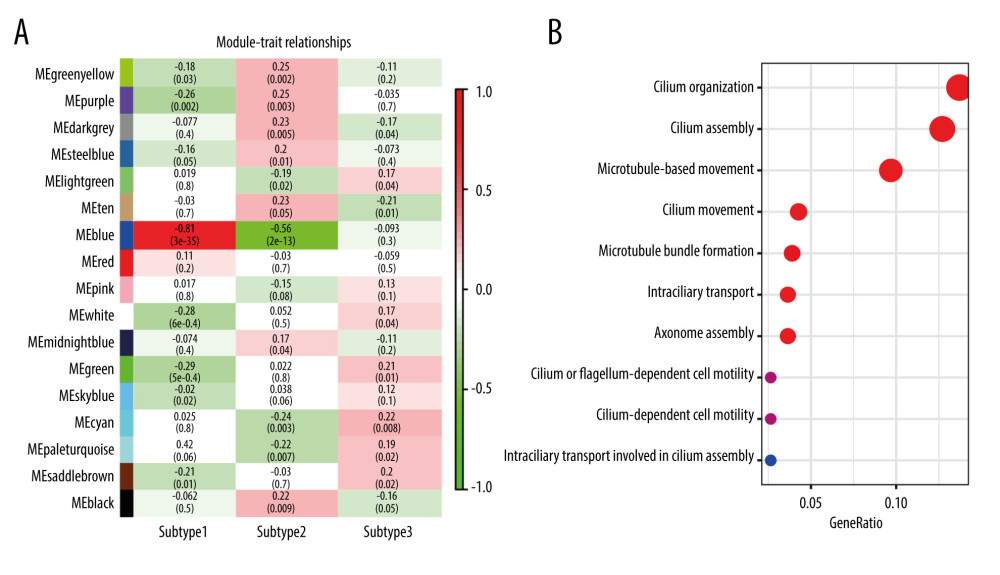 Figure 3. The Module-trait relationships and biological functions of key modules. (A) Module-trait relationships. (B) Biological functions of MEblue with gene ontology analysis.
 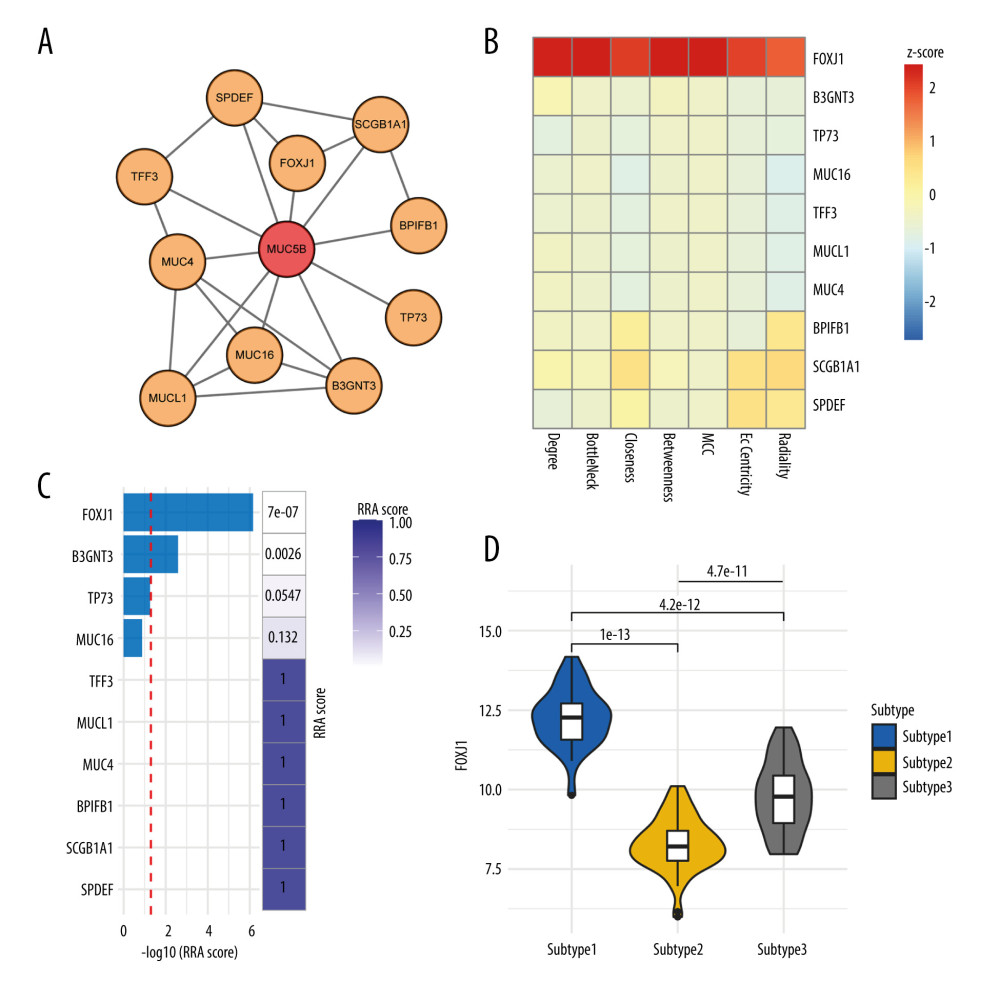 Figure 4. MUC5B-associated subnetwork analysis in the MEblue. (A) Protein-protein interaction subnetwork of the MUC5B-associated genes in the MEblue. (B) Heatmap displaying the result of network topological analysis. (C) Network node importance sorted by robust rank aggregation (RRA) method. (D) Difference in FOXJ1 expression between the 3 subtypes.
 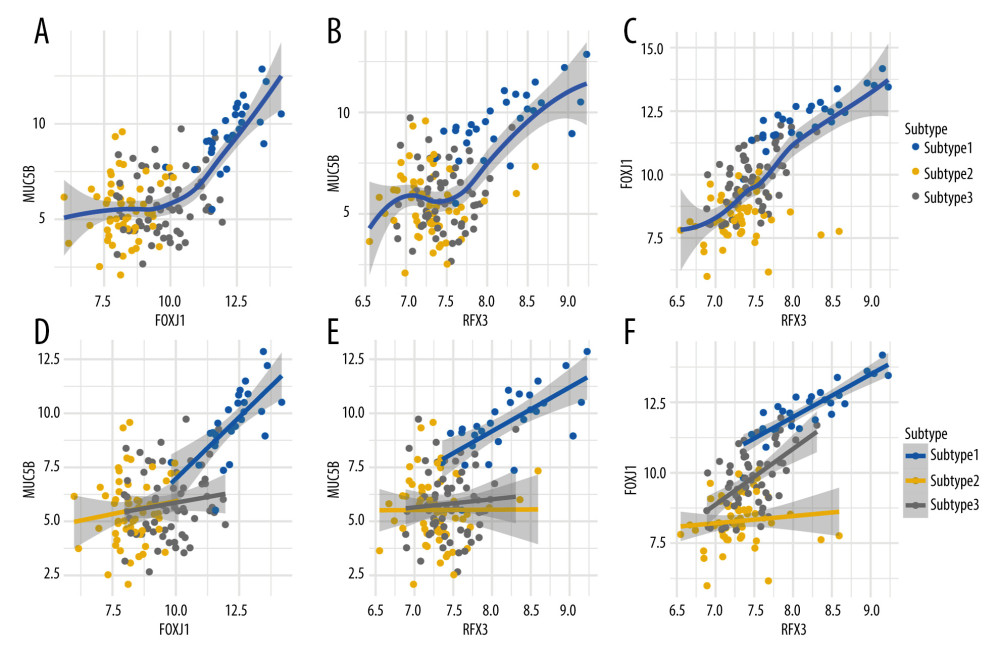 Figure 5. Expression association between MUC5B and FOXJ1/RFX3. (A, B) Curves fitted using loess showing the MUC5B expression association with (A) FOXJ1 and (B) RFX3. (C) Curves fitted using loess showing the expression relationship between FOXJ1 and RFX3. (D, E) Curves fitted using linear regression displaying the MUC5B expression association with (D) FOXJ1 and (E) RFX3 in 3 subtypes. (F) Curves fitted using linear regression displaying the expression association between FOXJ1 and RFX3 in 3 subtypes.
 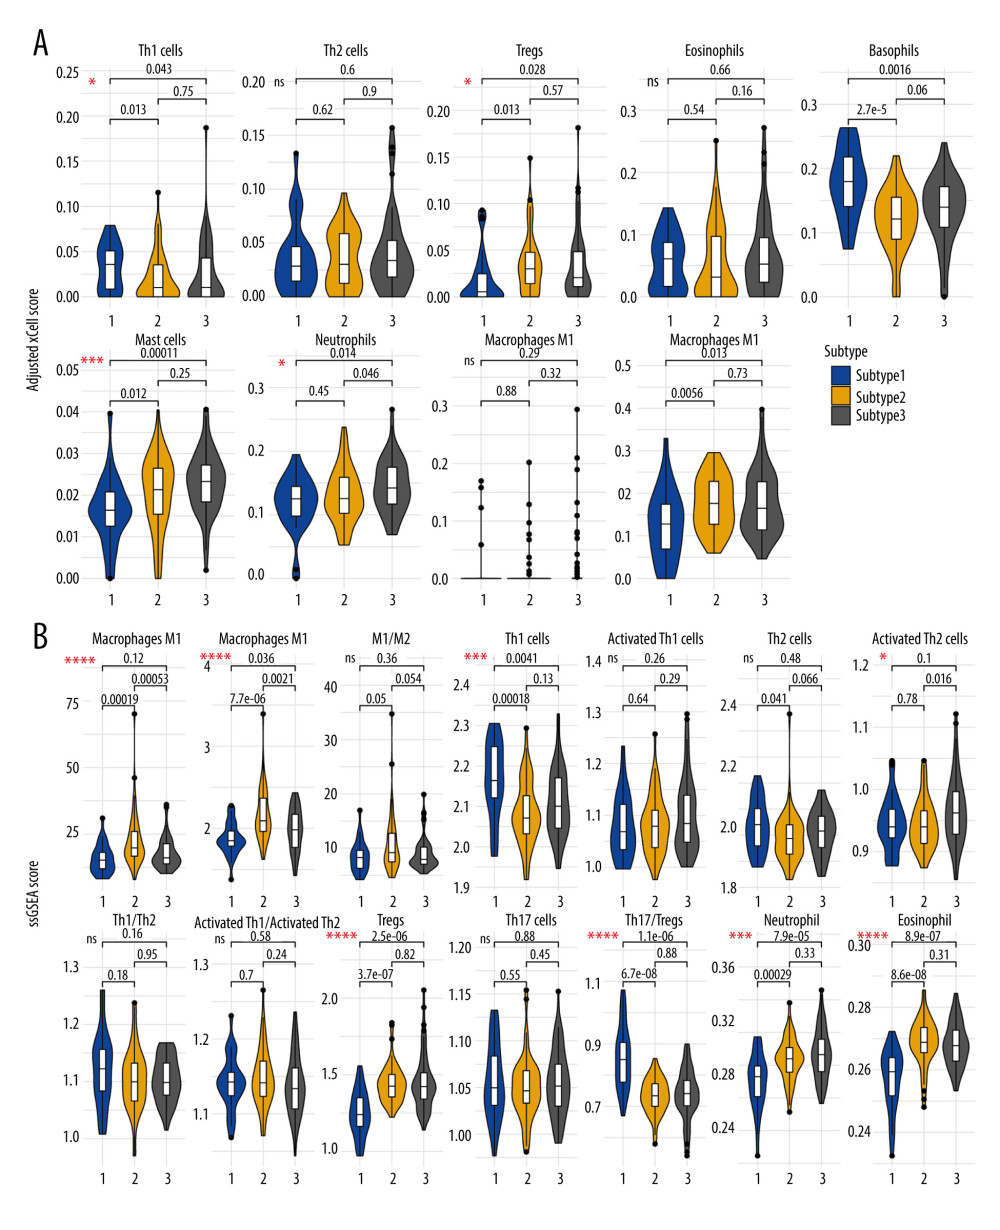 Figure 6. Immune microenvironments in chronic obstructive pulmonary disease-affected lung tissue. (A) Relative abundance of immune cell estimated by xCell algorithm. (B) Immune score estimated by ssGSEA algorithm. P-value: ns, no significance; * P<0.05; ** P<0.01; *** P<0.001; **** P<0.0001.
 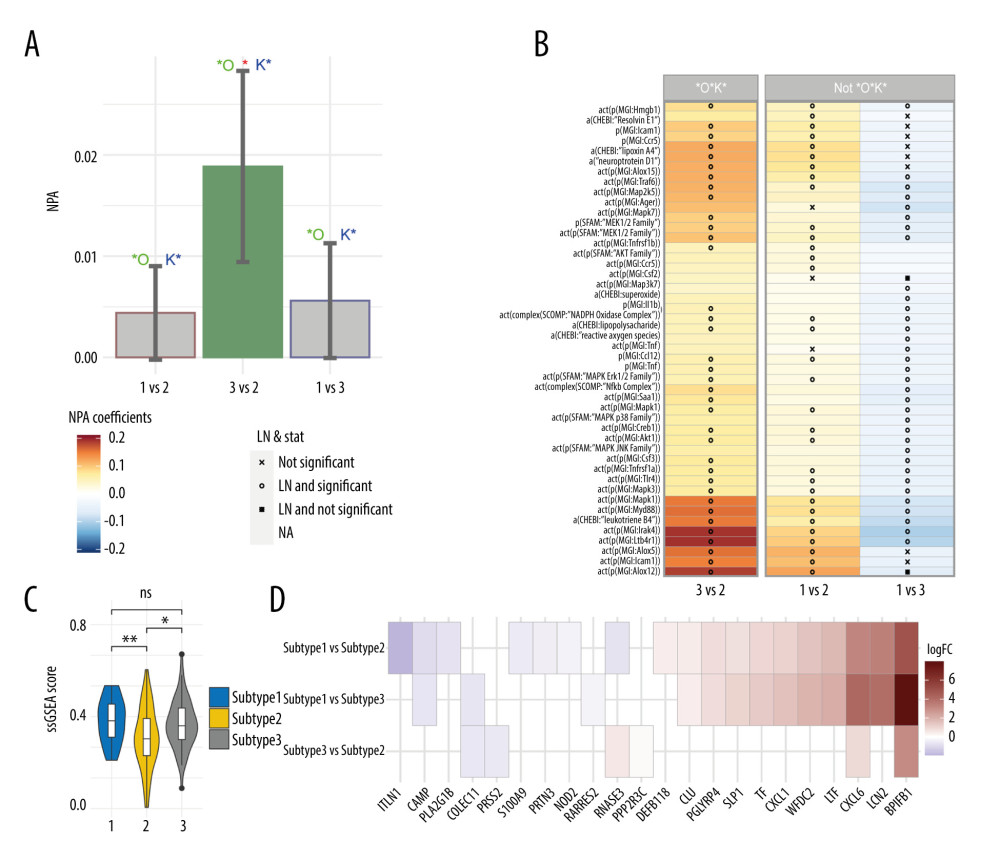 Figure 7. Difference in neutrophil signaling among 3 subtypes. (A) Bar chart of network perturbation amplitude (NPA) score among 3 subtypes. The gray bars represent no statistical significance. (B) Heatmap showing the NPA coefficients with leading nodes. (C) Difference in ssGSEA score of the antimicrobial humoral immune response mediated by antimicrobial peptide between the 3 subtypes (GO: 0061844). (D) Heatmap displaying the gene expression for the antimicrobial humoral immune response mediated by antimicrobial peptide between the 3 subtypes (GO: 0061844).
 Tables
Table 1. Differences in clinical characteristics among subtypes in the GSE47460-GPL14550 dataset.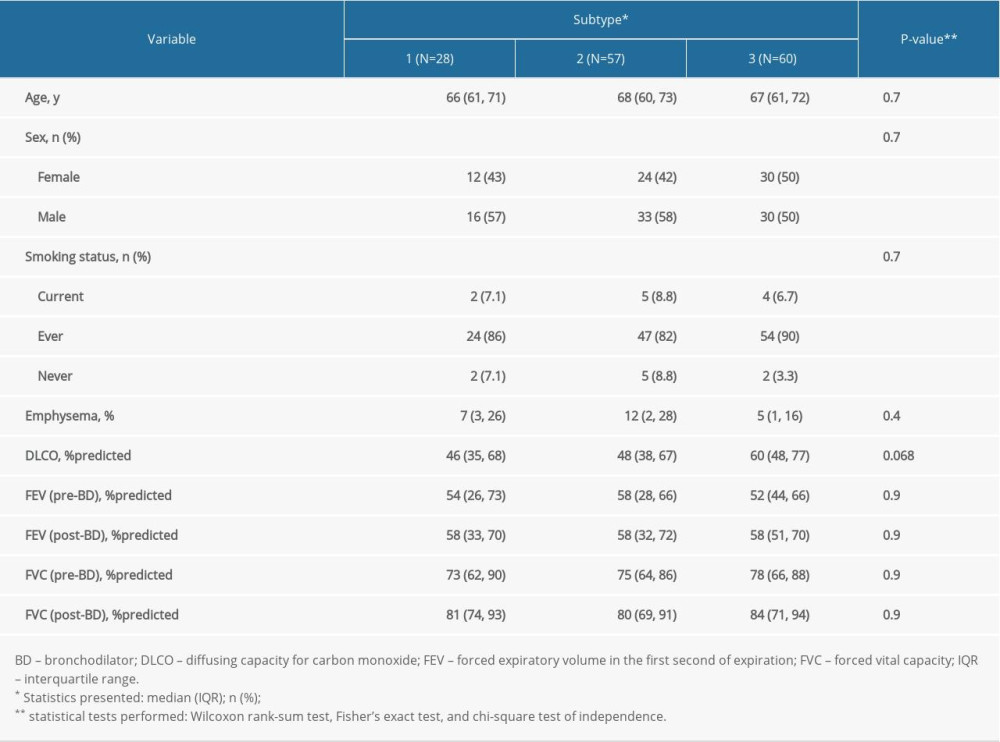 Supplementary Table 1. Clinical characteristics in the GSE47460-GPL14550 and GSE47460-GPL6480 dataset.
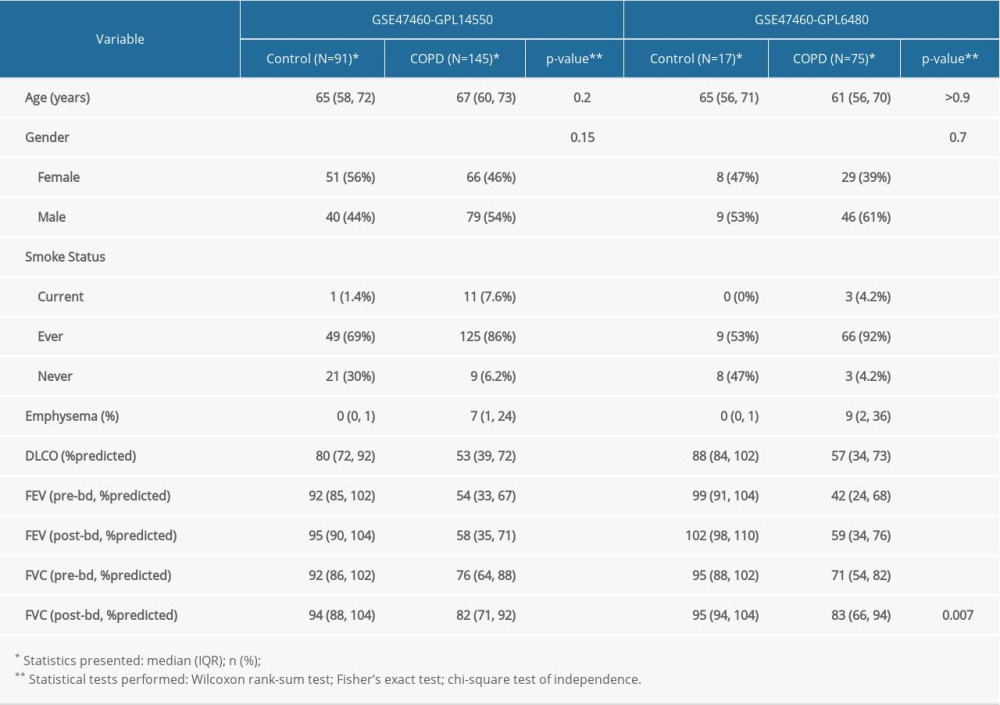 Supplementary Table 2. The source and detailed method of gene signature used to calculate ssgsea score.
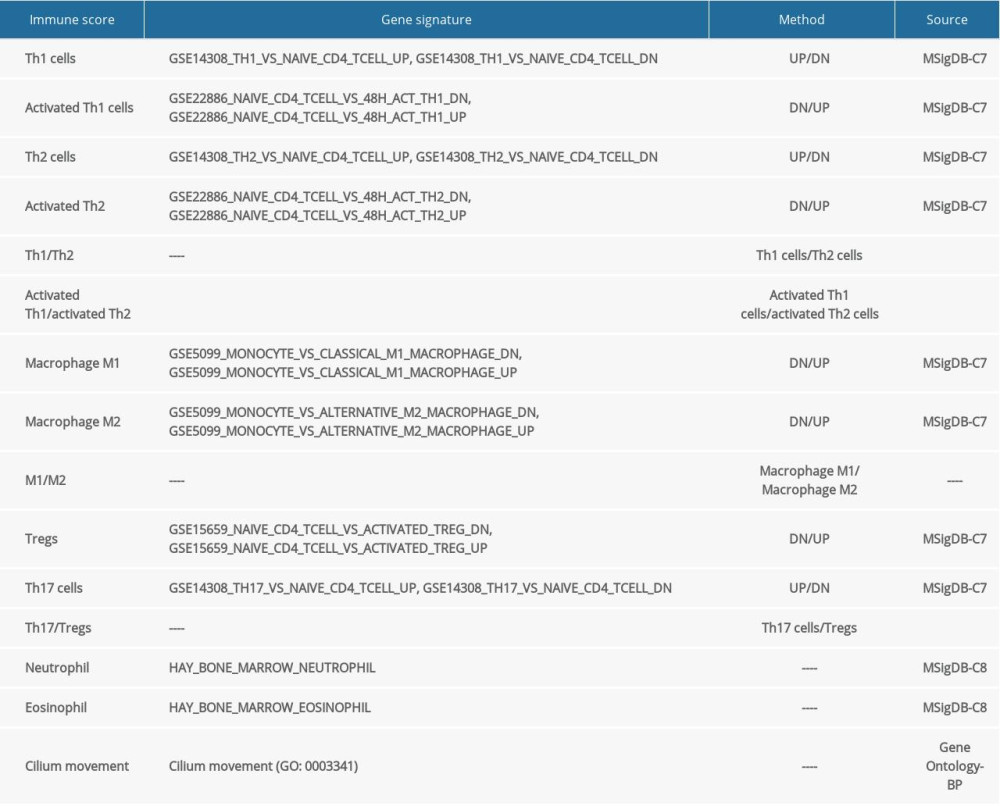 Supplementary Table 3. Evaluation of fitted multiple latent profile analysis models.
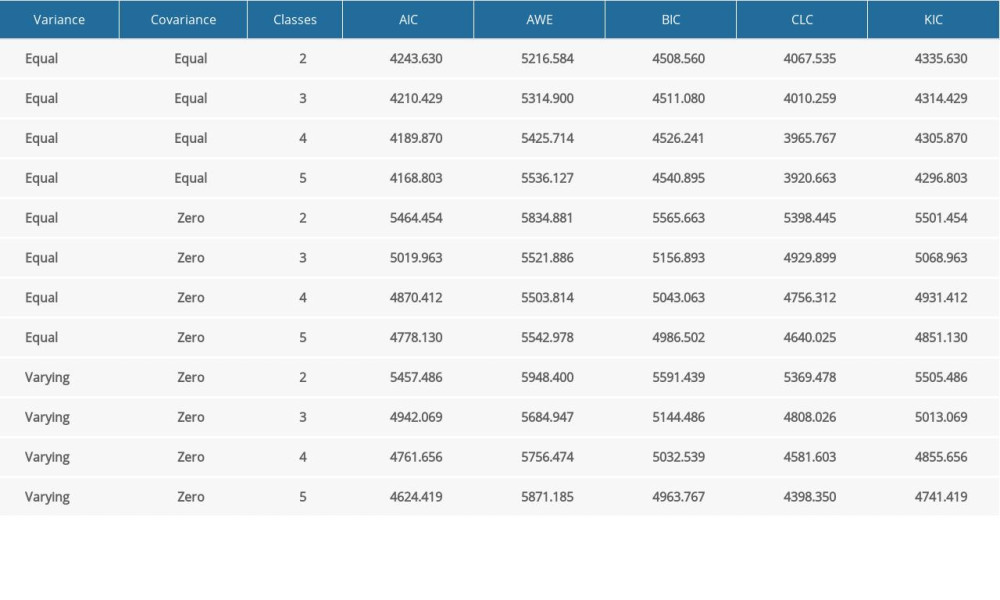 Supplementary Table 4. Differences in clinical characteristics among subtypes in the GSE47460-GPL6480 dataset.
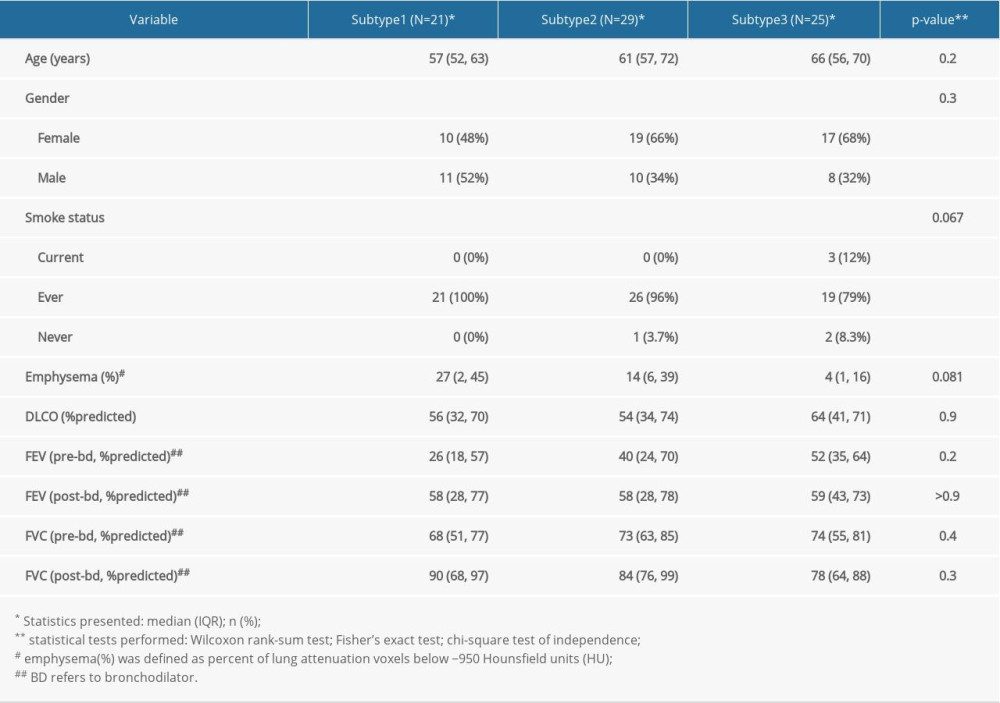
References
1. Evans CM, Fingerlin TE, Schwarz MI, Idiopathic pulmonary fibrosis: A genetic disease that involves mucociliary dysfunction of the peripheral airways: Physiol Rev, 2016; 96; 1567-91
2. Agusti A, Calverley PMA, Celli B, Characterisation of COPD heterogeneity in the ECLIPSE cohort: Respir Res, 2010; 11; 122
3. de Oca MM, Halbert RJ, Lopez MV, The chronic bronchitis phenotype in subjects with and without COPD: the PLATINO study: Eur Respir J, 2012; 40; 28-36
4. Kim V, Han MK, Vance GB, The chronic bronchitic phenotype of COPD: An analysis of the COPDGene Study: Chest, 2011; 140; 626-33
5. Burgel PR, Nesme-Meyer P, Chanez P, Cough and sputum production are associated with frequent exacerbations and hospitalizations in COPD subjects: Chest, 2009; 135; 975-82
6. Vestbo J, Prescott E, Lange P, Association of chronic mucus hypersecretion with FEV1 decline and chronic obstructive pulmonary disease morbidity. Copenhagen City Heart Study Group: Am J Respir Crit Care Med, 1996; 153; 1530-35
7. Pelkonen M, Notkola I-L, Nissinen A, Thirty-year cumulative incidence of chronic bronchitis and COPD in relation to 30-year pulmonary function and 40-year mortality: A follow-up in middle-aged rural men: Chest, 2006; 130; 1129-37
8. Guerra S, Sherrill DL, Venker C, Chronic bronchitis before age 50 years predicts incident airflow limitation and mortality risk: Thorax, 2009; 64; 894-900
9. Ramos FL, Krahnke JS, Kim V, Clinical issues of mucus accumulation in COPD: Int J Chron Obstruct Pulmon Dis, 2014; 9; 139-50
10. Liu L, Shastry S, Byan-Parker S, An autoregulatory mechanism governing mucociliary transport is sensitive to mucus load: Am J Respir Cell Mol Biol, 2014; 51; 485-93
11. Kirkham S, Sheehan JK, Knight D, Heterogeneity of airways mucus: Variations in the amounts and glycoforms of the major oligomeric mucins MUC5AC and MUC5B: Biochem J, 2002; 361(Pt 3); 537-46
12. Caramori G, Di Gregorio C, Carlstedt I, Mucin expression in peripheral airways of patients with chronic obstructive pulmonary disease: Histopathology, 2004; 45; 477-84
13. O’Donnell RA, Richter A, Ward J, Expression of ErbB receptors and mucins in the airways of long-term current smokers: Thorax, 2004; 59; 1032-40
14. Livraghi-Butrico A, Grubb BR, Wilkinson KJ, Contribution of mucus concentration and secreted mucins Muc5ac and Muc5b to the pathogenesis of muco-obstructive lung disease: Mucosal Immunol, 2017; 10; 395-407
15. Kirkham S, Kolsum U, Rousseau K, MUC5B is the major mucin in the gel phase of sputum in chronic obstructive pulmonary disease: Am J Respir Crit Care Med, 2008; 178; 1033-39
16. Roy MG, Livraghi-Butrico A, Fletcher AA, Muc5b is required for airway defense: Nature, 2014; 505; 412-16
17. Woodruff PG, van den Berge M, Boucher RC, American Thoracic Society/National Heart, Lung, and Blood Institute Asthma – chronic obstructive pulmonary disease overlap workshop report: Am J Respir Crit Care Med, 2017; 196; 375-81
18. Akogul S, Erisoglu M, An approach for determining the number of clusters in a model-based cluster analysis: Entropy, 2017; 19; 452
19. Rosenberg JM, Beymer PN, Anderson DJ, tidyLPA: An R package to easily carry out latent profile analysis (LPA) using open-source or commercial software: Journal of Open Source Software, 2019; 3; 978
20. Chen F, Chandrashekar DS, Varambally S, Creighton CJ, Pan-cancer molecular subtypes revealed by mass-spectrometry-based proteomic characterization of more than 500 human cancers: Nat Commun, 2019; 10; 5679
21. Aran D, Hu Z, Butte AJ, xCell: Digitally portraying the tissue cellular heterogeneity landscape: Genome Biol, 2017; 18; 220
22. Martin F, Sewer A, Talikka M, Quantification of biological network perturbations for mechanistic insight and diagnostics using two-layer causal models: BMC Bioinformatics, 2014; 15; 238
23. Boué S, Talikka M, Westra JW, Causal biological network database: A comprehensive platform of causal biological network models focused on the pulmonary and vascular systems: Database (Oxford), 2015; 2015; bav030
24. Martin F, Gubian S, Talikka M, NPA: An R package for computing network perturbation amplitudes using gene expression data and two-layer networks: BMC Bioinformatics, 2019; 20(1); 451
25. Catlett NL, Bargnesi AJ, Ungerer S, Reverse causal reasoning: applying qualitative causal knowledge to the interpretation of high-throughput data: BMC Bioinformatics, 2013; 14; 340
26. Okuda K, Chen G, Subramani DB, Localization of secretory mucins MUC5AC and MUC5B in normal/healthy human airways: Am J Respir Crit Care Med, 2018; 199; 715-27
27. Reynolds SD, Reynolds PR, Pryhuber GS, Secretoglobins SCGB3A1 and SCGB3A2 define secretory cell subsets in mouse and human airways: Am J Respir Crit Care Med, 2002; 166; 1498-509
28. Turner J, Roger J, Fitau J, Goblet cells are derived from a FOXJ1-expressing progenitor in a human airway epithelium: Am J Respir Cell Mol Biol, 2011; 44; 276-84
29. Ghosh M, Miller YE, Nakachi I, Exhaustion of airway basal progenitor cells in early and established chronic obstructive pulmonary disease: Am J Respir Crit Care Med, 2017; 197; 885-96
30. Whitsett JA, Airway epithelial differentiation and mucociliary clearance: Ann Am Thorac Soc, 2018; 15(Suppl 3); S143-48
31. Didon L, Zwick RK, Chao IW, RFX3 Modulation of FOXJ1 regulation of cilia genes in the human airway epithelium: Respir Res, 2013; 14; 70
32. Song Y, Wang W, Xie Y, Carbocisteine inhibits the expression of Muc5b in COPD mouse model: Drug Des Devel Ther, 2019; 13; 3259-68
33. Donoghue LJ, Livraghi-Butrico A, McFadden KM, Identification of trans protein QTL for secreted airway mucins in mice and a causal role for Bpifb1: Genetics, 2017; 207; 801-12
34. Bingle CD, Wilson K, Lunn H, Human LPLUNC1 is a secreted product of goblet cells and minor glands of the respiratory and upper aerodigestive tracts: Histochem Cell Biol, 2010; 133; 505-15
35. Shibata S, Miyake K, Tateishi T, Basophils trigger emphysema development in a murine model of COPD through IL-4-mediated generation of MMP-12-producing macrophages: Proc Natl Acad Sci USA, 2018; 115; 13057-62
36. Nuñez A, Marras V, Harlander M, Association between routine blood biomarkers and clinical phenotypes and exacerbations in chronic obstructive pulmonary disease: Int J Chron Obstruct Pulmon Dis, 2020; 15; 681-90
37. Weir M, Zhao H, Han MK, Eosinophils in chronic obstructive pulmonary disease, The SPIROMICS Cohort. In: D41: COPD: Biomarkers in Stable Disease and Exacerbations American Thoracic Society, 2014; A5902
Figures
Figure 1. The disease subtype of chronic obstructive pulmonary disease related to mucus hypersecretion. (A) The maximal information coefficient (MIC) values in 2 datasets. (B) Principal components analysis plot for 3 subtypes in the GSE47460-GPL14550 dataset. (C) Ridgeline plot showing differences of expression values of 12 gene signatures in 3 subtypes. (D) Violin and box plot gave a significant difference in MUC5B expression.Figure 2. Verification of chronic obstructive pulmonary disease subtypes. (A) Difference in SCGB1A1 and SCGB3A2 between 3 subtypes in the GSE47460-GPL14550 dataset. (B) Confusion matrix showing the performance of classifier. (C) Three subtypes displaying high robustness verified on the GSE47460-GPL6480 dataset. ns, no significance.Figure 3. The Module-trait relationships and biological functions of key modules. (A) Module-trait relationships. (B) Biological functions of MEblue with gene ontology analysis.Figure 4. MUC5B-associated subnetwork analysis in the MEblue. (A) Protein-protein interaction subnetwork of the MUC5B-associated genes in the MEblue. (B) Heatmap displaying the result of network topological analysis. (C) Network node importance sorted by robust rank aggregation (RRA) method. (D) Difference in FOXJ1 expression between the 3 subtypes.Figure 5. Expression association between MUC5B and FOXJ1/RFX3. (A, B) Curves fitted using loess showing the MUC5B expression association with (A) FOXJ1 and (B) RFX3. (C) Curves fitted using loess showing the expression relationship between FOXJ1 and RFX3. (D, E) Curves fitted using linear regression displaying the MUC5B expression association with (D) FOXJ1 and (E) RFX3 in 3 subtypes. (F) Curves fitted using linear regression displaying the expression association between FOXJ1 and RFX3 in 3 subtypes.Figure 6. Immune microenvironments in chronic obstructive pulmonary disease-affected lung tissue. (A) Relative abundance of immune cell estimated by xCell algorithm. (B) Immune score estimated by ssGSEA algorithm. P-value: ns, no significance; * P<0.05; ** P<0.01; *** P<0.001; **** P<0.0001.Figure 7. Difference in neutrophil signaling among 3 subtypes. (A) Bar chart of network perturbation amplitude (NPA) score among 3 subtypes. The gray bars represent no statistical significance. (B) Heatmap showing the NPA coefficients with leading nodes. (C) Difference in ssGSEA score of the antimicrobial humoral immune response mediated by antimicrobial peptide between the 3 subtypes (GO: 0061844). (D) Heatmap displaying the gene expression for the antimicrobial humoral immune response mediated by antimicrobial peptide between the 3 subtypes (GO: 0061844). Tables
Table 1. Differences in clinical characteristics among subtypes in the GSE47460-GPL14550 dataset.Table 1. Differences in clinical characteristics among subtypes in the GSE47460-GPL14550 dataset.Supplementary Table 1. Clinical characteristics in the GSE47460-GPL14550 and GSE47460-GPL6480 dataset.Supplementary Table 2. The source and detailed method of gene signature used to calculate ssgsea score.Supplementary Table 3. Evaluation of fitted multiple latent profile analysis models.Supplementary Table 4. Differences in clinical characteristics among subtypes in the GSE47460-GPL6480 dataset. In Press
Clinical Research
Effects of Single-Bout Endurance Exercise Intensity on Peripheral Neurotrophic Factors in Patients With Isc...Med Sci Monit In Press; DOI: 10.12659/MSM.952089
Review article
Anisodus tanguticus in Cancer Research: A Review of Traditional Use, Phytochemistry, Extraction Methods, an...Med Sci Monit In Press; DOI: 10.12659/MSM.952999
Clinical Research
Nasal Mucociliary Clearance and Its Relationship With Disease Severity in Patients With Multiple SclerosisMed Sci Monit In Press; DOI: 10.12659/MSM.952850
Clinical Research
Modified Thoracoabdominal Nerves Block Through the Perichondrial Approach vs Subcostal Transversus Abdomini...Med Sci Monit In Press; DOI: 10.12659/MSM.953976
Most Viewed Current Articles
17 Jan 2024 : Review article 14,176,570
Vaccination Guidelines for Pregnant Women: Addressing COVID-19 and the Omicron VariantDOI :10.12659/MSM.942799
Med Sci Monit 2024; 30:e942799
13 Nov 2021 : Clinical Research 3,762,188
Acceptance of COVID-19 Vaccination and Its Associated Factors Among Cancer Patients Attending the Oncology ...DOI :10.12659/MSM.932788
Med Sci Monit 2021; 27:e932788
14 Dec 2022 : Clinical Research 2,466,310
Prevalence and Variability of Allergen-Specific Immunoglobulin E in Patients with Elevated Tryptase LevelsDOI :10.12659/MSM.937990
Med Sci Monit 2022; 28:e937990
16 May 2023 : Clinical Research 708,927
Electrophysiological Testing for an Auditory Processing Disorder and Reading Performance in 54 School Stude...DOI :10.12659/MSM.940387
Med Sci Monit 2023; 29:e940387